Dwelling and household size
Matching dwelling size to household size
Key findings
- 4% of public rental housing and community housing was considered to be overcrowded, as was 10% of SOMIH.
- Overcrowding was highest in Queensland for SOMIH (13%) and in the Northern Territory for public rental housing (7%).
- 16% of public rental housing, 23% of SOMIH and 12% of mainstream community housing was considered to be underutilised.
- Underutilisation was highest in South Australia (26% of public rental housing and 28% for SOMIH).
A large part of providing affordable housing that meets the needs of individuals and families is ensuring that a dwelling is of an adequate size to meet the needs of the household. Matching dwelling size to household size is not a straightforward process. It is heavily influenced by the availability of dwellings, their age and location, (and the availability of options and cost to relocate existing tenants as well as their willingness to relocate). The accepted standard by which the dwelling size requirements of a given household are measured in Australia is the Canadian National Occupancy Standard (CNOS).
The current stock of social housing was originally built to accommodate the needs of working families (Department of Prime Minister and Cabinet, 2014). About 45% of current public rental housing stock, 83% of state owned and managed Indigenous housing (SOMIH) and 33% of mainstream community housing, are houses with 3 or more bedrooms. In contrast, the profile of social housing tenants has changed over time with just over half (52%) of all tenants in 2014–15 now being single adults. This compares to just under half (49%) of public housing households and less than one quarter (21%) of SOMIH households in 2004–05 being comprised of single adults (comparable figures for community housing households are unavailable).
As at 30 June 2015, the majority of social housing households (around 80%) were considered to be residing in dwellings adequate to their household composition.
Canadian National Occupancy Standard (CNOS)
A measure of the appropriateness of housing that is sensitive to both household size and composition, the CNOS specifies that:
- No more than 2 people shall share a bedroom
- Parents or couples may share a bedroom
- Children under 5, either of the same sex or opposite sex, may share a bedroom
- Children under 18 of the same sex may share a bedroom
- A child aged 5–17 should not share a bedroom with a child under 5 of the opposite sex
- Single adults 18 and over and any unpaired children require a separate bedroom.
Whilst the CNOS is a useful guide to the proportion of dwellings that may be under-utilised, or proportion of households potentially living in over-crowded conditions, there are some cases where a dwelling may not match a household size for good reason. For example, where custody of children is shared; where tenants may have live-in care arrangements; or to take into consideration future needs of children who may need separate bedrooms in years to come.
Overcrowding
In basic terms, overcrowding occurs when the dwelling is too small for the size and composition of the household living in it. A dwelling requiring at least 1 additional bedroom is designated as 'overcrowded' in Australia underpinned by the CNOS standard.
As at 30 June 2015, 4% of both public rental housing and community housing dwellings were overcrowded (see Table DHS.1). Indigenous households were more likely to experience overcrowding, with 10% of SOMIH households classified as overcrowded.
| Social housing program | Overcrowded | Adequate | Under-utilised(a) | Total |
|---|---|---|---|---|
| Public rental housing | 4.4 | 79.6 | 16.0 | 100.0 |
| SOMIH(b) | 9.6 | 67.2 | 23.2 | 100.0 |
| Mainstream community housing(c) | 3.9 | 84.2 | 11.9 | 100.0 |
| All programs | 4.5 | 79.9 | 15.6 | 100.0 |
- The match of dwelling size to registered tenant numbers at a point in time is affected by a range of factors including changes in family structure over time, the match of housing portfolio to demand, and tenant support needs. Housing authority allocation policies do not align with the Canadian National Occupancy Standard and may provide for additional bedrooms including under circumstances such as shared parenting, carer requirements, or expectant mothers.
- Includes all households within the SOMIH program, including non-Indigenous households.
- Data are based on all jurisdictions except Queensland and Northern Territory where data were unavailable.
Notes
- Data are based on the Canadian National Occupancy Standard and include those households where required details are known.
- Data for utilisation in Indigenous community housing were unavailable.
Source: AIHW National Housing Data Repository 2014–15.
Location
The proportion of overcrowded households varied across social housing programs by jurisdictions and remoteness areas.
As at 30 June 2015, the Northern Territory had the highest proportion of overcrowded households in public rental housing (7%), followed by Western Australia (6%). South Australia had the lowest proportion of households living in an overcrowded condition (2%). SOMIH households in Queensland reported the highest proportion of overcrowding (13%), whereas SOMIH households in Tasmania reported the lowest (5%). Community housing households were most overcrowded in Victoria and New South Wales (both at 5%), and least overcrowded in the Australian Capital Territory (less than 1%) (Refer to Supplementary tables for details).
Overall, Indigenous households are more likely than non-Indigenous households to be overcrowded. The higher level of overcrowding among Indigenous households may be associated with a number of factors, including cultural and social factors, higher levels of unmet demand for affordable housing, and geographical location.
Overcrowding in Indigenous households living in social housing increased with remoteness. Indigenous households that were overcrowded in public rental housing were more likely to be in Very remote (13%) and Remote (11%) areas. SOMIH households in Very remote (15%) and Outer regional (11%) areas were also more likely to be overcrowded than other SOMIH households.
Overall, overcrowding within Indigenous households increased with remoteness
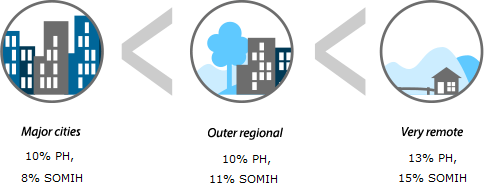
PH=Public Housing
SOMIH=state owned and managed Indigenous housing
Trends
Between 2010–11 and 2014–15, the prevalence of overcrowding has varied across social housing programs. The proportion of SOMIH households living in overcrowded conditions has consistently remained more than twice that of other social housing programs. Overcrowding in public rental housing has remained stable at 4% between 2010–11 and 2014–15, and SOMIH overcrowding also remained stable at 10% over the same period. Overcrowding in community housing has increased from 2% over the same timeframe.
Figure DHS.1: Proportion of overcrowded households in social housing, 2010–11 to 2014–15 (per cent)
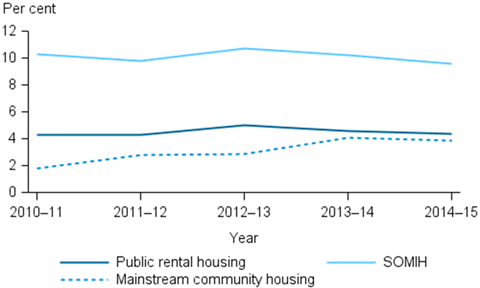
Source: AIHW National Housing Assistance Data Repository, 2014–15. Source data.
Underutilisation
Just as a dwelling can be over-crowded, it can also be underutilised. A dwelling is said to be underutilised when it consists of 2 or more bedrooms surplus to the household requirements. Underutilisation can arise as a household ages and children leave the family home, and particularly where tenants have been living in a home for many years and their economic and community life is centred around that location, and there are no suitable alternatives for relocation. Underutilisation is also in part due to public rental housing being dominated by family-sized homes with 3 or more bedrooms.
As at 30 June 2015, 16% of public rental housing and 12% of community housing dwellings were underutilised (see Table DHS.1). Indigenous households were more likely to experience underutilisation, with 23% of SOMIH households classified as underutilised.
Location
The proportion of underutilised housing varied by jurisdiction and remoteness areas across the social housing programs.
For public rental housing, South Australia had the highest proportion of underutilisation at just over 1 in 4 dwellings (26%), followed by the Australian Capital Territory (17%). The Northern Territory had the lowest proportion of underutilisation (7%) (Refer to Supplementary tables for details).
For SOMIH households, South Australia reported the highest proportion of underutilisation (28%), followed by New South Wales (26%). Queensland reported the lowest proportion of underutilisation (17%).
For community housing households, those in Tasmania (25%) were most underutilised, followed by South Australia (23%). Those in the Australian Capital Territory (2%) were the least underutilised.
The proportion of underutilised households in public rental housing varied substantially across remoteness areas with Outer regional areas most likely to be underutilised (21%) compared to Major Cities (15%) and Remote areas (14%). Underutilisation of SOMIH ranged from 20% in Very Remote areas to 24% in both Major Cities and Inner regional areas.
Trends
Between 2010–11 and 2014–15, trends in underutilisation across community housing households have been varied, whereas SOMIH and public rental housing underutilisation has remained relatively static over time (Figure DHS.2).
Public rental housing underutilisation has remained steady between 2010–11 and 2014–15 at 16%, and SOMIH underutilisation has also remained steady at 23% in 2015. Underutilisation in community housing has increased from 6% in 2010–11 to 12% in 2014–15, however, community housing has maintained comparatively low levels of underutilisation compared to other social housing programs.
Figure DHS.2: Proportion of underutilised households in social housing, 2010–11 to 2014–15 (per cent)
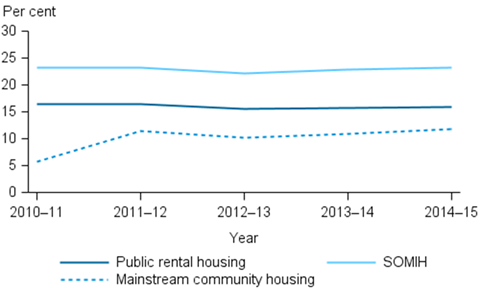
Source: AIHW National Housing Assistance Data Repository, 2014–15. Source data.
References
- Department of Prime Minister and Cabinet 2014. Reform of the Federation White Paper. Issues Paper 2: Roles and Responsibilities in Housing and Homelessness.