Pharmaceuticals
Key findings
View the pharmaceuticalS fact sheet >
In Australia, pharmaceutical drugs are available via a prescription from a registered healthcare professional or over-the-counter (OTC) from pharmacies and other retail outlets, and are widely used to prevent, treat and cure injury and illness. When used appropriately, pharmaceutical drugs are associated with considerable reductions in morbidity and mortality and are an important pillar of public health. However, pharmaceutical drugs are subject to use other than prescribed use.
Box PHARMS1: Non-medical use of pharmaceuticals
Pharmaceutical non-medical use refers to the consumption of a prescription or over-the-counter drug for non-therapeutic purposes or other than directed by a registered healthcare professional (Larance et al. 2011). Pharmaceutical drugs may be consumed for non-medical use for a range of reasons including to induce euphoria, to enhance the effects of alcohol and other drugs, to self-medicate illness or injury, to mitigate the symptoms of withdrawal from alcohol and other drugs, or to improve performance.
In Australia, pharmaceutical drugs that may be used for non-medical purposes include pain-killers/pain-relievers and opioids (pain relievers), pharmaceutical stimulants and sedatives (sleeping/anti-anxiety medications). In recent years, there has also been rising concern about non-medical use of gabapentinoids (particularly pregabalin).
Pain-killers/pain-relievers and opioids are used to treat pain, some respiratory illness, and opioid (including heroin) dependence. Examples include oxycodone, buprenorphine, and codeine.
Pharmaceutical stimulants are medications that are usually prescribed to treat attention deficit hyperacitivy disorder (ADHS) or narcolepsy. Examples include methylphenidate (Ritalin, Concerta) and modafinil (Modavigil).
Sedatives are a group of drugs that cause calming and sedative effects due to their depressive activity on the central nervous system. Benzodiazepines comprise the largest group of drugs in this class and examples include diazepam, alprazolam and temazepam.
Gabapentinoids are a group of drugs that were originally prescribed to manage epilepsy. They are increasingly prescribed for neuropathic pain (nerve pain). Examples include pregabalin and gabapentin.
The non-medical use of pharmaceutical drugs is an ongoing concern internationally, with different pharmaceutical opioids being misused in different regions.
The use of opioids (including the use of pharmaceutical opioids for non-medical purposes) in Australia in 2019 (3.3 per cent of the adult population) remains higher than the global average (1.2% of the global population aged 15–64 years). In 2019, the majority of pharmaceutical misuse in Australia continued to be for codeine (UNODC 2021).
Dramatic increases in opioid-related deaths associated with rising use in the US have led to the problem being declared an 'epidemic' (CDC 2017; U.S. Department of Health & Human Services 2017). In the US in 2019, 3.6% of the population aged 12 and older had misused pharmaceutical opioids at least once in the past year (UNODC 2021).
Availability
The Australian Criminal Intelligence Commission’s (ACIC) Illicit Drug Data Report (IDDR) includes data on prescription pharmaceutical detections at the Australian border. The importation of prescription pharmaceuticals is primarily undertaken by individuals for personal use and without criminal intent (ACIC 2023).
The number of pharmaceutical detections reported at the Australian border only reflect detections of benzodiazepines and opioids (including morphine, buprenorphine, methadone, and oxycodone) (ACIC 2023). In 2020–21:
- There were a total of 1,415 pharmaceutical detections, a increase of 6% since 2011–12 (1,337 detections).
- The majority (64%) of these detections were for benzodiazepines (902 in 2020–21).
- There was a 1,215% increase in the number of pharmaceutical opioid detections over the past decade (39 In 2011-12), increasing to a record high of 513 in 2020–21 (ACIC 2023).
Prescription drug dispensing
AIHW analysis of recent data from the Pharmaceutical Benefits Scheme (PBS) provides information on dispensing of prescription opioids, benzodiazepines and gabapentinoids in Australia (Box PHARMS2). These numbers largely represent medicines being prescribed for and used for their intended purposes. However, drug-related harms are often associated with drug prescribing rates (such as described for opioids in Roxburgh et al. (2017)) so it is important to monitor prescription rates in the context of harm reduction.
Recent data indicate that opioids continue to be dispensed at higher rates than benzodiazepines or gabapentinoids, but rates of dispensing have fallen or remained stable for all 3 drug classes over the past 5 years. Detailed information on specific drug classes and patient characteristics is outlined below.
Box PHARMS2: What is the Pharmaceutical Benefits Scheme?
The Pharmaceutical Benefits Scheme (PBS) was introduced by the Australian Government in 1948 to improve access to necessary medicines. Under the PBS, Australian residents can access a range of medicines at a cheaper price, subsidised by the Government. Most PBS-listed medicines can only be dispensed at a pharmacy (PBS 2022).
Data from the PBS provide information on the number of prescriptions (scripts) dispensed and the number of patients supplied at least one script within a given financial year. The PBS database includes information on a range of medicines that may be used for non-medical purposes or carry a risk of potential for harm (including opioids, benzodiazepines and gabapentinoids). Monitoring dispensing of these medicines under the PBS can provide information on the availability of these drugs among the general Australian population. The PBS also includes data on medicines that are used to help people stop or reduce their tobacco or alcohol consumption.
AIHW analysis of PBS data includes opioids, benzodiazepines, gabapentinoids, smoking cessation medicines and alcohol cessation medicines. See the Technical notes for a full list of item codes.
Dispensing of selected medicines by drug class and generic name
Data from the PBS indicate that in 2021–22:
- Around 13.3 million opioid scripts were dispensed to 2.9 million patients for pain relief, a rate of around 51,400 scripts and 11,200 patients per 100,000 population (not including prescriptions for the treatment of opioid dependence as these data are not available in the PBS) (Figure PHARMS1; tables PBS1–4).
- Oxycodone had the highest rate of scripts dispensed (18,200 scripts per 100,000 persons, compared with 13,200 for codeine). However, more patients were dispensed codeine than oxycodone (5,900 per 100,000 persons and 4,400 per 100,000 persons respectively). This may indicate that a higher number of PBS scripts for oxycodone were dispensed per patient than for codeine (Figure PHARMS1).
- Around 4.9 million benzodiazepine scripts were dispensed to 1.4 million patients, a rate of 18,900 scripts and 5,400 patients per 100,000 population. Diazepam had the highest rates of dispensing among benzodiazepine drugs (Figure PHARMS1; tables PBS21–24).
- Approximately 4.2 million gabapentinoid prescriptions were dispensed to 613,000 patients, a rate of around 16,300 scripts and 2,400 patients per 100,000 population. Pregabalin had the highest rates of dispensing among gabapentinoid drugs (Figure PHARMS1; tables PBS45–48).
Rates of dispensing across all drug classes were typically highest in Inner regional and Outer regional areas. See Data by region for information on PBS dispensing by remoteness area and state/territory.
Figure PHARMS1: PBS prescriptions dispensed or patients who were dispensed selected opioids, benzodiazepines or gabapentinoids, by drug class and generic name, 2012–13 to 2021–22 (number or rate per 100,000)
This figure shows that the age-standardised rate of opioid scripts dispensed increased from 53,801 per 100,000 population in 2012–13 to 58,485 per 100,000 in 2015–16, before declining to 45,083 per 100,000 in 2021–22. The rate of benzodiazepine scripts dispensed steadily decreased from 26,496 per 100,000 population in 2012–13 to 16,977 per 100,000 in 2021–22.
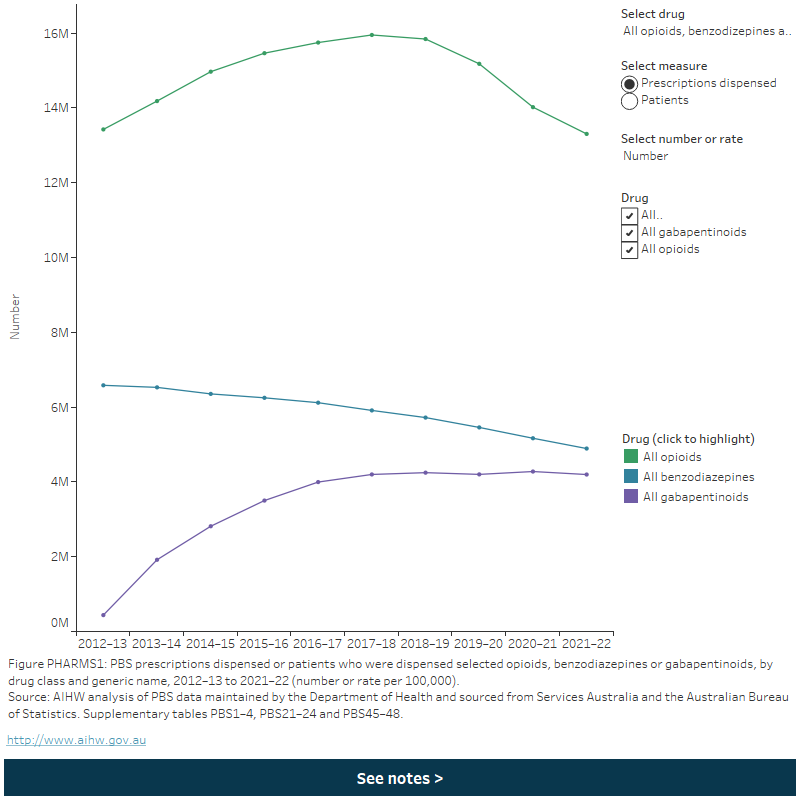
Between 2012–13 and 2021–22:
- Opioid dispensing rates increased overall up to 2016–17 but have declined since. This was consistent for most opioid drugs except tapentadol, where rates of scripts dispensed increased consistently following its listing on the PBS in 2013–14 (Figure PHARMS1; tables PBS2 and PBS4).
- Benzodiazepine dispensing rates steadily declined across the period. This was consistent across most benzodiazepine drugs, except diazepam where the rate of patients increased to 2018–19 before declining to 2021–22 (Figure PHARMS1; tables PBS22 and PBS24).
- Gabapentin dispensing rates increased to 2017–18 but have been declining since around 2018–19 (Figure PHARMS1; tables PBS46 and PBS48). This varied by gabapentinoid drug:
- Pregabalin dispensing rates increased by 12 times (from an age-standardised rate of 1,300 to 14,600 per 100,000 and a crude rate of 1,400 to 16,400 per 100,000) between 2012–13 to 2017–18, before falling to an age-standardised rate of 13,400 per 100,000 and a crude rate of 15,700 per 100,000 in 2021–22.
- Gabapentin dispensing rates decreased from 2012–13 to 2016–17 (age-standardised rate of 455 to 430 per 100,000 and a crude rate of 500 to 475 per 100,000), then increased to 2021–22 (age-standardised rate of 480 per 100,000 and a crude rate of 550 per 100,000) (Figure PHARMS1).
For information on concomitant dispensing of opioids and benzodiazepines, see Poly drug use. Dispensing of prescription opioids, benzodiazepines and gabapentinoids may have been affected by recent policy changes. Refer to the Policy context section for more information.
Patient characteristics
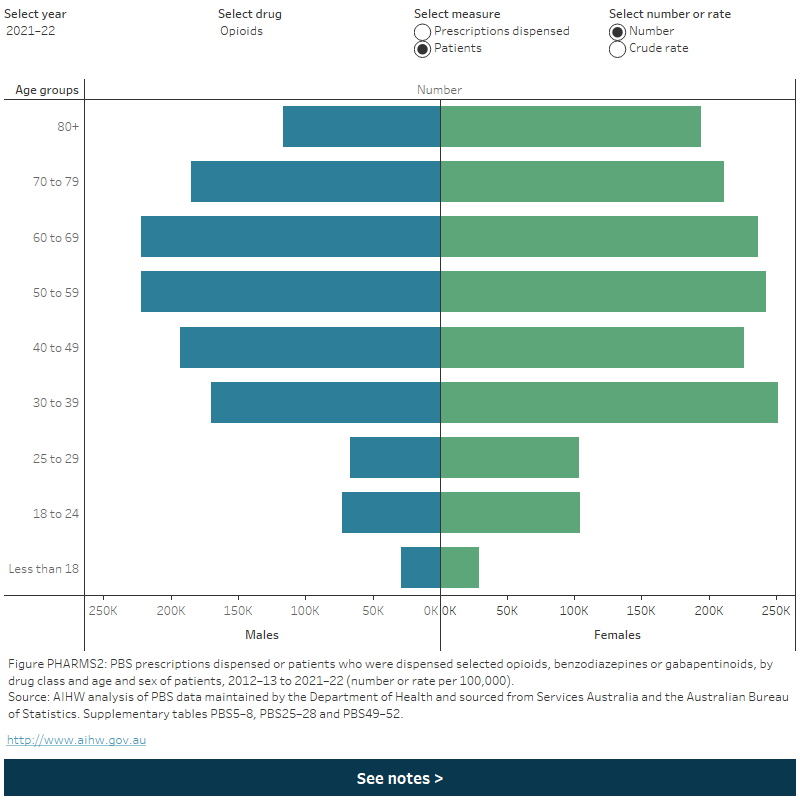
Opioid, benzodiazepine and gabapentinoid dispensing varied by the age and sex of patients. Across all drug categories:
- Rates of dispensing increased with increasing age and were highest for people aged 80 and over (Figure PHARMS2). See Older people: Pharmaceuticals for more information on PBS dispensing by patient age.
- Females had higher rates of dispensing than males. This was similar over time and across most age groups (Figure PHARMS2).
Figure PHARMS2: PBS prescriptions dispensed or patients who were dispensed selected opioids, benzodiazepines and gabapentinoids, by age and sex of patients, 2012–13 to 2021–22 (number or rate per 100,000)
This figure shows the number of prescriptions dispensed for opioids in 2020-21. by sex. The largest group was females aged 80 and over with 1,827,700 scripts dispensed, this is followed by females aged 70–79 1,372,356 with scripts dispensed. There is a filter to select year, drug, measure (prescriptions dispensed or patients) and number or crude rate.
Defined daily doses dispensed for opioid drugs
Box PHARMS3: What are defined daily doses?
Opioid use can be examined using defined daily doses (also known as statistical defined daily doses or S-DDDs). A defined daily dose is a measure used for statistical purposes that represents the dose of a particular drug that is assumed to be the ‘average amount per day’ when used by adults (WHOCC 2018). S-DDDs account for variations between medicines (for example, pack size and drug strength) and are useful for examining changes in dispensing over time or comparing data between regions or populations (WHOCC 2018).
S-DDDs may not match the recommended or prescribed dose and may underestimate or overestimate ‘true’ use. See the Technical notes for more information on how S-DDDs are calculated in this report.
PBS data indicate that 82.4 million defined daily doses were dispensed in 2021–22 for all opioids, a rate of 8.7 S-DDDs/1,000 population/day. Oxycodone (2.1 S-DDDs/1,000/day), codeine and tramadol (1.8 and 1.7 S-DDDs/1,000/day respectively) had the highest rates of dispensing (tables PBS17–18).
Between 2012–13 and 2021–22, the total rate of S-DDDs dispensed for opioids fell from around 13 S-DDDs/1,000 population/day in 2012–13 (Table PBS18). Trends in dispensing varied by opioid drugs:
- Rates of dispensing decreased for codeine, fentanyl, methadone, morphine and tramadol (methadone and buprenorphine rates do not include prescriptions for the treatment of opioid dependence as these data are not available in the PBS).
- The rate of S-DDDs dispensed initially increased for buprenorphine (peaking at 0.8 S-DDDs/1,000/day in 2017–18), hydromorphone (peaking at 0.4 in 2014–15) and oxycodone (peaking at 3.4 in 2013–14), before declining to 2021–22.
- There was a steady increase in the rate of S-DDDs dispensed for tapentadol, rising from <0.1 to 1.1/1,000 population/day between 2013–14 and 2021–22 (Table PBS18).
Decreased rates of opioid dispensing measured in terms of S-DDDs may be related to several recent policy changes, including the de-listing of some medicines, increased restrictions on prescribing some opioids, and the introduction of smaller pack sizes for some PBS-listed immediate-release opioid formulations in June 2020. Refer to the Policy context section for more information.
Opioid dispensing for cancer treatment and palliative care
Opioids are effective for managing strong cancer pain and in the context of palliative care. However, there is limited evidence that opioid medicines are beneficial for the long-term treatment of non-cancer pain conditions (for example, back pain). Long-term opioid use is also linked to increased risk of harm such as overdose (RACGP 2020). Australian clinical guidelines recommend that opioids only be used for chronic non-cancer pain if a patient is experiencing moderate/severe pain that is not adequately managed with other treatments (RACGP 2020).
PBS data indicate that most opioid dispensing in Australia is not related to cancer or palliative care. In 2021–22, around 2.7 million scripts were dispensed in relation to palliative care (10,500 scripts per 100,000 population) and 769,000 scripts were dispensed in relation to cancer treatment (3,000 scripts per 100,000). By comparison, 10.0 million scripts were dispensed not in relation to palliative care or cancer treatment (39,000 scripts per 100,000) (tables PBS19–20). Note that the number of opioid prescriptions related to palliative care and cancer may be underestimated, as some palliative care patients may not have received any PBS items from the Palliative Care Schedule, and some patients receiving treatment for cancer may not have received cancer treatment-related drugs through the PBS.
The rate of opioid dispensing for palliative care declined 2018–19 and 2020–21, while rates of dispensing for the other two categories (cancer treatment and neither palliative care nor cancer treatment) declined between 2017–18 and 2020–21. Between 2020–21 and 2021–22, the rate of opioid dispensing for palliative care increased from 8,400 to 10,500 prescriptions per 100,000 persons (Table PBS20).
Additions to PBS listings for palliative care were made on 1 June 2021 (NPS Medicine Wise 2023).
Consumption
Data from the 2022–2023 NDSHS showed that:
- 1 in 20 (5.3%) Australians aged 14 and over had used a pharmaceutical for non-medical purposes in the previous 12 months (AIHW 2024b, Table 6.3).
- About 1 in 9(11.9%) Australians aged 14 and over had used a pharmaceutical for non-medical purposes in their lifetime (AIHW 2024b, Table 6.1).
- Pharmaceutical pain-killers/pain-relievers and opioids (excluding over-the-counter medications such as paracetamol) are the most common pharmaceuticals used for non-medical purposes (2.2%), followed by pharmaceutical stimulants (2.1%) and tranquilisers/sleeping pills (1.6%) (AIHW 2024b, Table 6.2).
Box PHARMS4: Changes to pharmaceutical questions in the 2022–2023 NDSHS
In 2022–2023, the way the NDSHS captured illicit amphetamine use changed to better reflect how these substances are used and understood in the community. Two separate categories were created, specifically:
- Methamphetamine and amphetamine – this includes the illicit substances methamphetamine and amphetamine, colloquially known as ice, speed, goey, crystal and whizz), and is not included as part of the pharmaceuticals category.
- Non-medical use of pharmaceutical stimulants – these are medications that are usually prescribed to treat attention deficit hyperactivity disorder (ADHD) or narcolepsy and require a prescription from a medical professional to obtain legally. Examples include methylphenidate (Ritalin, Concerta) modafinil (Modavigil).
There were no changes to the pain-killers/pain-relievers and opioids, tranquillisers/sleeping pills, steroids, or methadone/buprenorphine sections of the questionnaire.
These changes to the 2022–2023 survey resulted in a break in the time-series for the overall non-medical use of pharmaceuticals.
Data from the 2022–2023 NDSHS showed that:
- 1 in 20 (5.3%) Australians aged 14 and over had used a pharmaceutical for non-medical purposes in the previous 12 months (AIHW 2024b, Table 6.3).
- About 1 in 9 11.9%) Australians aged 14 and over had used a pharmaceutical for non-medical purposes in their lifetime (AIHW 2024b, Table 6.1).
- Pharmaceutical pain-killers/pain-relievers and opioids (excluding over-the-counter medications such as paracetamol) are the most common pharmaceuticals used for non-medical purposes (2.2%), followed by pharmaceutical stimulants (2.1%) and tranquilisers/sleeping pills (1.6%) (AIHW 2024b, Table 6.2).
Between 2019 and 2022–2023, there was a decrease in the use of pain-relievers for non-medical purposes in the previous 12 months (from 2.7% to 2.2%) (AIHW 2024b, Table 6.2). This reduction in use was driven almost entirely by males:
- In 2019, 3.0% of males had used pain-relievers for non‑medical purposes in the previous 12 months, compared with 2.4% of females.
- In 2022–2023, males (2.1%) and females (2.2%) had similar rates of use.
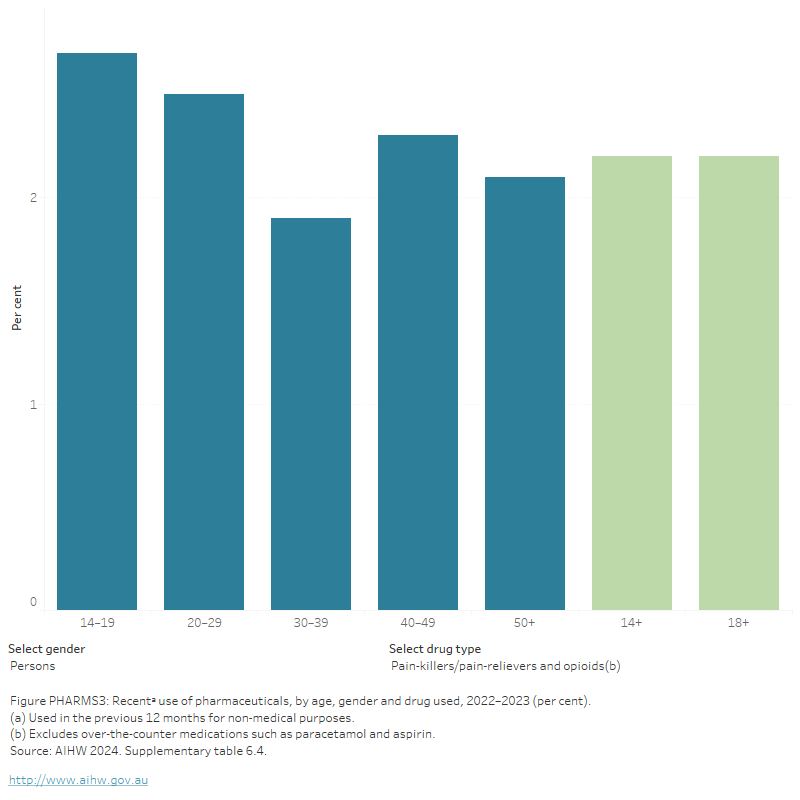
About 1 in 20 (5.5%) people reported lifetime use, and 2.1% of people used pharmaceutical stimulants for non-medical purposes in the last 12 months (AIHW 2024b, tables 6.1 and 6.2). Recent use of pharmaceutical stimulants was higher among people aged 20–29 than any other age group – 4.8% of those aged 20–29 reported recent use compared with 0.6% of people aged over 50 (AIHW 2024b, Table 6.4).
Figure PHARMS3: Recentᵃ use of pharmaceuticals, by age, gender and drug used, 2022–2023 (percent)
This figure shows the proportion of persons who reported recent use of pharmaceuticals for non-medical purposes by age group in 2019. In 2019, recent non-medical use of pharmaceuticals in the last 12 months was common for people aged 20–29 (6.4%) and 40–49 (4.9%). It was least common for people aged 14–19 (2.3%). There is a filter to select other drug types: Pain-killers/pain relievers and opioids and tranquillisers/sleeping pills.
Data from the 2022–2023 NDSHS showed that a higher proportion of Australians aged 14 and over approved the regular adult non-medical use of prescription pain-killers/pain-relievers (13.0%) and tranquilisers/sleeping pills (9.5%) than all illicit drugs except for cannabis (23%). However, support for the non-medical use of prescription pain-killers/pain-relievers was lower than approval for the use of tobacco (15.5%) and alcohol (46%) (AIHW 2024, Table 11.7).
Geographic trends
Findings from the 2022–2023 NDSHS (AIHW 2020) showed:
- The significant decrease between 2019 and 2022–2023 in the use of pain-killers/pain-relievers and opioids (excluding over-the-counter) for non-medical purposes that was observed at the national level also occurred in New South Wales (from 2.7% to 2.0%). There was also a decline in the non-medical use of pain-relievers and opioids among females in South Australia (from 3.1% to 1.4%) (AIHW 2024b, Table 9b.47).
- There was a significant increase in the non-medical use of pain-relievers and opioids between 2019 and 2022–2023 in the Northern Territory (from 1.9% to 4.0%), resulting in non-medical use being similar to 2016 levels (4.2%); note, the 2019 estimate has a relative standard error of 25% to 50% and should be interpreted with caution (AIHW 2024b, Table 9b.47).
- Non-medical use of pharmaceutical stimulants was lower in New South Wales (1.7%) than the rest of Australia (2.1%) but was significantly higher in Western Australia (3.8%).
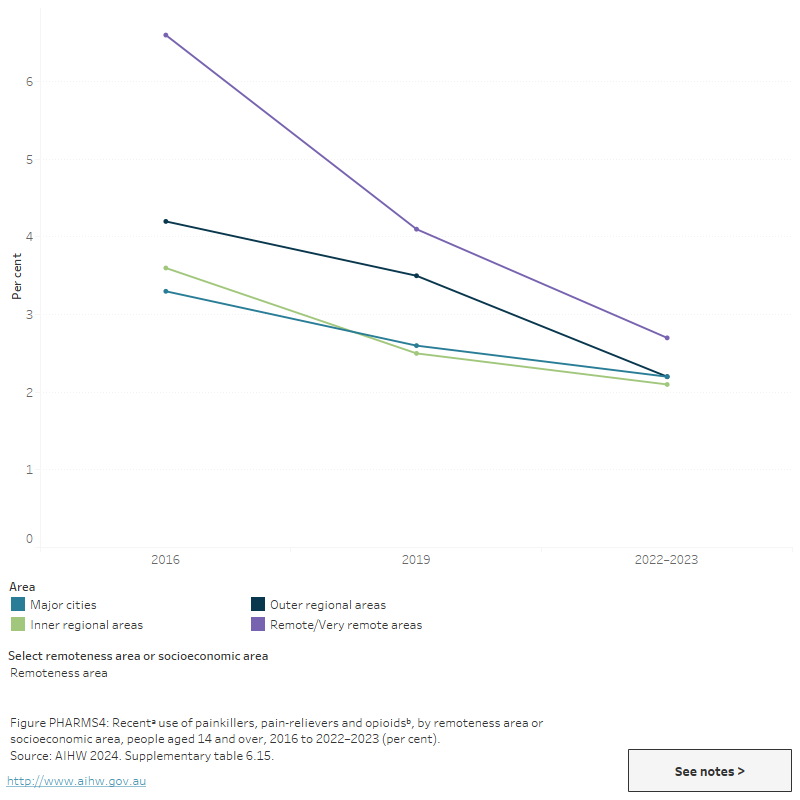
- Between 2019 and 2022–2023, there was a significant decrease in the use of pain-killers/pain-relievers and opioids for non-medical purposes in Outer regional areas (from 3.5% to 2.2%) (AIHW 2024b, Table 9a.12).
- People living in Remote and very remote areas were about 1.2 times as likely as those from Major cities to have recently used pain-killers/pain-relievers and opioids for non-medical purposes in 2022–2023 (2.7% compared with 2.2%). This is a reduction from 2019 when they were 1.5 times as likely to have done so (AIHW 2024b, Table 9a.12).
- People living in the most disadvantaged socioeconomic areas were 1.6 times as likely as those from the most advantaged socioeconomic areas to have used pain-relievers/opioids for non-medical purposes (2.8% compared with 1.7%). Conversely, people living in the most advantaged areas were 2.7 times as likely as those from the most disadvantaged socioeconomic areas to have recently used pharmaceutical stimulants for non-medical purposes (3.5% compared with 1.3%). (AIHW 2024b, Table 9a.14).
Figure PHARMS4: Recentᵃ use of painkillers, pain-relievers and opioidsᵇ, by remoteness area or socioeconomic area, people aged 14 and over, 2016 to 2022–2023 (per cent)
This figure shows the proportion of recent non-medical use of pharmaceuticals by people aged 14 and over and socioeconomic area in 2016 and 2019. In 2019, the proportion of people aged 14 and over living in the most disadvantaged socioeconomic areas who used pain-killers/pain relievers for non-medical purposes was higher than those from the most advantaged socioeconomic areas (3.0% compared 1.8%).
The National Wastewater Drug Monitoring Program (NWDMP) measures the presence of substances in sewerage treatment plants across Australia. This includes estimated population-weighted average consumption of oxycodone and fentanyl. It should be noted that wastewater analysis cannot differentiate between prescribed and illicit use. Estimated consumption of oxycodone and fentanyl have plateaued at historically low levels (ACIC 2024).
Data from Report 21 of the NWDMP indicate that nationally:
- Between April and August 2023, oxycodone consumption increased in capital cities and decreased in regional areas.
- In August 2023, oxycodone population-weighted average consumption was higher in regional areas compared to capital cities.
- Nationally, consumption of oxycodone has been decreasing and appears to have plateaued over the last 3 years (ACIC 2024).
Between April and August 2023, nationally the estimated population-weighted average consumption of fentanyl increased in both capital cities and regional areas. Data from Report 21 of the NWDMP indicate:
- In August 2023, consumption levels in regional areas continued to be higher than in capital cities.
- Thegap between regional and capital city fentanyl consumption narrowed between August 2020 and August 2022, but has now widened again (ACIC 2024).
For state and territory data, see the National Wastewater Drug Monitoring Program reports.
Poly drug use
Poly drug use is defined as the use of mixing or taking another illicit or licit drug whilst under the influence of another drug. In 2022–2023, the NDSHS showed that just under half (46%) of people who reported the non-medical use of pain-relievers and opioids in the last 12 months said they did not use any other illicit drug at the same time. The most common other drugs concurrently used were alcohol (40%), tobacco (24%) and cannabis (19.5%) (AIHW 2024b, Table 6.14).
Data on alcohol and other drug-related ambulance attendances are sourced from the National Ambulance Surveillance System (NASS). Monthly data from 2021 and 2022 are currently available for New South Wales, Victoria, Queensland, Tasmania, the Australian Capital Territory, and the Northern Territory. It should be noted that some data for Tasmania, the Australian Capital Territory and the Northern Territory have been suppressed due to low numbers. Please see the data quality statement for further information.
In 2022, multiple drugs (excluding alcohol) were involved in at least half of ambulance attendances related to benzodiazepines and opioid analgesics. For benzodiazepines, this ranged from 68% of attendances in New South Wales to 76% of attendances in the Australian Capital Territory; for opioid analgesics the range was from 71% in New South Wales to 83% in Tasmania (Table S1.11).
For related content on multiple drug involvement see Impacts: Ambulance attendances.
Concomitant dispensing of prescription drugs
Due to the compounding effects of respiratory depression, patients using opioids and benzodiazepines at the same time may be at higher risk of harm (Boon et al. 2020; RACGP 2022). Data from the Pharmaceutical Benefits Scheme (PBS) indicate that most opioid scripts are dispensed to patients who have not received a recent supply of a benzodiazepine, and vice versa. However, concomitant dispensing is not uncommon (that is, dispensing multiple medicines at the same time or almost the same time). In 2021–22:
- Around 2.4 million opioid scripts were dispensed to patients who had already received a PBS supply of a benzodiazepine in the past 30 days, and 358,000 patients who were dispensed an opioid had also received a benzodiazepine (a rate of 9,400 scripts and 1,400 patients per 100,000 population) (tables PBS37–40).
- Around 1.5 million benzodiazepine scripts were dispensed to patients who had received a PBS supply of an opioid in the past 30 days, and 358,000 patients who received a benzodiazepine had received an opioid (a rate of 6,000 scripts and 1,400 patients per 100,000) (tables PBS41–44).
Rates of concomitant dispensing of opioids and benzodiazepines declined overall between 2013–14 and 2021–22 but fluctuated over time (tables PBS37–44). For more information on dispensing of prescription drugs under the PBS, see Prescription drug dispensing.
Harms
For related content on non-medical use of pharmaceutical drugs impacts and harms, see also:
There are a range of short- and long-term health, social and economic harms associated with the non-medical use of pharmaceutical drugs (Table PHARMS1). People who use opioids for chronic pain are more likely than the general population to use pharmaceutical drugs for non-medical purposes (Currow, Phillips & Clark 2016; Vowels et al. 2015). Iatrogenic dependence occurs when patients become dependent on medications that they were medically prescribed for legitimate purposes. Iatrogenic dependence is an increasing concern among people living with chronic non-cancer pain.
| Drug type | Short-term effects | Longer-term effects |
|---|---|---|
Pharmaceutical opioids |
|
|
Benzodiazepines |
|
|
Source: Adapted from Currow, Phillips & Clark 2016; DCPC 2007; Nicholas, Lee & Roche 2011; NSW Ministry of Health 2017.
Ambulance attendances
Data on alcohol and other drug-related ambulance attendances are sourced from the National Ambulance Surveillance System (NASS). Monthly data are presented from 2021 for people aged 15 years and over for New South Wales, Victoria, Queensland, Tasmania, the Australian Capital Territory, and the Northern Territory.
Any pharmaceutical drug
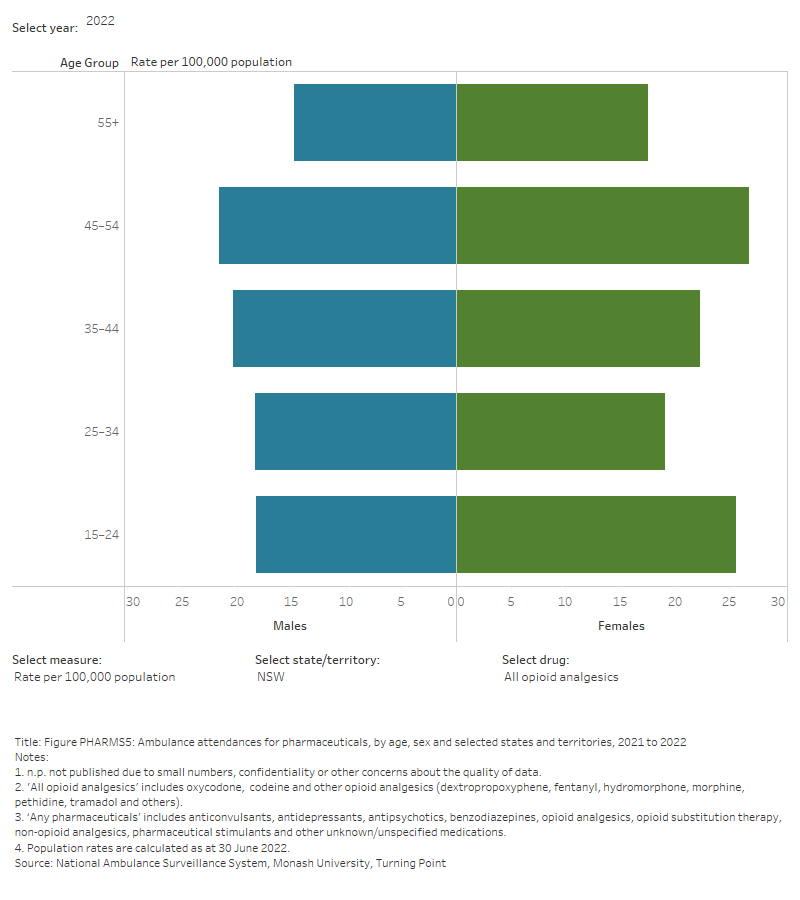
For the 6 jurisdictions in 2022, for ambulance attendances where any pharmaceutical drug was reported:
- Rates of attendances ranged from 137.1 per 100,000 population in the Northern Territory to 289.9 per 100,000 population in Tasmania.
For the 5 jurisdictions where alcohol and other drug-related ambulance attendance data are available for age and sex disaggregation (New South Wales, Victoria, Queensland, Tasmania and the Australian Capital Territory):
- Unlike most other drug types, most attendances were for females, 3 in 5 (59%) of total attendances.
- The highest rates of attendances were in people aged 15–24, ranging from:
- 273.9 per 100,000 per population (2,720 attendances) in New South Wales to 738.4 per 100,000 population in the Tasmania (463 attendances) (Table S1.11; PHARMS5)
For the 6 jurisdictions where monthly data from 2021 is available, between 2021 and 2022:
- Rates of any pharmaceutical-related ambulance attendances have decreased across all jurisdictions, with the exception of Tasmania.
- In Tasmania the rate of any pharmaceutical-related ambulance attendance increased from 2021 to 2022 (234.2 to 289.9 per 100,000 population).
Figure PHARMS5: Ambulance attendances for pharmaceuticals, by age, sex and selected states and territories, 2021 to 2022
This figure shows pharmaceutical-related ambulance attendances in NSW. The highest number of attendances were for females aged 15-24. There is a filter to select year, state/territory, drug and measure (number of attendances or rate per 100,000 population).
Benzodiazepines
For the 6 jurisdictions where benzodiazepine-related ambulance attendances data are available, in 2022:
- Rates of attendances ranged from 23.3 per 100,000 population in Northern Territory (46 attendances) to 75.4 per 100,000 population (3,257) in Queensland.
For the 5 jurisdictions where alcohol and other drug-related ambulance attendance data are available for age and sex disaggregation (New South Wales, Victoria, Queensland, Tasmania and the Australian Capital Territory):
- Over half (54%) of total attendances were for females.
- The highest rates of attendances were in people aged:
- 15–24 in Victoria (1,019 attendances, 126.3 per 100,000 population), and Queensland (700 attendances, 105.4 per 100,000 population).
- 35–44 in Tasmania (74 attendances, 107.2 per 100,000 population) (Table S1.10; Figure PHARMS5).
For the 6 jurisdictions where monthly data from 2021 is available, between 2021 and 2022:
- Rates of benzodiazepine-related ambulance attendances have decreased across all jurisdictions, with the exception of Tasmania and the Northern Territory.
- In Tasmania benzodiazepine-related ambulance attendance rates increased from 2021 to 2022 (56.2 to 72.9 per 100,000 population).
- In the Northern Territory benzodiazepine-related ambulance attendance rates increased from 2021 to 2022 (20.5 to 23.3 per 100,000 population).
Opioid analgesics
In 2022, for opioid analgesic-related ambulance attendances in New South Wales, Victoria, Queensland, Tasmania, the Australian Capital Territory, and the Northern Territory:
- The rate of attendances ranged from 19.6 per 100,000 population in New South Wales to 40.1 per 100,000 population in Queensland.
For the 5 jurisdictions where alcohol and other drug-related ambulance attendance data are available for age and sex disaggregation (New South Wales, Victoria, Queensland, Tasmania and the Australian Capital Territory):
- Over half (55%) of total attendances were for females.
- The rates of opioid-related ambulance attendances varied across jurisdictions and were higher in people aged 35–44 in:
- the Australian Capital Territory (38 attendances, 54.1 per 100,000 population).
- Opioid analgesic-related attendances were higher for people aged:
- 15–24 in Tasmania (32 attendances, 51.0 per 100,000 population) and Queensland (333 attendances, 49.9 per 100,000) (Table S1.10; Figure PHARMS5).
For the 6 jurisdictions where monthly data from 2021 is available, between 2021 and 2022:
- Rates of opioid analgesic-related ambulance attendances have decreased across all jurisdictions, with the exception of Tasmania and the Northern Territory.
- In Tasmania, opioid analgesic-related ambulance attendance rates have increased from 2021 to 2022 (34.1 to 39.1 per 100,000 population).
- In the Northern Territory opioid analgesic-related ambulance attendance rates have increased from 2021 to 2022 (14.8 to 20.2 per 100,000 population).
Hospitalisations
Drug-related hospitalisations are defined as hospitalisations with a principal diagnosis relating to a substance use disorder or direct harm relating to use of selected substances (AIHW 2018).
AIHW analysis of the National Hospital Morbidity Database (NHMD) showed that, among all drug-related hospitalisations in 2021–22:
- Around 1 in 20 were for antiepileptic, sedative-hypnotic and antiparkinsonism drugs (excluding alcohol) (6.1% or 8,200 hospitalisations). Within this category, over 2 in 5 hospitalisations were for benzodiazepines (46% or 3,800 hospitalisations).
- Around 1 in 20 were for non-opioid analgesics (5.4% or 7,300 hospitalisations) or opioids (4.3% or 5,800) (Table S1.12c).
This represents a rate of 14.7 hospitalisations per 100,000 population for benzodiazepines and 22.6 per 100,000 for opioids (Table S1.13).
In 2021–22:
- Almost 2 in 3 hospitalisations for benzodiazepines (67% or 2,500 hospitalisations) or opioids (64% or 3,700) involved an overnight stay.
- More females than males were hospitalised for benzodiazepines (60% or 2,300 hospitalisations).
- Over 1 in 4 hospitalisations for benzodiazepines (27% or 1,000 hospitalisations) were for people aged 55 and over.
- More males than females were hospitalised for opioids (58% or 3400 hospitalisations).
- 1 in 4 hospitalisations for opioids (25% or 1,400 hospitalisations) were people aged 55 and over (Table S1.12a–12c).
- Around 3 in 4 hospitalisations occurred in Major cities for both benzodiazepines (73% or 2,800 hospitalisations) and opioids (74% or 4,300 hospitalisations).
- The rate of hospitalisations for benzodiazepines was highest in Outer regional and Major city areas (16.5 and 15.0 hospitalisations per 100,000 population, respectively, compared with 10.3 per 100,000 in Remote and very remote areas).
- The rate of hospitalisations for opioids was highest in Major cities (23.3 per 100,000, compared with 15.6 per 100,000 in Remote and very remote areas) (Table S1.14).
In the 7 years to 2021–22:
- The number of benzodiazepine-related hospitalisations declined from 6,300 in 2015–16 to 3,800 in 2021–22 (or from 26.1 to 14.7 per 100,000 population)
- The rate of benzodiazepine-related hospitalisations was highest in Outer regional areas from 2015–16 (29.3 per 100,000) until 2018–19 (23.9 per 100,000). In 2019–20 and 2020–21 rates in Major cities (19.7 and 18.5 per 100,000 respectively) were higher than Outer regional (18.5 and 17.7 per 100,000 respectively), before returning to pre-pandemic trends in 2021–22 (Outer regional 16.5 per 100,000 and Major cities 15.0 per 100,000).
- The number of opioid-related hospitalisations fell from 9,200 in 2015–16 to 5,800 in 2021–22 (or from 38.3 to 22.7 per 100,000).
The rate of opioid-related hospitalisations decreased in Major cities from 2015–16 (39.1 per 100,000 to 2021–22 (23.3 per 100,000. (Table S1.14; Figure IMPACT5).
Deaths
Drug-induced deaths are determined by toxicology and pathology reports and are defined as those deaths that can be directly attributable to drug use. This includes deaths due to acute toxicity (for example, drug overdose) and chronic use (for example, drug-induced cardiac conditions) (ABS 2021).
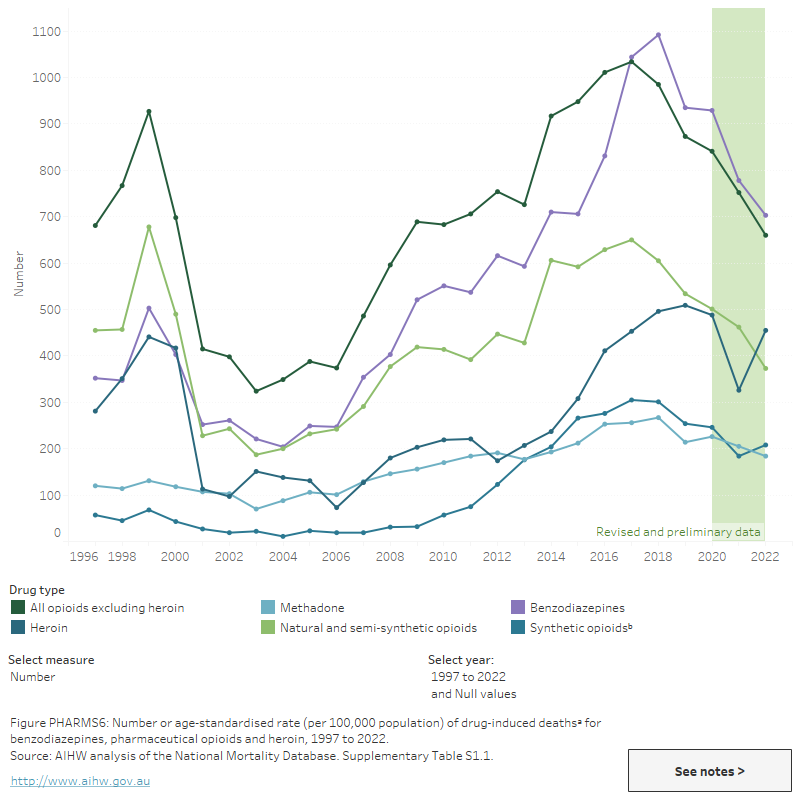
Drug-induced deaths are more likely to be due to pharmaceutical drugs than illegal drugs, with benzodiazepines being the most commonly involved single drug type in drug-induced deaths (703 deaths in 2022). The rate of deaths where benzodiazepines were present rose from 1.9 per 100,000 population in 1997 to 2.7 deaths per 100,000 population in 2022.
The number and rate of deaths with a prescription drug present has increased since 1997. For synthetic opioids (including fentanyl and tramadol) in particular, the rate has increased from 0.3 per 100,000 (57 deaths) to 0.8 per 100,000 (208 deaths) in 2022 (Figure PHARMS6; Table S1.1).
Figure PHARMS6: : Number or age-standardised rate (per 100,000 population) of drug-induced deathsa for benzodiazepines, pharmaceutical opioids and heroin, 1997 to 2022
This figure shows drug-induced deaths from 1997 to 2021. Since 2018, deaths have been decreasing for most drug types. In 2021, the most common substance present in drug-induced deaths was benzodiazepines (744 deaths), followed by all opioids excluding heroin (714) and natural and semi-synthetic opioids (437).
The National Drug and Alcohol Research Centre (NDARC) reported that over 2 in 3 (67% or 674 deaths) of all opioid-induced deaths in 2021 were attributed to pharmaceutical opioids only. This is compared to 25% (256 deaths) for heroin only and a further 6.9% (70 deaths) that were attributed to both pharmaceutical opioids and heroin (Chrzanowska et al. 2023).
This is consistent with previous findings from 2018 indicating that pharmaceutical and prescription opioids were present in over 70% of opioid-induced deaths. Pharmaceutical opioids were also the most common opioid present in intentional overdose deaths (suicide) (ABS 2019a).
Involvement of other drugs in pharmaceutical drug-induced deaths is common. For example, preliminary estimates from NDARC show that benzodiazepines were involved in 58% (592 deaths) of opioid-induced deaths in 2021 (Chrzanowska et al. 2023).
Geographic trends
The rate of drug-induced deaths involving pharmaceuticals varied between Major cities and Regional and remote areas. Specifically:
- Benzodiazepine induced deaths in 2022 were higher in Major cities (2.8 per 100,000 population) compared with Regional and remote areas (2.4 per 100,000 population).
- Drug-induced deaths involving paracetamol were slightly higher in Major cities (0.6 deaths per 100,000 population) than Regional and remote areas (0.4 per 100,000 population)
- Deaths involving natural and semi-synthetic opioids were slightly higher in Major cities (1.4 deaths per 100,000 population) than in Regional and remote areas (1.3 per 100,000 population) (Table 1).
Treatment
The latest Alcohol and other drug treatment services in Australia: early insights report shows that pharmaceuticals were the principal drug of concern in 5.6% of treatment episodes provided to people for their own drug use in 2022–23 (AIHW 2024a). This is similar to 2021–22 (5.0% of episodes).
Data collected for the AODTS NMDS are released twice each year: an early insights report in April and a detailed report mid-year. The section below will be updated with information from the annual report once these data become available.
The AODTS NMDS classification of ‘pharmaceuticals’ includes 10 drug types: codeine, morphine, buprenorphine, oxycodone, methadone, benzodiazepines, steroids, other opioids, other analgesics, and other sedatives and hypnotics. The most common drug types within this classification are benzodiazepines and opioids (AIHW 2021).
In 2021–22, where pharmaceuticals were the principal drug of concern:
- Around 3 in 4 (76%) episodes were for opioids or benzodiazepines.
- Over 3 in 5 (61%) clients were male and around 1 in 7 (15%) were Indigenous Australians (AIHW 2023, tables SC.30 and SC.32).
- Almost 3 in 10 (29%) clients were aged 30–39, 25% were aged 20–29 (AIHW 2023).
- The most common source of referral was self/family (40%) followed by health services (39%) (AIHW 2023, Table Pharmctcl.4).
- Assessment only was the most common main treatment type (30% of treatment episodes), followed by counselling (22%) (AIHW 2023, Table Pharmctcl.3).
Figure PHARMS7: Treatment provided for own non-medical use of pharmaceuticals, 2021–22

Pharmaceuticals were the principal drug of concern in 5% of treatment episodes
Around 1 in 7 clients were Indigenous Australians

Assessment only was the most common main treatment type (3 in 10 episodes)
Source: AIHW 2023, tables Drg.87, SC.32 and Drg.91.
At-risk groups
For related content on at-risk groups, see:
The available evidence indicates that the non-medical use of pharmaceuticals among vulnerable populations is at substantially higher levels than in the general population.
- The non-medical use of pharmaceuticals was higher for Aboriginal and Torres Strait Islander people (7.6% in 2022–2023) than for non-Indigenous Australians (5.2%).
- People with a mental health condition were 1.9 times as likely to report the non-medical use of pharmaceuticals than people who had not been diagnosed or treated for a mental health condition (8.7% compared to 4.6% in 2022–2023).
- People who inject drugs consume pharmaceutical drugs, particularly prescription opioids, at higher rates than the general population and may substitute illicit drugs for pharmaceutical drugs depending on availability.
Policy context
Real-time prescription monitoring
In July 2017, the Australian Government announced $16 million in funding to implement a national real-time monitoring system of prescription drugs. The system will provide an instant alert to pharmacists and doctors if patients are receiving multiple supplies of prescription only medicines (also referred to as ‘doctor or pharmacy shopping’). The program will initially include the monitoring of controlled medicines that are particularly susceptible to non-medical use including morphine, oxycodone, dexamphetamine and alprazolam. The system aims to assist doctors and pharmacists to identify patients who are at risk of harm due to dependency or non-medical use of pharmaceutical drugs and patients that are diverting these medicines.
Alprazolam rescheduling
As of 1 February 2014, the benzodiazepine classed medication, alprazolam was rescheduled from schedule 4 to schedule 8; a controlled medication. This decision was made by the Therapeutics Goods of Administration (TGA) on the basis that substantial evidence demonstrated alprazolam has increased morbidity and mortality in overdose with the possibility of increased toxicity with no additional therapeutic benefits in comparison to other drugs classed as benzodiazepines (TGA 2013).
From February 2017, higher-strength alprazolam products and larger alprazolam pack sizes were delisted from the PBS, and are not captured in the data reported here.
As of 1 February 2018, medicines containing codeine were reclassified to schedule 4 drugs, meaning they could no longer be sold over-the-counter in pharmacies and were available by prescription only. This decision was made by the Therapeutic Goods Administration (TGA) following substantial evidence of harm from the use of low dose codeine-containing medicines including analgesic preparations combined with other pain relief medicines such as aspirin, paracetamol and ibuprofen (TGA 2016).
Many over-the-counter combination medicines containing codeine were not listed on the PBS prior to February 2018 and are now only able to be obtained with a private prescription. As a result, these medicines are not represented in PBS claim data. However, the scheduling change may account for some of the reductions observed in the 2022–2023 NDSHS in the non-medical use of pain-killers and opioids since 2016 (AIHW 2024b).
Pharmaceutical opioid regulatory changes
Regulatory changes are being implemented in Australia to reduce harm from opioid prescription medicines. These include smaller pack sizes for immediate-release prescription opioid products; the inclusion of boxed warnings and class statements in the Product Information documents regarding their potential for harmful and hazardous use; and reinforcing the indications, or appropriate circumstances for the use of, immediate release and modified release products and for fentanyl patches. Smaller pack sizes and fentanyl indication changes came into effect in the first half of 2020. Other changes will be phased in subsequently (TGA 2021).
Resources and further information
- National Drug Strategy Household Survey 2022–2023, Australian Institute of Health and Welfare.
- Opioid harm in Australia: and comparisons between Australia and Canada, Australian Institute of Health and Welfare.
- Non-medical use of pharmaceuticals: trends, harms and treatment, Australian Institute of Health and Welfare.
- National Real Time Prescription Monitoring (RTPM).
- Up-scheduling of codeine.
- Prescription opioids: what changes are being made and why.
ABS (Australian Bureau of Statistics) 2016. National Aboriginal and Torres Strait Islander Social Survey, 2014–15. ABS cat. no. 4714.0. Canberra: ABS, accessed 14 December 2017.
ABS 2019a. Opioid-induced deaths in Australia. Canberra: ABS, accessed 26 October 2021.
ABS (2019b). National Aboriginal and Torres Strait Islander Health Survey, 2018-19. ABS cat. no. 4715.0. Canberra: ABS, accessed 8 January 2020.
ABS (2021). Causes of Death, Australia, 2021. ABS cat. no. 3303.0. Canberra: ABS, accessed 29 September 2021.
ACIC (Australian Criminal Intelligence Commission) (2023a). Illicit Drug Data Report 2020–2021. Canberra: ACIC, accessed24 October 2023.
ACIC (2024) National Wastewater Drug Monitoring Program Report 21. Canberra: ACIC, accessed 14 March 2024.
AIHW (Australian Institute of Health and Welfare) (2018). Drug related hospitalisations. Cat. no. HSE 220. Canberra: AIHW, accessed 18 August 2021.
AIHW (2021). Alcohol and other drug treatment services in Australia annual report. Cat. no. HSE 250. Canberra: AIHW, accessed 16 July 2021.
AIHW (2023). Alcohol and Other Drug Treatment Services annual report. Cat. No. HSE 250. Canberra: AIHW, accessed 21 June 2023.
AIHW (2024a) Alcohol and other drug treatment services in Australia: early insights. AIHW, Australian Government, accessed 16 April 2024.
AIHW (2024b) National Drug Strategy Household Survey 2022–2023. AIHW, accessed 29 February 2024.
Boon M, van Dorp E, Broens S and Overdyk F (2020) Combining opioids and benzodiazepines: effects on mortality and severe adverse respiratory events, Annals of Palliative Medicine 9(2):542–557.
CDC (Centres for Disease Control and Prevention) (2022). Understanding the Opioid Overdose Epidemic, accessed 30 May 2023.
Chrzanowska A, Man N, Akhurst J, Sutherland R, Degenhardt, L Peacock A (2023). Trends in overdose and other drug-induced deaths in Australia, 2002-2021. Sydney: National Drug and Alcohol Research Centre, UNSW Sydney, accessed 4 May 2023.
Currow DC, Phillips J & Clark K (2016). Using opioids in general practice for chronic non-cancer pain: an overview of current evidence. The Medical Journal of Australia. 204(8):305–209.
DCPC (Drugs and Crime Prevention Committee) (2007). Inquiry into the misuse/abuse of benzodiazepines and other forms of pharmaceutical drugs in Victoria: final report. Melbourne: Drugs and Crime Prevention Committee, accessed 5 October 2017.
Larance B, Degenhardt L, Lintzeris N, Winstock A & Mattick R (2011). Definitions related to the use of pharmaceutical opioids: extramedical use, diversion, non-adherence and aberrant medication-related behaviours. Drug and Alcohol Review 30(3):236–245.
Nicholas R, Lee N & Roche A (2011). Pharmaceutical drug misuse in Australia: complex problems, balanced responses. Adelaide: National Centre for Education and Training on Addiction.
NPS Medicine Wise (2023) Listings: Palliative care PBS changes, NPS Medicine Wise website, accessed 8 September 2023.
NSW Ministry of Health (2017). A quick guide to drugs and alcohol, 3rd edn. Sydney: National Drug and Alcohol Research Centre.
PBS (Pharmaceutical Benefits Scheme) (2022) About the PBS, PBS website, accessed 6 May 2022. RACGP (Royal Australian College of General Practitioners) (2020) A summary of opioid use in chronic non-cancer pain in general practice, RACGP website, accessed 6 May 2022.
RACGP (2022) Prescribing drugs of dependence in general practice, Part C1: Opioids, RACGP website, accessed 16 May 2022.
Roxburgh A, Hall W D, Dobbins T, Gisev N, Burns L, Pearson S and Degenhardt L (2017) Trends in heroin and pharmaceutical opioid overdose deaths in Australia, Drug and Alcohol Dependence 179:291–298.
TGA (Therapeutic Goods Administration) (2013) Reasons for scheduling delegates final decisions, June 2013 Part A: Scheduling proposals referred to the March 2013 meeting of the ACMS’, Canberra:TGA, accessed 9 November 2022.
TGA (2016) Codeine rescheduling regulation impact statement, TGA OBPR ID no. 19826, Canberra:TGA, accessed 9 November 2022.
TGA (2021). Prescription opioids: What changes are being made and why. Therapeutic Goods Administration website, accessed 29 November 2021.
UNODC (United Nations Office on Drugs and Crime) (2021). World Drug Report 2021. Vienna: UNODC, accessed 17 August 2021.
U.S. Department of Health & Human Services 2017. Opioids: the prescription drug and heroin overdose epidemic. Washington, D.C: DHHS, accessed 7 December 2017.
Vowels KE, McEntee ML, Julnes PS, Frohe T, Ney JP & van der Goes, DN (2015). Rates of opioid misuse, abuse and addiction in chronic pain: a systematic review and data synthesis. PAIN (156):569–576.
WHOCC (World Health Organisation Collaborating Centre for Drug Statistics Methodology) (2018) DDD: Definition and general considerations, WHOCC website, accessed 6 May 2022.