Health impacts
On this page:
The health burden of alcohol and other drug use is considerable and includes hospitalisation from injury and other disease, mental illness, pregnancy complications, injection-related harms, overdose and mortality.
Drug-induced deaths
For related content on drug-induced deaths, see also:
Drug-induced deaths are defined as those that can be directly attributable to drug use and includes both those due to acute toxicity (for example, drug overdose) and chronic use (for example, drug-induced cardiac conditions) as determined by toxicology and pathology reports (ABS 2021). The majority of drug-induced deaths are due to acute causes, whereas the majority of alcohol-induced deaths are due to chronic conditions. See also the Technical notes.
Multiple drug types may have been reported on a single death record as associated causes of death. As a result, the sum of each drug type may be more than the total number of deaths.
Box IMPACT1: National data sources on deaths related to drugs and alcohol
A number of nationally representative data sources are available to analyse recent trends in deaths related to drugs and alcohol. The ABS has released data on drug-induced causes of death and opioid-induced death, using data from the Registrar of Births, Deaths and Marriages in each state and territory, and the National Coronial Information System (NCIS) for those deaths certified by a coroner. The National Drug and Alcohol Research Centre (NDARC), Australian Institute of Health and Welfare (AIHW) and the Penington Institute use data provided by the ABS to report on drug deaths in Australia.
Causes of death are coded by the ABS to the International Standard Classification of Diseases and Related Health Problems (ICD). Where different numbers of deaths are reported, differences in data collection purpose, scope and terminology (outlined below) account for this variation.
The ABS, AIHW, NDARC and the Penington Institute use the terminology of drug-induced deaths to define those deaths that are directly attributable to drug use (that is, where drug overdose is the underlying cause of death). Drug-related deaths – where a drug has played a contributory role (for example, a traffic accident) – are excluded.
The ABS, AIHW and NDARC all report drug-induced deaths using the Drug-induced death tabulation (see ABS 3303.0 - Causes of Death, Australia). This tabulation outlines the ICD-10 codes for causes of death attributable to drug-induced mortality. This excludes deaths solely attributable to alcohol and tobacco.
The Penington Institute report drug-induced deaths that include the classification utilised by the above agencies, but also include some deaths attributable to alcohol use. This includes acute alcohol toxicity and harmful use, but may not capture deaths arising from all chronic health conditions that are wholly or partly attributable to alcohol use.
This report includes data on the harmful consumption of alcohol including alcohol-induced and alcohol-related deaths. This provides an update to previous reporting by the ABS (ABS 2018) and uses the same tabulation for alcohol-induced deaths (see ABS 3303.0 - Cause of Death, Australia).
Drug-induced deaths data are reported for the whole of the population across all data sources (Chrzanowska et al. 2023; Penington Institute 2023; see also the Technical notes for information about the AIHW analysis of the National Mortality Database).
Drug and alcohol-induced deaths data are updated by the ABS within 10 months of the year end (for example, 2022 data were released in September 2023). Additional analysis is undertaken by the AIHW, NDARC and Penington Institute and released in the following year. For this reason, the latest year of data reported here will vary.
The 2022 data on causes of death have been updated in this release sourced from the ABS (2023). Additional analysis undertaken by AIHW and NDARC will be updated in early 2024.
The ABS preliminary data on causes of death show that of the 1,693 drug-induced deaths in 2022:
- 64% were males (1,082 deaths) and 36% were females (611 deaths) (ABS 2023, Table 13.1).
- After adjusting for population growth and ageing the rate of drug-induced deaths was 6.5 per 100,000 population) (ABS 2023, Table 13.1).
- The median age at death was higher for females than males (50.0 and 45.4 years, respectively) (ABS 2023, Table 13.9).
Over two-thirds (69%) were considered accidental (1,175 deaths) (ABS 2023, Table 13.3) and 24% (402 deaths) were considered intentional (ABS 2023, Table 13.4).
Detailed analysis of the National Mortality Database by the AIHW showed that in 2021:
- There were 1,704 drug-induced deaths (age-standardised rate of 6.6 per 100,000 population):
- 1,647 (97%) were due to the acute effects of drugs (including overdose)
- 57 (3.3%) were due to the chronic effects of drugs (including drug-induced cardiac conditions) (Figure IMPACT1; Table S1.4).
- Benzodiazepines continued to be the largest contributor to drug-induced deaths. In 2021, there were 744 drug-induced deaths involving benzodiazepines (age-standardised rate of 2.9 per 100,000 population). Benzodiazepine related deaths have decreased since 2018. (Figure IMPACT2; Table S1.1).
Figure IMPACT1: Number or age-standardised rate (per 100,000 population) of alcohol-induced and drug-induced deathsa, by sex and age group, drug type or drug class, 1997 to 2021
This figure shows changes in acute and chronic alcohol-induced and drug-induced deaths over time for different drug classes. The main type of alcohol-induced deaths is chronic alcohol-induced deaths. The main type of drug-induced deaths is acute drug-induced deaths.
VIEW DATA TABLES >
Figure IMPACT2: Number or age-standardised rate (per 100,000 population) of drug-induced deathsa, by drug type or drug class, 1997 to 2021
This figure shows changes in drug-induced deaths over time for different drug classes. In 2021, the age-standardised rate of drug-induced deaths was 6.6 per 100,000 population, down from 9.1 per 100,000 in 1999.

National Drug and Alcohol Research Centre analysis found that characteristics of drug-induced deaths show distinct age and sex profiles and a clear socio-economic gradient. In 2021:
- The highest rate of drug-induced deaths was for people aged 45–54 (13.5 per 100,000 population). This has changed since the late 1990s and early 2000s, when the rate of deaths was highest for people aged 25–34.
- The highest proportion of drug-induced deaths (32% or 569 deaths) occurred in residents of the most disadvantaged areas (quintile 1 of the Socio-Economic Indexes for Areas (SEIFA)).
- The greatest proportion of deaths for those aged 25-84 occurred in the most disadvantaged areas, however, of those aged 15-24 deaths were more frequent in more advantaged areas (quintile 4).
- Unintentional (33% or 392 deaths) and intentional deaths (26% or 122 deaths) were more frequent among people from the most disadvantaged areas (quintile 1).
- Cocaine was the only drug where there were more deaths among people living in the most advantaged areas (quintile 5) (Chrzanowska et al. 2023, Table 5).
Common drug classes and types identified in drug-induced deaths
Over the past 2 decades, benzodiazepines have remained the most commonly identified single drug type in drug-induced deaths, and opioids the most common drug class (Figure IMPACT2; Table S1.1). AIHW analysis of the National Mortality Database showed that, in 2021:
- Opioids were the most commonly identified drug class, present in almost 3 in 5 (57% or 962) drug-induced deaths, an age-standardised rate of 3.8 per 100,000 population. Opioids include a number of drug types including natural and semi-synthetic opioids including heroin, opiate based analgesics (such as codeine, oxycodone and morphine) and synthetic opioid prescriptions (such as tramadol and fentanyl).
- Benzodiazepines were the most commonly identified single drug type, present in over 2 in 5 (44% or 744) deaths. It is important to note that benzodiazepines may not have been recorded as the underlying cause of death and are commonly reported as an associated cause in deaths due to other drug types.
- Other drug types commonly identified in drug-induced deaths included depressants excluding alcohol (53% or 901 deaths) and antidepressants (31% or 520 deaths).
Preliminary mortality data indicate that there has been a recent change in the main type of opioid identified in drug-induced deaths. Over the past decade, opioid-induced deaths were more likely to be due to prescription drugs than illegal drugs, and there has been a rise in the number of deaths with a prescription drug present. The proportion and rate of opioid-induced deaths relating to illegal opioids – heroin – is decreasing, after a peak of 505 deaths in 2019.
- AIHW analysis of the National Mortality Database indicate that in 2021, there was a lower rate of drug-induced deaths involving heroin (1.3 per 100,000 population) than natural and semi-synthetic opioids (1.7 per 100,000) (Figure IMPACT2; Table S1.1).
Since 1997, the most common other drug involved in opioid-induced deaths was benzodiazepines (45% or 778 deaths in 2021). The majority (76%, 763 deaths) of opioid-induced deaths were accidental (Chrzanowska et al. 2023).
Poly drug use
In 2022, 5 or more drugs were present in 20.0% of all drug-induced deaths, and a further 17.5% reported 3 drugs present. Females were more likely than males to have 5 or more drugs present at toxicology (26.1% and 16.4%, respectively) (ABS 2023, Table 13.10).
Geographic trends
AIHW analysis of the National Mortality Database showed that in 2021:
- The rate of drug-induced deaths was higher in Major cities (age-standardisation rate of 6.7 per 100,000 population) compared with Regional and remote areas (6.0 per 100,000 population) (Table 8). The lowest rate of drug-induced deaths was recorded in Remote and very remote areas (5.1 per 100,000 population, compared with 6.7 for Major cities and 6.1 for Regional areas) (AIHW unpublished).
- The rate of drug-induced deaths has fluctuated since 2009 in both Major cities and Regional and remote areas, reaching a peak of 8.2 per 100,000 people in 2017 in Major cities and 8.6 per 100,000 people in Regional and remote areas in 2016 (Table 8).
Analysis by the National Drug and Alcohol Research Centre (NDARC), shows that in 2021:
- The highest proportion of drug-induced deaths in Major cities was among those aged 45–54 and 35–44 (25%, 331 deaths, and 25%, 323 deaths)
- Similarly, the highest proportion in Regional and remote areas was among those aged 45–54 (27%, 122 deaths) (Chrzanowska et al. 2023).
Psychosocial risk factors
Psychosocial risk factors, recorded for coroner-referred deaths in the National Mortality Database, are ‘social processes and social structures which can have an interaction with individual thought or behaviour and health outcomes’ (ABS 2019). Risk factors may not be mutually exclusive and therefore deaths with multiple psychosocial risk factors recorded will be counted in more than one category.
In 2021, at least one psychosocial risk factor was recorded in over one-third (36%) of drug-induced deaths. For intentional drug-induced deaths, this proportion was about 7 in 10 (71%) (Table S1.2).
Personal history of self-harm continued to be the most commonly identified risk factor (12%), followed by relationship issues including: disruption of family by separation and divorce (3.9%); disappearance and death of a person in the primary support group (3.8%); and limitations of activities due to disability (3.7%) (Table S1.3). However, there were some notable differences when they were examined by intent, age, and sex:
- Release from prison was ranked the 7th most common psychosocial risk factor for all drug-induced deaths, however, for accidental deaths, this was the second most common risk factor identified (Table S2.6).
- Limitation of activities due to disability was the most common risk factor for people aged 65 years and older, (Table S2.7).
- Disruption of family by separation and divorce was the second most common risk factor for males, while for females it was disappearance and death of a family member (Table S2.8).
While personal history of self-harm was the most commonly identified psychosocial risk factors across drug types, other risk factors identified in drug-induced deaths included:
- For cocaine, disruption of family by separation and divorce was the second most commonly identified risk factor.
- For synthetic and natural and semi-synthetic opioids, limitations of activities due to disability was the second most common risk factor.
- For heroin, release from prison was the second most common risk factor.
- For benzodiazepines disruption of family by separation and divorce was the second most common risk factor (Figure IMPACT3).
Figure IMPACT3: Leading psychosocial risk factors identified in drug-induced deaths, by drug class or drug type, 2021
This figure shows that Personal history of self harm was the leading psychosocial risk factor identified in drug-induced deaths for all drug classes.

Associated causes of death
Associated causes of death refer to conditions other than the underlying cause of death and can include diseases that are part of the chain of events leading to death, risk factors and co-morbid conditions (ABS 2020). People with multiple associated causes of death recorded will be counted in more than one category.
AIHW analysis of the National Mortality Database showed that of drug-induced deaths in 2021 (Table S1.3):
2 in 5 (42%) had mental and behavioural disorders due to psychoactive substance use as an associated cause of death.
Of the 1,075 mentions of these disorders as an associated cause of death, most were mental and behavioural disorders due to the use of opioids or depressants (Table S2.9).
1 in 3 (29%) had mood (affective) disorders as an associated cause of death.
Of the 532 mentions of mood (affective) disorders as an associated cause of death, the majority were for depressive episode (80%) and the remaining 20% were for bipolar affective disorder (Table S2.9).
Deaths due to harmful alcohol consumption
For related content on deaths due to harmful alcohol consumption, see also:
Alcohol-induced deaths are defined as those that can be directly attributable to alcohol use (that is, where an alcohol-related condition is recorded as the underlying cause of death), as determined by toxicology and pathology reports. This may be the result of a chronic condition directly related to alcohol use (for example, alcoholic liver cirrhosis) or from an acute condition directly related to harmful consumption (for example, alcohol poisoning). The majority of alcohol-induced deaths are due to chronic conditions, whereas the majority of drug-induced deaths are due to acute causes.
Alcohol-related deaths include deaths directly attributable to alcohol use (as defined above) and deaths where alcohol was listed as an associated cause of death (for example, a motor vehicle accident where a person recorded a high blood alcohol concentration) (ABS 2018). See also the Technical notes.
The 2022 data on causes of death have been updated in this release sourced from the ABS (2023). Additional analysis undertaken by AIHW and NDARC will be updated in early 2024.
The ABS preliminary data on causes of death show that in 2022:
- The number of alcohol-induced deaths reached a 10-year peak of 1,742 (1,245 males and 497 females) (ABS 2023, Table 13.11).
- After adjusting for population growth and ageing the rate of alcohol-induced deaths was 6.0 per 100,000 population) (ABS 2023, Table 13.11).
- 1,588 (91.2%) were due to the chronic effects of alcohol (including alcoholic liver cirrhosis) and 154 were due to the acute effects of alcohol (including alcohol poisoning) (ABS 2023, Table S13.16).
- Males recorded the majority of both chronic and acute alcohol-induced deaths (1,136 and 109 deaths, respectively) (ABS 2023, Table S13.16).
AIHW analysis of the AIHW National Mortality Database (Table S1.4) showed that of the 1,559 alcohol-induced deaths in 2021:
- Chronic alcohol-induced deaths were highest in the oldest age groups; numbers and age-specific rates were highest for those aged 55–64 years (428 deaths; 14.2 deaths per 100,000 population) and 65 and over (466 deaths; 10.8 deaths per 100,000 population) (Figure IMPACT1; Table S1.4b).
Alcohol-related deaths include deaths directly attributable to alcohol use (as defined above) and deaths where alcohol was listed as an associated cause of death (for example, a motor vehicle accident where a person recorded a high blood alcohol concentration) (ABS 2018). See also the Technical notes.
People were 3.1 times as likely to have alcohol certified at death as a related (or associated) cause (4,616 alcohol-related deaths) than to have died from an alcohol-induced death (1,559) (Table S1.4).
Burden of disease
The Australian Burden of Disease Study 2018 shows that tobacco use and alcohol use collectively accounted for 12.8% of the total burden of disease in Australia in 2018. Declines were observed for most leading risk factors with the exception of illicit drug use for which the age-standardised DALY rate increased by 35% between 2003 and 2018 (AIHW 2021c).
Burden of disease analysis is used to compare the impact of different diseases, conditions or injuries on a population (AIHW 2021ca). It combines the burden of living with ill health (non-fatal burden) with the burden of dying prematurely (fatal burden). This is measured through the calculation of disability-adjusted life years (DALY) – one DALY is one year of 'healthy life' lost due to illness and/or death.
Tobacco, alcohol and illicit drug use contribute to increased chronic disease, injury, poisoning and premature death and are among the leading risk factors contributing to disease burden in Australia (AIHW 2021c) (Figure IMPACT4). Analysis of data from the Australian Burden of Disease Study 2018 for tobacco, alcohol and illicit drug use based on the latest evidence of linked diseases indicated the following:
- Tobacco, alcohol and illicit drug use collectively accounted for 15.4% of the total burden of disease in Australia in 2018.
- Tobacco use contributed to 8.6% of the total burden of disease in Australia in 2018. It was responsible for 39% of the burden of respiratory diseases, 22% of cancers, 10.7% of cardiovascular diseases, and 6.2% of infections (AIHW 2021b, Table 6.3).
- Alcohol use contributed to 4.5% of the total burden of disease in Australia in 2018 and was the leading risk factor for males aged 15–44 (12.3% compared to females 3.9%). Males experienced a greater proportion of disease burden attributable to alcohol use than females.
- Alcohol use was responsible for 100% of the burden due to alcohol use disorders, 40% of liver cancer burden, 25% of road traffic injuries – motor vehicle occupant burden, 19% of chronic liver disease burden and 14% of suicide burden (Table S2.4).
- Illicit drug use contributed to 3.0% of the total burden of disease in Australia in 2018, most of which was experienced by people aged 15–44. Males aged 15–44 experienced a greater proportion of total disease burden attributable to illicit drug use than females in this age group (10.6% compared to 4.4%).
- Illicit drug use was responsible for 100% of the burden of drug use disorders (excluding alcohol) and 72% of the poisoning burden. It was also responsible for 74% of the acute Hepatitis C burden, 33% of the acute Hepatitis B burden, and 7.2% of the HIV/AIDS burden.
- Opioid use accounted for the largest proportion (31%) of the illicit drug use burden, followed by amphetamine use (24%), cocaine (10.9%) and cannabis (10.2%). In addition, 17.8% of the burden was from diseases contracted through unsafe injecting practices (Table S2.5) (AIHW 2021b).
The Australian Burden of Disease Study: Impact and causes of illness and death in Aboriginal and Torres Strait Islander people 2018 describes the impact of 219 diseases and injuries among Aboriginal and Torres Strait Islander people in terms of fatal and non-fatal burden. Some key findings from the Study show:
Tobacco use: Tobacco use was the highest risk factor, accounting for 12% of total disease burden, an increase from 10% in 2003.
- Over 800 deaths were attributed to tobacco use in 2018, 23% of all deaths among the Indigenous population.
- Tobacco use contributed to the highest portion of the total health gap between Indigenous and non-Indigenous Australians, accounting for 20% of the gap. Total health gap is measured by the difference in DALY (disability-adjusted life years) rates between Indigenous and non-Indigenous Australians (Table S3.7) (AIHW 2022).
Alcohol use: Alcohol use was the second highest risk factor, accounting for 10% of total disease burden.
- 350 deaths were attributed to alcohol use in 2018, 9.7% of all deaths among the Indigenous population.
- Alcohol use contributed to 12% of the health gap between Indigenous and non-Indigenous Australians. Alcohol use accounted for a larger proportion of the health gap for males compared to females (18% and 7.7%, respectively) (Table S3.7).
Illicit drug use: Illicit drug use was the 4th highest risk factor, accounting for 6.9% of total disease burden.
- 224 deaths were attributed to illicit drug use in 2018, 6.2% of all deaths among the Indigenous population.
- Illicit drug use saw the highest increase in total attributable burden age-standardised rate (ASR) between 2003 and 2018 at 77% (13 attributable DALY ASR in 2003, 23 attributable DALY ASR in 2018) (AIHW 2022).
Figure IMPACT4: Burden of disease due to alcohol or illicit drug use, by selected linked disease and sex, 2018
This figure shows that in 2015, for males, alcohol dependence contributed the largest burden (34.2%), followed by injuries (27.8%). For females, the largest burden was for alcohol dependence (26.8%), followed by cancers (25.8%).

View data tables >
Injury and hospitalisation
Recent consumers of alcohol (past 12 months)
- According to the 2019 National Drug Strategy Household Survey (NDSHS):
- 1.2% of consumers aged 14 years or older had been injured while under the influence of alcohol and required medical attention and 0.4% required admission to hospital for their injuries.
- Less than 1% of consumers aged 14 years or older required medical attention (0.3%) or hospitalisation (0.2%) because they were so intoxicated (AIHW 2020, Table 3.43).
- People who consumed alcohol in risky quantities (lifetime or single occasion risk) were far more likely to require medical attention or admission to hospital due to injuries sustained while drinking or due to intoxication. This was even higher among people aged 14 years or older who consumed 11 or more standard drinks at least monthly with 4.9% requiring medical attention for their injuries (AIHW 2020, Table 3.44).
People who have recently used illicit drugs (past 12 months)
2019 NDSHS data on injury and hospitalisation for people who have recently used illicit drugs have a high relative standard error and should be interpreted with caution (AIHW 2020).
- Data from the 2019 NDSHS shows that 1.2% of people aged 14 and over who have recently used illicit drugs reported that they had injured themselves while under the influence of illicit drugs and required medical attention and 0.5% said their injury was serious enough to require hospitalisation (AIHW 2020, Table 4.32).
- Less than 1% of people who have recently used illicit drugs reported that they had overdosed and required medical attention (0.9%) or hospitalisation (0.4%) (AIHW 2020, Table 4.32). This was higher among people who had used meth/amphetamines in the previous 12 months (2.0% had overdosed and required medical attention and 0.8% required hospitalisation) (AIHW 2020, Table 4.31).
Hospitalisations
For related content on drug-related hospitalisations, see also:
What is a drug-related hospitalisation?
A hospitalisation is an episode of admitted patient care ending with discharge, transfer or death, or a portion of a hospital stay beginning or ending in a change of type of care (AIHW 2022). Drug-related hospitalisations are hospitalisations where the principal diagnosis relates to a substance use disorder or direct harm due to selected substances (AIHW 2018). The principal diagnosis is considered to be responsible for an episode of admitted patient care to hospital. For more information, see Technical notes.
There were 11.6 million hospitalisations in Australia’s public and private hospitals in 2021–22, rising from 11.8 million in the previous year. Hospitalisations with a drug-related principal diagnosis accounted for 1.3% of all hospitalisations in 2021–22 (135,000 hospitalisations) (Table S1.13).
AIHW analysis of the National Hospital Morbidity Database (NHMD) showed that, for drug-related hospitalisations, overnight hospitalisations continued to be more common than same-day hospitalisations in 2021–22 (57% of all drug-related hospitalisations) (Table S1.12a–12c).
In the 7 years to 2021–22:
- The total number of drug-related hospitalisations fluctuated from 136,000 hospitalisations in 2015–16 to a high of 152,000 in 2020–21, before returning to 135,000 in 2021–22.
- The difference between total number of drug-related hospitalisations for males and female has remained stable, with males being around 19% higher (from 88,700 and 73,100 hospitalisations respectively in 2015–16 to 73,300 and 61,700 in 2021–22)
- In 2015–16, people aged 35–44 (30,700 hospitalisations; 951.1 hospitalisations per 100,000 people) and 45–54 (27,700; 883.8 per 100,000 population) had the highest number and rate of drug-related hospitalisations.
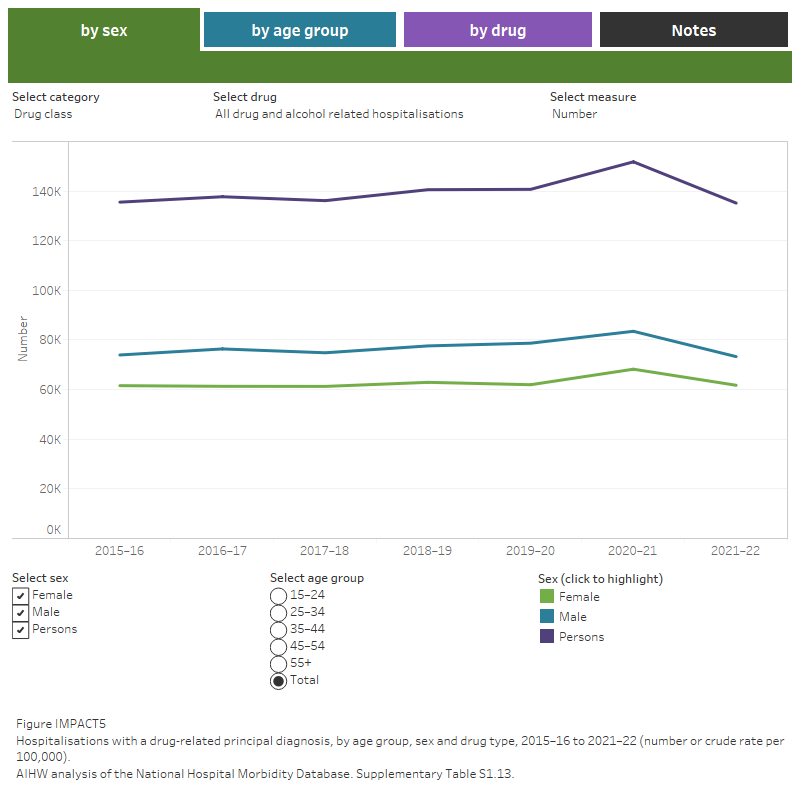
- In 2021–22 people aged 55 and over had the highest number of hospitalisations (31,400 hospitalisations; 425.1 per 100,000 population), while people aged 45–54 had the highest rate of hospitalisation (29,200; 894.7 per 100,000 population) (Table S1.13; Figure IMPACT5).
Population estimates used to calculate rates for 2020–21 may have been impacted by public health measures introduced during the COVID-19 pandemic. See the Technical notes for more information.
Figure IMPACT5: Hospitalisations with a drug-related principal diagnosis, by drug type, 2015–16 to 2021–22 (number or crude rate per 100,000 population)
This figure shows that there were 591.0 drug-related hospitalisations per 100,000 population in 2020–21, the highest recorded since 2015–16. Alcohol has remained the most common drug involved in drug-related hospitalisations from 2015–16 to 2020–21. A filter lets the user select number or crude rate per 100,000 as the unit of measurement.
Common drug types and classes identified in drug-related hospitalisations
In 2021–22, among drug-related hospitalisations:
- Alcohol accounted for nearly 2 in 3 hospitalisations (60% or 80,300 hospitalisations). Alcohol remained the most common drug type involved in drug-related hospitalisations in the 7 years to 2021–22 (Table S1.15; Figure IMPACT4).
- Amphetamines and other stimulants accounted for 9.0% of hospitalisations (12,200 hospitalisations). Most of these related to methamphetamine (82% or 10,000).
- Antiepileptic, sedative-hypnotic and anti-parkinsonism drugs (excluding alcohol) accounted for 6.1% of hospitalisations (8,200 hospitalisations). Over 2 in 5 of these hospitalisations were related to benzodiazepines (46% or 3,800 hospitalisations).
- Other drug classes included non-opioid analgesics (5.4% or 7,300 hospitalisations), cannabinoids (5.1% or 6,900) and opioids (4.3% or 5,800) (tables S1.15; Figure IMPACT5).
The most recent analysis of the NHMD by the National Drug and Alcohol Research Centre (NDARC) identified 62,486 drug-related hospitalisations in 2020–21 (Chrzanowska et al. 2022a). This is lower than the number estimated by the AIHW for that period (151,800 hospitalisations; Table S1.13). The difference is primarily due to the exclusion of alcohol-related hospital hospitalisations from the NDARC analysis (see Box IMPACT2). According to the NDARC analysis:
- The most common drug classes recorded in drug-related hospitalisations were similar to those reported in the AIHW analysis for 2020–21 (excluding alcohol).
- The age-standardised rate of drug-related hospitalisations was higher in 2020–21 than in 1999–2000 but has remained stable since 2017–18 (Chrzanowska et al. 2022).
Box IMPACT2: National data on drug-related hospitalisations
The Australian Institute of Health and Welfare (AIHW) and the National Drug and Alcohol Research Centre (NDARC) routinely publish findings from the National Hospital Morbidity Database (NHMD), including drug-related hospitalisations. Methodological differences in the analyses mean that NDARC reports a lower number of drug-related hospitalisations than the AIHW.
Key differences in the analyses are:
- NDARC does not include hospitalisations where the principal diagnosis is related to tobacco or alcohol use, other unspecified drug use and fetal and perinatal conditions. The AIHW includes these principal diagnoses in totals (although fetal and perinatal numbers are not reported separately).
- NDARC include hospitalisations by the state or territory of a patient’s usual residence and do not include cross-border hospitalisations. The AIHW does not provide state or territory disaggregation and includes cross-border hospitalisations.
- NDARC calculate age-standardised rates in some areas, along with a crude rate as of 30 June of the reference year. The AIHW calculates crude rates only, as of 31 December of the reference year. In 2021–22, rates by remoteness area were calculated at 30 June 2021 as population data by remoteness for the 2022 financial year were not available.
- Both NDARC and AIHW exclude separations for which the care type was reported as Newborn without qualified days, and records for Posthumous organ procurement and Hospital boarders.
For more information about the AIHW analysis of the National Hospital Morbidity Database, see Data quality and Technical notes.
Overdose and misuse
Overdose and misuse of alcohol and other drugs (AOD) are public health concerns that affect the community on many levels. Surveillance and monitoring of AOD overdose and misuse can help to form an evidence base in relation to trends and emerging patterns of harms (Moayeri et al. 2020).
Data from the Illicit Drug Reporting System (IDRS) and the Ecstasy and Related Drugs Reporting System (EDRS) show rates of self-reported overdose among people who regularly use stimulant drugs (EDRS) and who regularly inject drugs (IDRS). In 2023:
- Almost 1 in 10 (9%) IDRS participants reported experiencing a non-fatal heroin overdose in the last 12 months (Sutherland et al. 2023b).
- Almost 1 in 7 (15%) of EDRS participants reported experiencing a non-fatal stimulant overdose in the last 12 months (Sutherland et al. 2023a).
Data collection for 2023 took place from April–July for the EDRS and June–July for the IDRS.
Changes due to the impacts of COVID-19 resulted in EDRS and IDRS interviews in 2020-2023 being delivered face-to-face as well as via telephone and videoconference. All interviews prior to 2020 were delivered face-to-face, this change in methodology should be considered when comparing data from the 2020–2023 samples relative to previous years.
Ambulance attendances
For related content on ambulance attendances, see also:
Data on alcohol and other drug-related ambulance attendances are sourced from the National Ambulance Surveillance System (NASS). Monthly data for 2021 and 2022 are currently available for New South Wales, Victoria, Queensland, Tasmania and the Australian Capital Territory. Monthly data for Northern Territory was provided from 2022. It should be noted that some data for Tasmania, the Australian Capital Territory and the Northern Territory have been suppressed due to low numbers. Please see the data quality statement for further information.
For the 6 jurisdictions where alcohol and other drug-related ambulance attendance data are available:
- Across all jurisdictions, the highest number (and rate) of ambulance attendances were those for alcohol intoxication, with lower attendances for all other drugs reported here (IMPACT6, Table S1.9).
For the 5 jurisdictions where alcohol and other drug-related ambulance attendance data are available for age and sex disaggregation (New South Wales, Victoria, Queensland, Tasmania and the Australian Capital Territory):
Ambulance attendances for any pharmaceutical drug were predominantly for females, while most attendances for illicit drugs were for males (Table S1.10).
Ambulance attendances for antidepressants were predominantly for females aged 15–24 and 25–34 (Table S1.10).
Around 90% of benzodiazepine-related ambulance attendances resulted in transfer to hospital, while heroin had the lowest rates of transfer to hospital (IMPACT7, Table S1.11).
- The involvement of multiple drugs (excluding alcohol) was reported in less than half of attendances for cannabis and heroin. However, in over half of any pharmaceutical, cocaine and ecstasy attendances, multiple drugs were reported (IMPACT9, Table S1.11).
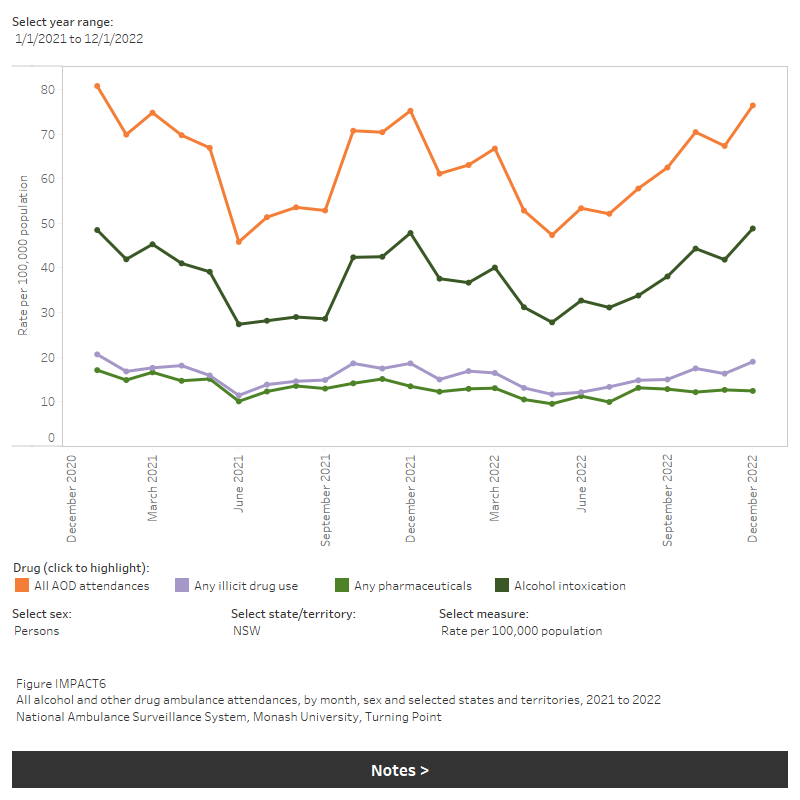
Figure IMPACT6: All alcohol and other drug ambulance attendances, by month, sex and selected states and territories, 2021 to 2022
This figure shows that in January 2021, the number of alcohol and other drug ambulance attendances for NSW peaked at 5,334. The largest contributor to this was alcohol intoxication related-attendances at 3,203. There is a filter to select state/territory, sex and measure (number or rate per 100,000 population).
Ambulance attendance data for attendances requiring transport to hospital, police attendance and multiple drug involvement are currently available for New South Wales, Victoria, Queensland, Tasmania and the Australian Capital Territory. For the 5 jurisdictions, 2021 and 2022 data are summarised below.
Transport to hospital
In 2022 ambulance attendances requiring transport to hospital varied across jurisdictions, drug types, sex, and age groups. Specifically, attendances requiring transport to hospital for:
- Any type of pharmaceutical drug required a higher rate of transport to hospital than other drugs, ranging from 84% of attendances in the Australian Capital Territory to 92% of attendances in Queensland.
- Alcohol-related attendances ranged from 70% of attendances requiring transport to hospital in the Australian Capital Territory to 82% of attendances in Queensland.
Heroin attendances requiring transport to hospital ranged from 48% of attendances in the Australian Capital Territory to 79% of attendances in Queensland (IMPACT7). In the period from 2021 to 2022, ambulance attendances requiring transport to hospital varied across jurisdictions, drug types, sex and age groups. The proportion of ambulance attendances requiring transport to hospital was proportionally higher in New South Wales, Victoria and Queensland but has decreased all jurisdictions.
Figure IMPACT7: Ambulance attendances involving transport to hospital, by age, sex and selected states and territories, 2021 to 2022
This figure shows the the number and percentage of all alcohol and other drug ambulance attendances that were transported to hospital. The highest number of attendances were for males age 55+. There is a filter to select year, state/territory, drug and measure (number or per cent).
Police co-attendance
Police co-attendance also varied, particularly across drug types. In 2022:
- The highest proportion of ambulance attendances where police co-attended involved amphetamines (any), ranging from:
- 3 in 10 (31%) in the Australian Capital Territory, to almost 1 in 2 (48%) of attendances in Victoria.
- Police co-attendance was generally less likely where a pharmaceutical drug was involved, ranging from 20% of attendances in Queensland to 33% of attendances in Victoria (IMPACT8).
In the period from 2021 to 2022, ambulance attendances requiring police co-attendance have remained stable across jurisdictions for both alcohol and drug attendances.
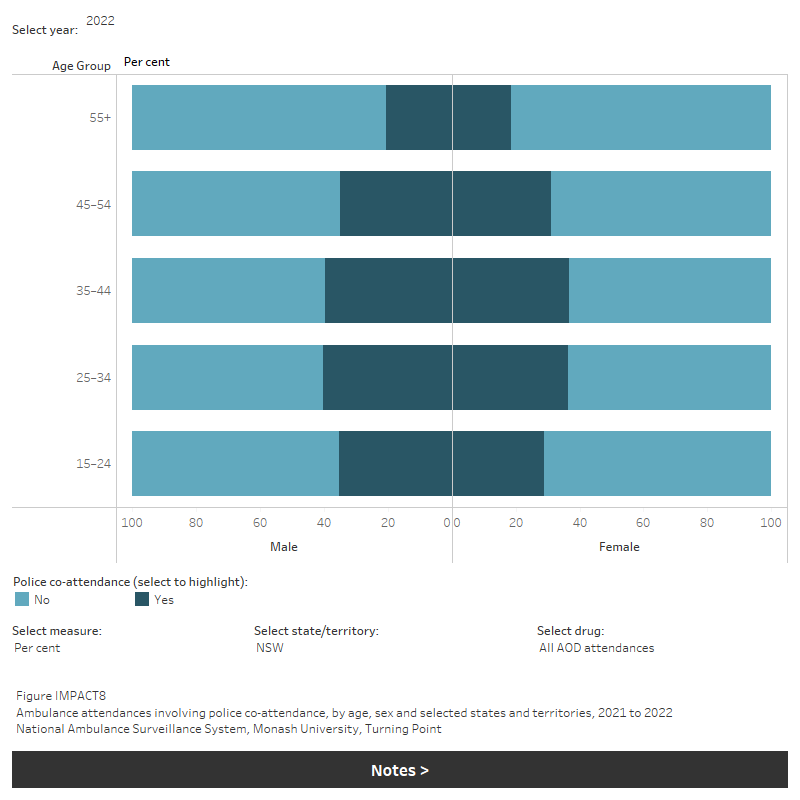
Figure IMPACT8: Ambulance attendances involving police co-attendance, by age, sex and selected states and territories, 2021 to 2022
This figure shows number and percent of police co-attendance for ambulance attendances in NSW. The highest number is for males aged 55+. There is a filter to select year, state/territory, drug and measure (number or percent).
Multiple drug involvement
Ambulance attendances where multiple drugs were involved varied between drug types and across jurisdictions. In 2022:
- Around 1 in 5 alcohol-related attendances involved at least one other drug.
- The highest proportion of ambulance attendances where there was multiple drugs involvement involved ecstasy, ranging from 3 in 4 (75%) attendances in New South Wales to 4 in 5 (83%) attendances in Tasmania.
- Over half of any pharmaceutical-related attendances involved at least one other drug (excluding alcohol), ranging from 51% in New South Wales to 58% in Victoria (Table S1.10; IMPACT9).
In the period from 2021 to 2022, ambulance attendances where multiple drugs were involved varied across jurisdictions, drug types, sex, and age groups but has remained stable.
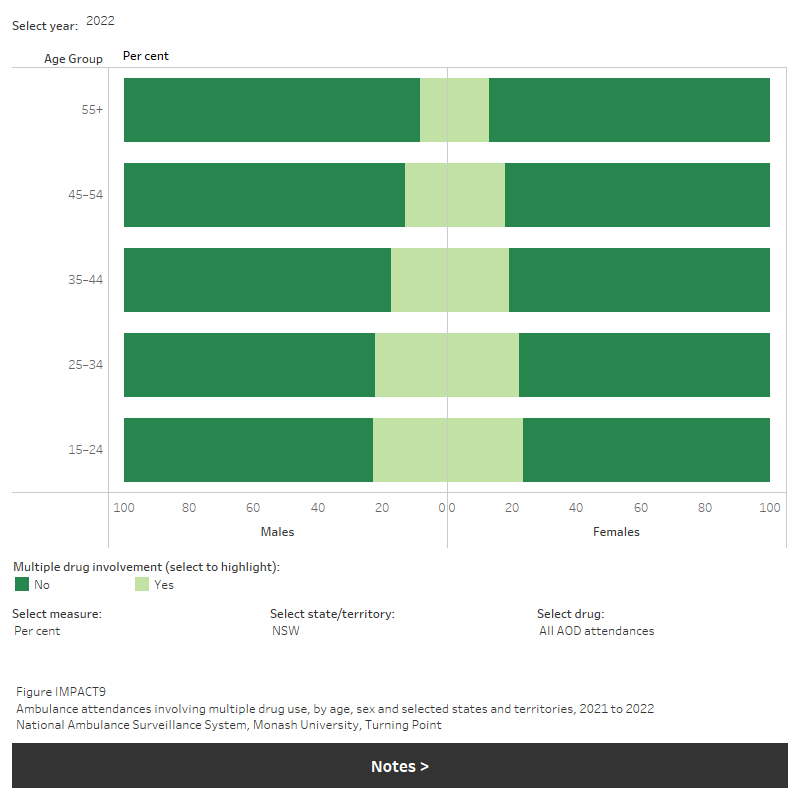
Figure IMPACT9: Ambulance attendances involving multiple drug use, by age, sex and selected states and territories, 2021 to 2022
This figure shows number and percent of multiple drug involvement for ambulance attendances in NSW. The highest number is for females aged 15-24. There is a filter to select year, state/territory, drug and measure (number or percent).
Mental health conditions
For related content on people with mental health conditions, see also:
According to the 2019 NDSHS:
- between 2016 and 2019 there was an increase in the proportion of people who had recently used an illicit drug (in the past 12 months) experiencing high or very high levels of psychological distress (from 22% to 26%)
- the proportion of people who recently used drugs who had been diagnosed with or treated for a mental health condition in the previous 12 months remained stable at around 26% (AIHW 2020, Table 4.14).
Nearly 3 in 5 (58%) participants of the 2022 EDRS self-reported mental health issues in the preceding 6 months, a small decrease from 62% in 2022. The primary issue of concern reported among this population of people who regularly use ecstasy and other stimulants was anxiety (67%) and depression (62%) (Sutherland et al. 2023a) (refer to Box HARM1 for more information).
Data collection for the EDRS for 2023 took place from April to July. Due to COVID-19 restrictions in various jurisdictions, interviews were delivered via face-to-face interview and by telephone. This change in methodology should be considered when comparing data from the 2020–2023 samples relative to previous years.
Pregnancy complications
Supporting the health and wellbeing of women throughout pregnancy helps to ensure healthy outcomes for mothers and their babies. Encouraging healthy behaviours during pregnancy can reduce the risk of adverse outcomes for mothers and their babies.
Tobacco smoking in pregnancy is a preventable risk factor for pregnancy complications. Smoking is associated with poorer perinatal outcomes including low birth weight, being small for gestational age, pre-term birth and perinatal death.
Data from the National Perinatal Data Collection showed that, in 2021, compared to babies of mothers who did not smoke, babies of mothers who smoked at any time during pregnancy were more likely to be:
- Low birth weight (12.6% compared with 5.6% of liveborn babies).
- Small for gestational age (16.1% compared with 8.4% of liveborn singleton babies).
- Born pre-term (13.1% compared with 7.6%) (AIHW 2023).
Alcohol consumption during pregnancy is also associated with adverse impacts for development of the fetal brain. Fetal alcohol spectrum disorder (FASD) is the term used to describe the effects of prenatal alcohol exposure including fetal alcohol syndrome (FAS). There are currently no data available indicating the prevalence of FASD in Australia, however there have been some jurisdictional based studies which reported birth prevalence of FAS of between 0.01 and 0.68 per 1000 live births. Higher prevalence of FAS is commonly found among Indigenous communities, likely reflecting socio-economic factors and patterns of alcohol use (Burns et al. 2013).
In 2021, the National Perinatal Data Collection collected data on maternal consumption of alcohol during pregnancy from 7 jurisdictions (data excludes New South Wales). It showed most mothers did not consume alcohol during pregnancy, specifically:
- 97% of mothers did not consume alcohol during the first 20 weeks of pregnancy.
- 99% of mothers did not consume alcohol after 20 weeks of pregnancy (AIHW 2023, tables 2.17 and 2.18).
New Australian guidelines to reduce health risks from drinking alcohol were released in December 2020. National Drug Strategy Household Survey data relating to the updated guidelines are available in the Measuring risky drinking according to the Australian alcohol guidelines report.
The latest Australian Guidelines to reduce Health risks from Drinking Alcohol advise that to prevent harm from alcohol to their unborn child, women who are pregnant or planning a pregnancy should not drink alcohol (NHMRC 2020).
The 2019 NDSHS showed that 65% of pregnant women (aged 14 to 49) abstained from drinking alcohol during their pregnancy; this is an increase from 40% in 2007 and 56% in 2016. The remaining women reported that they reduced their drinking during pregnancy (35%) compared with when they were not pregnant, and less than 1% reported drinking the same (AIHW 2020).
Questions on substance using during pregnancy were updated in the 2013 NDSHS to provide a more accurate picture of drinking during pregnancy – see 2019 NDSHS Technical notes for further information. Each question collects information about slightly different concepts. The measure about what women consumed before and after knowledge of pregnancy is likely to give the most accurate estimate on the amount of alcohol consumed during pregnancy but has only been collected since 2013.
Results from the 2019 NDSHS showed that among pregnant women aged 14 to 49 who were unaware of their pregnancy, about 1 in 2 (55%) consumed alcohol before they knew they were pregnant, and this declined to 14.5% once they knew they were pregnant. Among all pregnant women, regardless of whether they knew they were pregnant, 3 in 10 (30%) reported drinking alcohol during pregnancy and this has declined from 42% in 2013 (AIHW 2020).
Injection-related harms
For related content on injecting drug use, see also:
The 2019 NDSHS estimates that a very low proportion of the Australian general population aged 14 and over have injected drugs, either in their lifetime (1.5%) or in the past 12 months (0.3%) (AIHW 2020, tables 4.2 & 4.6). People who inject drugs are at a higher risk of living with HIV and hepatitis C (UNODC 2022).
ABS (Australian Bureau of Statistics) 2018. Causes of Death, Australia, 2017. ABS cat. no. 3303.0. Canberra: ABS. Viewed 12 October 2018.
ABS 2019. 1351.0.55.062 - Research Paper: Psychosocial risk factors as they relate to coroner-referred deaths in Australia, 2017. Canberra: ABS. Viewed 30 April 2021.
ABS 2020. Associated causes of death in mortality. Causes of Death, Australia, 2019. Canberra: ABS. Viewed 30 April 2021.
ABS 2023. Causes of Death, Australia. ABS Website, accessed 18 October 2023.
AIHW (Australian Institute of Health and Welfare) 2018. Drug related hospitalisations. Cat. no. HSE 220. Canberra: AIHW. Viewed 18 August 2021.
AIHW 2020. National Drug Strategy Household Survey 2019. Drug statistics series no. 32. Cat. no. PHE 270. Canberra: AIHW. Viewed 16 July 2020.
AIHW 2021. Australian Burden of Disease Study: Impact and causes of illness and death in Australia 2018, AIHW, Australian Government. doi:10.25816/5ps1-j259
AIHW 2022. Australian Burden of Disease Study: impact and causes of illness and death in Aboriginal and Torres Strait Islander people 2018. Cat. no: BOD 32. Canberra: AIHW. Viewed 23 March 2022.
AIHW 2023. Australia's mothers and babies, AIHW, Australian Government, accessed 29 June 2023.
Burns L, Breen C, Bower C, O’Leary C & Elliott E 2013. Counting fetal alcohol spectrum disorder in Australia: the evidence and the challenges. Drug and alcohol review. 32(5): 461-467.
Chrzanowska A, Man N, Akhurst J, Sutherland R, Degenhardt L & Peacock A 2022. Trends in drug-related hospitalisations in Australia, 1999–2021. Drug Trends Bulletin Series. Sydney: National Drug and Alcohol Research Centre, UNSW, accessed 2 November 2022.
Chrzanowska A, Man N, Akhurst J, Sutherland R, Degenhardt, L Peacock A 2023. Trends in overdose and other drug-induced deaths in Australia, 2002-2021 . Sydney: National Drug and Alcohol Research Centre, UNSW Sydney, accessed 4 May 2023.
Moayeri F, Ogeil R, Faulkner A, Wilson J, Matthews S, Lubman D, Scott D. National Surveillance System for Alcohol and Other Drug Misuse and Overdose. Melbourne: Turning Point.
NHMRC 2020. Australian guidelines to reduce health risks from drinking alcohol. Canberra: NHMRC. Viewed 20 May 2021.
Sutherland R, Karlsson A, King C, Uporova J, Chandrasena U, Jones F, Gibbs D, Price O, Dietze P, Lenton S, Salom C, Bruno R, Wilson J, Grigg J, Daly C, Thomas N, Radke S, Stafford L, Degenhardt L, Farrell M, & Peacock A. Australian Drug Trends 2023: Key Findings from the National Ecstasy and Related Drugs Reporting System (EDRS) Interviews. Sydney: National Drug and Alcohol Research Centre, UNSW Sydney; 2023. Accessed 25 October 2023.
Sutherland R, Uporova J, King C, Chandrasena U, Karlsson A, Jones F, Gibbs D, Price O, Dietze P, Lenton S, Salom C, Bruno R, Wilson J, Agramunt S, Daly C, Thomas N, Radke S, Stafford L, Degenhardt L, Farrell M, & Peacock A. Australian Drug Trends 2023: Key Findings from the National Illicit Drug Reporting System (IDRS) Interviews. Sydney: National Drug and Alcohol Research Centre, UNSW Sydney; 2023. Accessed 25 October 2023.
Penington Institute 2023. Australia’s annual overdose report 2023. Melbourne: Penington Institute, accessed 9 September 2023.
UNODC (United Nations Office on Drugs and Crime) 2022. World Drug Report 2022. Vienna: UNODC, accessed 6 July 2022.