Housing circumstances of First Nations people
Web article
Release Date:
Citation
AIHW
Australian Institute of Health and Welfare (2023) Housing circumstances of First Nations people, AIHW, Australian Government, accessed 17 April 2024.
APA
Australian Institute of Health and Welfare. (2023). Housing circumstances of First Nations people. Retrieved from https://www.aihw.gov.au/reports/australias-welfare/indigenous-housing
MLA
Housing circumstances of First Nations people. Australian Institute of Health and Welfare, 07 September 2023, https://www.aihw.gov.au/reports/australias-welfare/indigenous-housing
Vancouver
Australian Institute of Health and Welfare. Housing circumstances of First Nations people [Internet]. Canberra: Australian Institute of Health and Welfare, 2023 [cited 2024 Apr. 17]. Available from: https://www.aihw.gov.au/reports/australias-welfare/indigenous-housing
Harvard
Australian Institute of Health and Welfare (AIHW) 2023, Housing circumstances of First Nations people, viewed 17 April 2024, https://www.aihw.gov.au/reports/australias-welfare/indigenous-housing
Get citations as an Endnote file: Endnote

Housing circumstances of First Nations people
is an Australia's welfare
topic
On this page
A safe, secure home with working facilities is essential for good health and wellbeing. The quality, quantity and affordability of housing is a fundamental contributor to disadvantage and a driver of homelessness. Historical experiences of Aboriginal and Torres Strait Islander (First Nations) people and the ongoing impacts of colonisation have had a significant impact on housing situations and conditions (AIHW 2019a).
Although the housing situation of First Nations people has improved – for example with rises in home ownership and falling levels of homelessness – it has been recognised that First Nations people have significantly less access to affordable, secure and quality housing (AIHW 2019a; AIHW and NIAA 2020). As such, governments are increasingly targeting housing as an essential policy area for improving the health and wellbeing of First Nations people.
This page focuses on housing tenure (including ownership, rental, and social housing), housing affordability, housing assistance, housing quality (including facilities and structural soundness) and overcrowding. It also looks at homelessness and the use of relevant services by First Nations people.
For information on housing as a determinant of health for First Nations people, see the latest update for the Aboriginal and Torres Strait Islander Health Performance Framework (HPF) – summary report 2023; for regional level information on housing circumstances and health, see the Regional Insights for Indigenous Communities website.
Closing the Gap targets
In 2020, all Australian governments and the Coalition of Aboriginal and Torres Strait Islander Peak Organisations, including the National Aboriginal and Torres Strait Islander Housing Association (NATSIHA), worked in partnership to develop the National Agreement on Closing the Gap (the National Agreement), built around 4 Priority Reforms. The National Agreement also identifies 19 targets across 17 socioeconomic outcome areas.
The National Agreement has identified the importance of addressing appropriate and affordable housing that is aligned with the priorities and needs of First Nations people (socioeconomic outcome area 9 in the National Agreement). There are 2 targets associated with this outcome, monitored annually by the Productivity Commission and reported in their Closing the Gap Information Repository Dashboard (PM&C 2020).
National Agreement on Closing the Gap: housing-related targets
Outcome area 9: People can secure appropriate, affordable housing that is aligned with their priorities and needs. Within this outcome area, there are 2 targets.
Target 9a: By 2031, increase the proportion of Aboriginal and Torres Strait Islander people living in appropriately sized (not overcrowded) housing to 88 per cent.
The 2016 baseline was 78.9% of the proportion of Indigenous Australians living in appropriately sized (not overcrowded) housing. The most recent level, using data from 2021, is 81.4%. This is below the target trajectory proportion for 2021 of 81.9%.
Note: The baseline value for the appropriately sized housing target was derived from the Australian Bureau of Statistics (ABS) 2016 Census of Population and Housing (Census).
Target 9b: By 2031, all Aboriginal and Torres Strait Islander households:
- within discrete Aboriginal and Torres Strait Islander communities, receive essential services that meet or exceed the relevant jurisdictional standard
- in or near to a town, receive essential services that meet or exceed the same standard as applies generally within the town (including if the household might be classified for other purposes as a part of a discrete settlement such as a “town camp” or “town based reserve”).
At the time of writing, no data for Target 9b had been published.
Household characteristics
A First Nations household is defined as an occupied private dwelling where at least one of its usual residents identifies as being Aboriginal and/or Torres Strait Islander.
According to the 2021 Census of Population and Housing (Census), there were 352,041 First Nations households, representing 3.8% of all households in Australia – up from 2.1% in 2001 (ABS 2022b).
Of these households:
- 80% (281,729 dwellings) were separate houses
- 11% (38,396) were semi-detached, row or terrace houses, or townhouses
- 8% (27,919) were flats or apartments (ABS 2022b).
In 2021, the majority (96%, or around 779,300 persons) of First Nations people counted on Census night lived in private dwellings. The remainder (4.1% or around 33,400 persons) lived in non-private dwellings (such as prisons, hotels, motels or bed and breakfasts, staff quarters, boarding schools and nursing homes) (ABS 2022a).
Housing tenure
Housing tenure describes whether a dwelling is owned, rented or occupied under some other arrangement. According to the 2021 Census, more than half of First Nations households were rented (56%, or 192,703 dwellings), while 42% (145,101) were owned (with or without a mortgage) – other tenure types (including dwellings being occupied rent free or under a life tenure scheme) accounted for the remaining 1.6% of First Nations households (ABS 2022a).
Home ownership
Of First Nations households in 2021, 28% (96,647 dwellings) owned their home with a mortgage and 14% (48,452) owned their home outright (ABS 2022a). Home ownership (with and without a mortgage) has increased over time to 42% in 2021, up from 37% (75,095) in 2011, and 33% (46,188) in 2001 (ABS 2022b).
For detailed information on home ownership among First Nations people, by birth cohort and age group, see Home ownership and housing tenure.
Private rental and social housing
Of First Nations households in 2021, 35% (120,246 dwellings) were renting privately, 18% (63,269) were living in social housing (see glossary), and 2.7% (9,187) were renting from another landlord type (ABS 2022a).
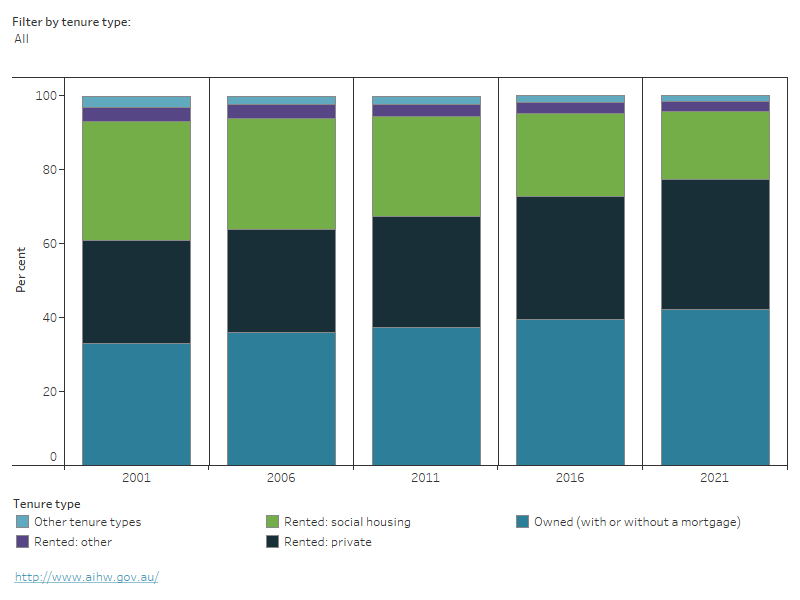
Census data indicates that, between 2001 and 2021, the proportion of First Nations households who were:
- living in social housing fell – from 32% in 2001, to 27% in 2011 and 18% in 2021
- renting privately rose – from 28% in 2001, to 30% in 2011 and 35% in 2021 (Figure 1) (ABS 2022b).
Figure 1: Tenure type, First Nations households, 2001 to 2021
Tenure type, First Nations households, 2001 to 2021. This chart shows 42% of First Nations dwellings were owned in 2021, an increase from 2011 (37%) and 2001 (33%). Between 2001 and 2021, the proportion in social housing decreased from 32% to 18%, while the proportion renting privately increased from 28% to 35%.
Notes
- First Nations households are defined as any occupied private dwelling where at least one person of any age as a resident at the time of the Census who identified as being of Aboriginal and/or Torres Strait Islander origin. Excludes 'Visitors only' and 'Other non-classifiable' households.
- Data are based on Place of Enumeration. Includes Migratory, Offshore and Shipping.
- ‘Owned with a mortgage’ includes participants in rent/buy and shared equity schemes and those living in a household in which payments were being made on mortgages or secured loans towards the purchase of the dwelling.
- ‘Social housing’ includes state/territory housing authority, housing co-operative, church group, Indigenous housing organisation, community housing or council.
- ‘Private renters’ includes renting through real estate agents, unrelated persons, relatives, owner/managers of caravan parks, employers and other landlords.
- ‘Other tenure type’ includes other tenure types and persons living under life tenure schemes.
- Denominator excludes Tenure type not stated.
- Discrepancies may occur between the sums of the component items and totals due to random adjustment to avoid the release of confidential data.
Sources: ABS 2022b; AIHW analysis of ABS Census of Population and Housing 2021.
Remoteness area
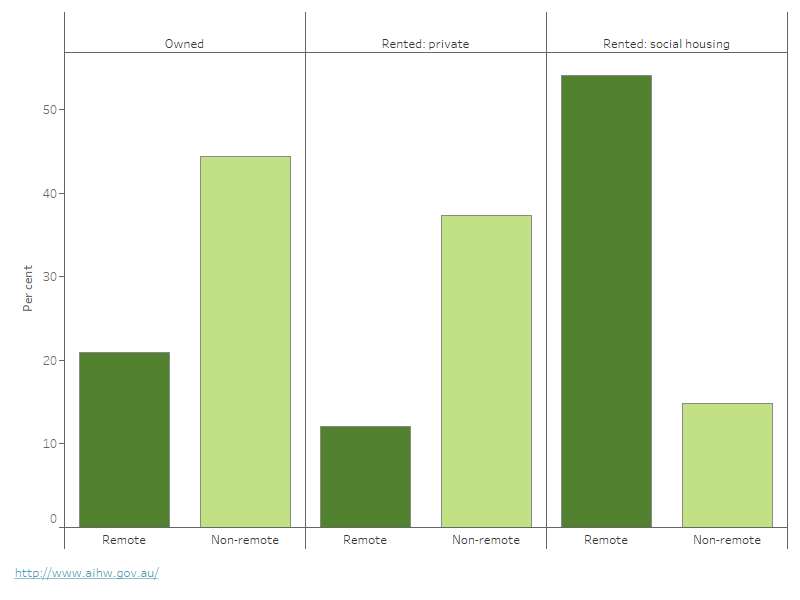
Tenure type varies with remoteness area. According to the 2021 Census, First Nations households in remote areas (Remote and Very remote areas combined) were:
- less likely to be home owners (with or without a mortgage) than First Nations households in non-remote areas (Major cities, Inner regional and Outer regional areas) (21% of dwellings, compared with 44%)
- more likely to be living in social housing than First Nations households in non-remote areas (54% of households, compared with 15%) (ABS 2022a) (Figure 2).
Figure 2: Tenure type, First Nations dwellings, by remoteness area, 2021
This chart shows that in 2021, First Nations dwellings were less likely to be owned in remote areas than in non-remote areas (21% compared with 44%). Similarly, First Nations dwellings were less likely to be privately rented in remote areas than non-remote areas (12% compared with 37%). More than half of First Nations dwellings in remote areas were social housing (54%).
Notes
- First Nations households are defined as any occupied private dwelling where at least one person of any age as a resident at the time of the Census who identified as being of Aboriginal and/or Torres Strait Islander origin. Excludes 'Visitors only' and 'Other non-classifiable' households.
- Remoteness data are based on Place of Enumeration. Includes Migratory, Offshore and Shipping.
- ‘Owned with a mortgage’ includes participants in rent/buy and shared equity schemes and those living in a household in which payments were being made on mortgages or secured loans towards the purchase of the dwelling.
- ‘Social housing’ includes state/territory housing authority, housing co-operative, church group, Indigenous housing organisation, a community housing or council.
- ‘Private renters’ includes renting through real estate agents, unrelated persons, relatives, owner/managers of caravan parks, employers and other landlords.
- Denominator excludes Tenure type not stated.
Source: AIHW analysis of ABS Census of Population and Housing 2021.
Housing affordability
Measuring housing affordability is complex. One measure of housing affordability is to compare housing costs to gross household income. A commonly used indicator of housing affordability is the proportion of households that spend more than 30% of gross income on housing costs.
According to the 2021 Census:
- 14% (11,765 dwellings) of First Nations households that were owned with a mortgage were spending more than 30% of their gross income on mortgage repayments (ABS 2022a)
- 35% (58,867 dwellings) of First Nations households that were rented were spending more than 30% of their gross income on rent payments (ABS 2022a)
- the median monthly mortgage repayment paid by First Nations households was $1,721 (ABS 2022b)
- the median weekly rent paid by First Nations households was $300. This amount differed by landlord type (higher for privately rented households than for those rented through social housing) (ABS 2022b).
Housing assistance
Access to secure and affordable housing has significant social, economic, and personal benefits (DSS 2023). First Nations people face many barriers in the housing market, some of which include discrimination, challenges in meeting criteria for properties, and lack of appropriate and good quality housing (Moskos et al. 2022; Tually et al. 2022). Hence, First Nations people are a priority group for many housing assistance services provided under the National Housing and Homelessness Agreement (Australian Government 2018). Housing assistance refers to both access to social housing and targeted financial assistance for those who are eligible (AIHW 2022a).
Financial assistance
Commonwealth Rent Assistance (CRA) is a non-taxable income supplement payable to eligible people who rent in private or community housing rental markets. It is the most common form of housing assistance received by First Nations households (AIHW 2019a).
CRA recipients are classified as ‘income units’, rather than households. An income unit is one person, or a group of persons within a household, whose command over income is shared, or any person living in a non-private dwelling who is in receipt of personal income. For this section, the term CRA recipients is used instead of income units.
At the end of June 2022, 89,500 CRA recipients reported having a First Nations member. This equates to 6.6% of all CRA recipients, an increase from 4.3% in 2013 (AIHW 2023). Changes to social security payments were made in response to the COVID-19 pandemic, and as a result, the number of recipients receiving CRA peaked in 2020 (AIHW 2022a).
Rental stress is defined here as a CRA recipient that spends more than 30% of gross income on rent. At June 2022, of First Nations CRA recipients:
- 68% (60,200) would have been in rental stress without CRA
- 36% (32,100) were still in rental stress after receiving CRA – an increase since 2013 (30%, or 16,495) (AIHW 2023).
Between 2013 and 2022, the proportion of First Nations CRA recipients in rental stress generally increased over time, with the exception of 2020 (19%, or 19,031). This is because the 2020 calculation of rental stress included the temporary Coronavirus Supplement (AIHW 2022a).
Social housing programs
Social housing is low cost or subsidised rental housing provided by state and territory governments and the community sector. Its purpose is to assist people who are unable to afford or access suitable rental accommodation in the private rental market (Thomas 2018).
There are 4 main social housing programs operating in Australia, 2 of which are specifically targeted at First Nations people (Table 1):
- state owned and managed Indigenous housing (SOMIH) – accessed by those on low incomes and/or with special needs
- Indigenous community housing (ICH) – owned and/or managed by First Nations organisations for the provision of housing services to First Nations people (AIHW 2019a, 2022a).
Allocating social housing to eligible applicants depends on their level of priority (based on need) and dwelling availability. Social housing is generally allocated to those with the greatest need (see glossary) (AIHW 2022a).
Type | First Nations specific housing | Owner and/or managed |
|---|---|---|
Public housing | No | State or territory government |
Community housing | No | Community organisation |
State owned and managed Indigenous housing (SOMIH) | Yes | State or territory government |
Indigenous community housing (ICH) | Yes | First Nations organisations |
According to data from the AIHW National Housing Assistance Data Repository, as at 30 June 2022 there were around 79,166 First Nations households in social housing:
- 38,251 in public housing
- 11,210 in community housing
- 13,424 in SOMIH
- 16,281 in ICH (may include some ICH households that are not First Nations households) (AIHW 2023).
Fewer households left SOMIH in the last 6 months of 2019–20 and in 2020–21, thus increasing waiting lists for SOMIH in some jurisdictions (AIHW 2022a). In addition, fewer people left all housing programs during these years due to a combination of the impacts of the COVID-19 pandemic, a tighter private rental market and increase living costs (Buckle 2023; NHFIC 2023).
Social housing dwelling standards and tenant satisfaction
Tenant satisfaction is measured by how the tenant/s rate the condition of their home and the number of its working facilities (see Housing quality).
According to the 2021 National Social Housing Survey (NSHS):
- of First Nations households, 69% of public housing tenants were satisfied or very satisfied with their housing, compared with 67% of community housing and 64% of SOMIH tenants
- 82% of First Nations households said that the size of their living spaces met their needs
- whether amenities met needs of SOMIH tenants varied by amenity type and over time:
- thermal comfort (increased from 62% in 2018 to 69% in 2021)
- number of bedrooms (remained around 84% in 2018 and 2021)
- safety/security of the home (declined from 81% in 2018 to 78% in 2021) (AIHW 2022b).
The 2021 NSHS, did not include a survey of ICH tenants due to COVID-19 and its impact on face-to-face survey methods.
Housing quality
Housing quality is closely related to environmental health and affects a range of health indicators (SCRGSP 2020). For instance, poor air quality, lack of power and safe drinking water and inadequate waste and sanitation facilities, all contribute to poorer health and welfare.
In 2018–19:
- 1 in 5 (20%) First Nations households were living in dwellings that did not meet an acceptable standard – defined in the National Aboriginal and Torres Strait Islander Health Survey (NATSIHS) as having at least one basic household facility that was unavailable or having more than 2 major structural problems.
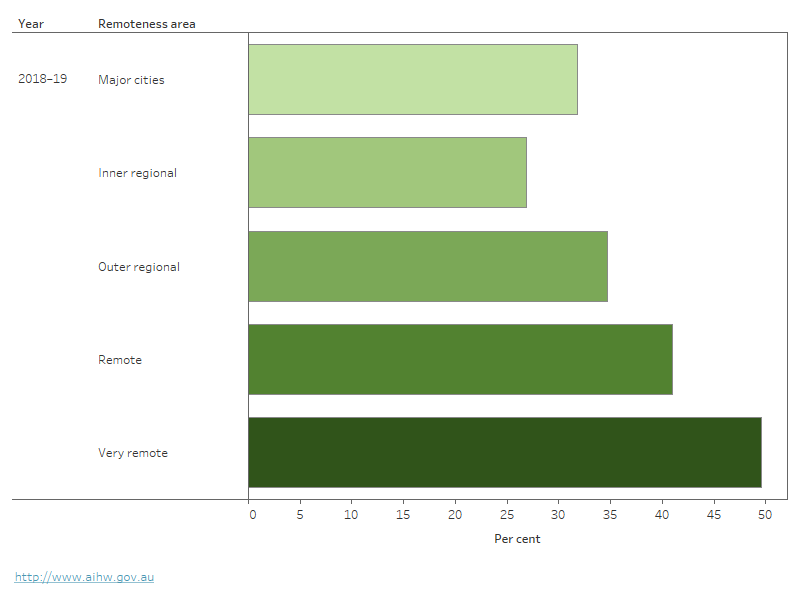
- 1 in 3 (33%) First Nations households were living in dwellings with at least one major structural problem (for example, major cracks in walls/floors, walls or windows that are not straight, or major plumbing problems). First Nations households in remote areas were more likely to live in dwellings with structural problems than those in non-remote areas (46% and 31%, respectively) (Figure 3).
- 1 in 11 (9.1%) First Nations households had no access to working facilities for food preparation, 4.5% had no access to working facilities to wash clothes and bedding and 2.8% had no access to working facilities to wash household residents (AIHW and NIAA 2020).
Figure 3: First Nations households with major structural problems, by remoteness area, 2018–19
This chart shows that in 2018–19, 50% of First Nations households in Very remote areas and 41% in Remote areas had at least one major structural problem. Whereas less than 35% of First Nations households in Major cities, Inner regional and Outer regional areas had the same.
Note: A First Nations household is defined as an occupied private dwelling where at least one permanent resident identifies as being of Aboriginal or Torres Strait Islander origin.
Source: AIHW and ABS analysis of National Aboriginal and Torres Strait Islander Health Survey 2018–19.
Overcrowding
The following definition for overcrowding is based on the Canadian National Occupancy Standard (see glossary). This definition may not adequately reflect the perspectives First Nations people have on overcrowding, as it does not consider differences like cultural norms around shared living and sleeping arrangements (Dockery et al. 2022).
The 2021 Census identified that 81% of First Nations people (569,355 persons) across all types of housing tenure were living in appropriately sized housing (not overcrowded) – an increase from 79% (426,638) in 2016, and 69% (241,659) in 2001 (ABS 2022b).
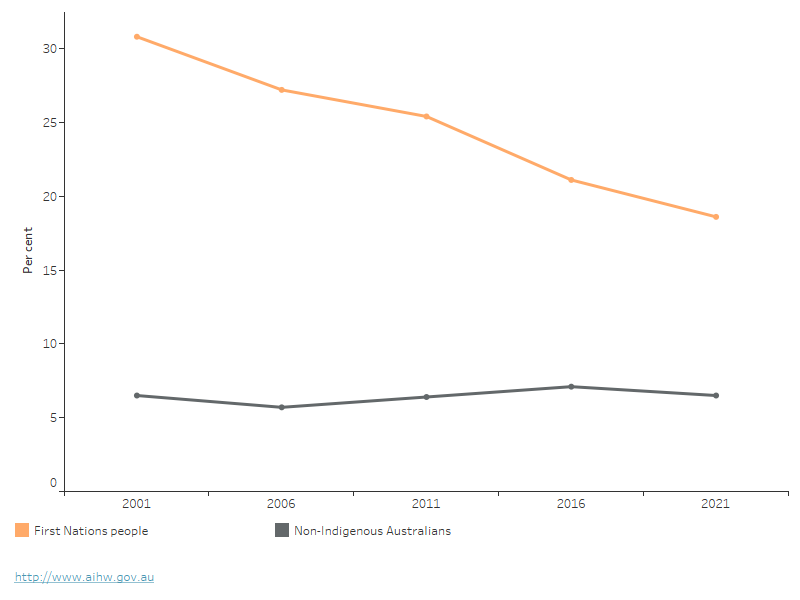
Available data suggests a decline in overcrowding over time. The proportion of First Nations people living in overcrowded conditions fell from 31% in 2001 to 19% in 2021 (Figure 4). This drop in overcrowding represents a narrowing of the gap between First Nations people and non-Indigenous Australians from 24 to 12 percentage points (ABS 2021b; AIHW and NIAA 2020).
Figure 4: Overcrowded housing, by Indigenous status, 2001 to 2021
Overcrowded housing over time, by Indigenous status, 2001 and 2021. This chart shows that the proportion of First Nations people living in overcrowded conditions decreased from 31% in 2001 to 19% in 2021. First Nations people were consistently more likely to live in overcrowded conditions than non-Indigenous Australians.
Notes
- Indigenous status refers to whether a person has identified as being of Aboriginal and/or Torres Strait Islander origin.
- Includes people living in households requiring at least one additional bedroom, based on the Canadian National Occupancy Standard for Housing Appropriateness.
- Data excludes overseas visitors and persons who did not state their Indigenous status.
Sources: AIHW analysis of ABS Census of Population and Housing 2021; PM&C 2020.
Overcrowding rates varied with remoteness. According to the 2021 Census, the proportion of First Nations people living in overcrowded dwellings was higher in remote areas (55% in Very remote areas and 32% in Remote areas), than in non-remote areas (18% in Outer regional areas, 13% in Inner regional areas and 12% in Major cities) (ABS 2022a).
First Nations households were particularly affected by the COVID-19 pandemic lockdowns and border restrictions, with visitors unable to return to homelands placing added pressure on households in urban centres, as well as the influx of people returning to country (Dockery et al. 2022).
Homelessness
First Nations people are over-represented in both the national homeless (see glossary) population and as users of Specialist Homelessness Services (SHS).
The ABS 2021 Census showed that First Nations people accounted for over one-fifth (20% or an estimated 24,930 people) of the homeless population nationally but only 3.8% of the total Australian population (ABS 2022b, ABS 2023).
Of First Nations people experiencing homelessness at the time of the 2021 Census:
- 60% (14,956 persons) were living in severely crowded dwellings (see glossary)
- 19% (4,753) were in supported accommodations for the homeless
- 9% (2,320) were living in improvised dwellings, tents, or sleepouts (ABS 2023).
2021–22 SHS data show that:
- around 72,900 First Nations people received SHS support
- First Nations people made up 28% of all SHS clients (AIHW 2022c) – an increase from 22% (43,600) of all SHS clients in 2011–12
- more First Nations clients (70%) than non-Indigenous clients (61%) were returning clients (that is, they had received SHS services at some point since the collection began in July 2011)
- 50% (almost 36,500) of First Nations SHS clients were aged under 25 compared with 39% (71,700) of non-Indigenous clients
- family and domestic violence (24%), housing crisis (for example, eviction) (19%), and inadequate or inappropriate dwelling conditions (13%) were the main reasons First Nations people sought assistance from SHS agencies (AIHW 2022c).
For more information on First Nations people receiving support from specialist homelessness services, see the Specialist homelessness services annual report 2021–22.
Where do I go for more information?
For more information on housing for First Nations people, see:
- Housing assistance in Australia 2023
- Aboriginal and Torres Strait Islander Health Performance Framework – summary report 2023
- National Social Housing Survey, 2021
- Productivity Commission Report on Government Services, Chapter 18 – housing
- Productivity Commission Overcoming Indigenous disadvantage – key indicators 2020
ABS (Australian Bureau of Statistics) (2022a) Census of Population and Housing [TableBuilder], ABS website, accessed 12 May 2023.
ABS (2022b) Housing Statistics for Aboriginal and Torres Strait Islander Peoples, ABS website, accessed 6 February 2023.
ABS (2023) Estimating Homelessness: Census, ABS website, accessed 23 March 2023.
Australian Government (2018) National Housing and Homelessness Agreement, Australian Government website, accessed 2 August 2021.
AIHW (Australian Institute of Health and Welfare) (2019a) Aboriginal and Torres Strait Islander people: a focus report on housing and homelessness, AIHW, Australian Government, accessed 2 August 2021.
AIHW (2022a) Housing assistance in Australia, AIHW, Australian Government, accessed 18 November 2022.
AIHW (2022b) National Social Housing Survey 2021, AIHW, Australian Government, accessed 20 December 2022.
AIHW (2022c) Specialist Homelessness Services Annual Report, AIHW, Australian Government, accessed 15 December 2022.
AIHW (2023) Housing assistance in Australia, AIHW, Australian Government, accessed 28 June 2023.
AIHW and NIAA (National Indigenous Australians Agency) (2020) Aboriginal and Torres Strait Islander Health Performance Framework: 2.01 Housing, Australian Government, accessed 2 August 2021.
Buckle C, Gurran N, Phibbs P, Harris P, Lea T and Shrivastava R (2020) Marginal housing during COVID-19, AHURI Final Report no. 348, doi:10.18408/ahuri7325501.
DSS (Department of Social Services) (2023) National Housing and Homelessness Plan, DSS website, accessed 16 February 2023.
Dockery AM, Moskos M, Isherwood L and Harris M (2022) How many in a crowd? Assessing overcrowding measures in Australian housing, AHURI Final Report no. 382, doi:10.18408/ahuri8123401.
Moskos M, Isherwood L, Dockery M, Baker E and Pham A (2022) What works’ to sustain Indigenous tenancies in Australia, AHURI Final Report no. 374, doi:10.18408/ahuri3122901.
NHFIC (National Housing Finance and Investment Corporation) (2023) State of the Nation’s Housing 2022–23, Australian Government website, accessed 15 May 2023.
PM&C (Department of Prime Minister and Cabinet) (2020) Closing the Gap Report 2020, PM&C, Australian Government, accessed 19 January 2023.
SCRGSP (Steering Committee for the Review of Government Service Provision) (2020) Overcoming Indigenous disadvantage: key indicators 2020, Productivity Commission, Australian Government, accessed 19 January 2023.
Thomas M (2018) Social housing and homelessness. Budget review 2017–18, Parliament of Australia, accessed 12 May 2023.
Tually S, Tedmanson D, Habibis D, McKinley K, Akbar S, Chong A, Deuter K and Goodwin-Smith I (2022) Urban Indigenous homelessness: much more than housing, AHURI Final Report no. 383, accessed 12 May 2023, doi:10.18408/ahuri3222701.