
Living with illness (non-fatal)
52%
of total burden

Dying prematurely (fatal)
48%
of total burden
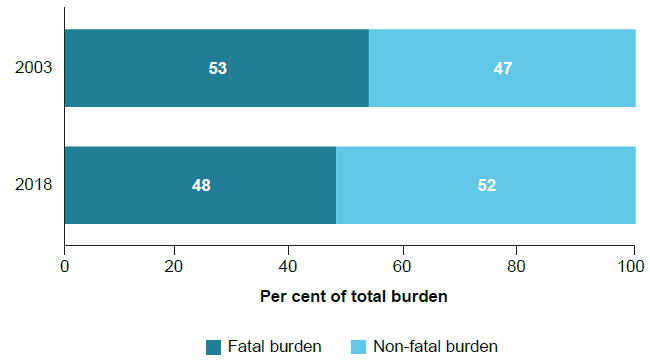
Living with illness or injury (non-fatal burden) caused slightly more total disease burden than dying prematurely (fatal). There has been a moderate shift from fatal to non-fatal burden being the biggest contributor to total burden between 2003 and 2018, driven by less premature deaths.
Figure 1: Proportion (%) of total burden due to fatal and non-fatal burden in 2003 and 2018
Significant improvements in fatal burden
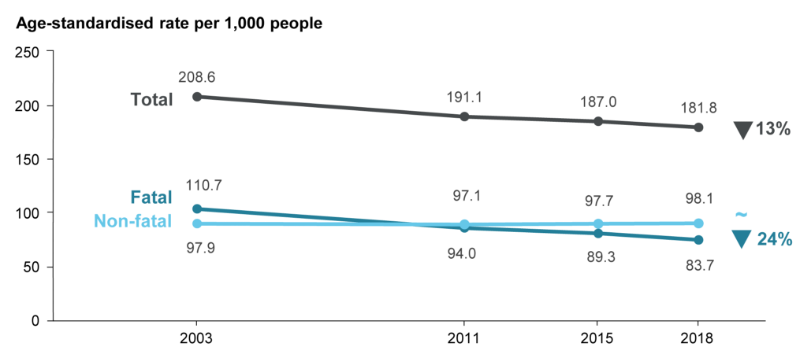
Over the 15-year period from 2003 to 2018, and after adjusting for population growth and ageing, there was a 24% decline in fatal burden, with non-fatal burden rates remaining stable. This meant that the total burden decreased by 13%.
Figure 2: Change between 2003 and 2018 in the age-standardised total burden (DALY), fatal burden (YLL) and non-fatal burden (YLD) rate (per 1,000 population)
Chronic disease and injury cause most of the burden
In 2018, the 5 disease groups that caused the most burden were cancer, musculoskeletal conditions, cardiovascular diseases, mental & substance use disorders and injuries.
Figure 3: Proportion (%) of total burden, and fatal and non-fatal composition of total burden, for the leading 5 diseases groups in 2018
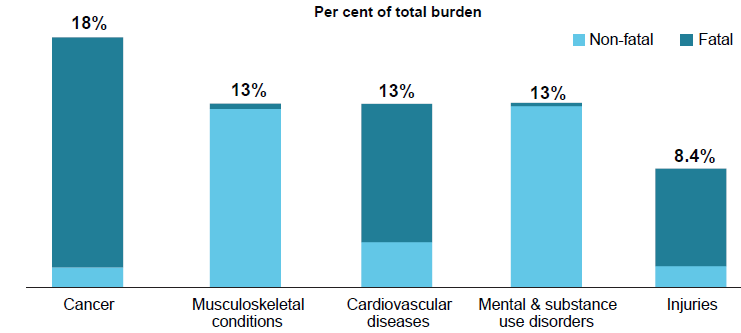
Together these disease groups accounted for around two-thirds (65%) of the total burden. With the exception of injuries, which includes acute injuries, these disease groups include mostly chronic, or long-lasting, conditions.
The cancer & other neoplasms disease group contributed the most burden across all years of the study.
Coronary heart disease the leading specific cause of burden
When considering individual diseases, coronary heart disease was the leading cause of burden, and also showed the largest reduction in total burden over time – from 21 to 10 DALY per 1,000 people between 2003 and 2018. This reduction was mainly driven by large declines in fatal burden.
The leading 5 diseases causing burden (% of total DALY) in 2018:
- Coronary heart disease 6.3%
- Back pain & problems 4.5%
- Dementia 4.0%
- Chronic obstructive pulmonary disease (COPD) 3.5%
- Lung cancer 3.2%
Figure 4: Change in disease ranking and age-standardised DALY rate (per 1,000 population), 2003 and 2018
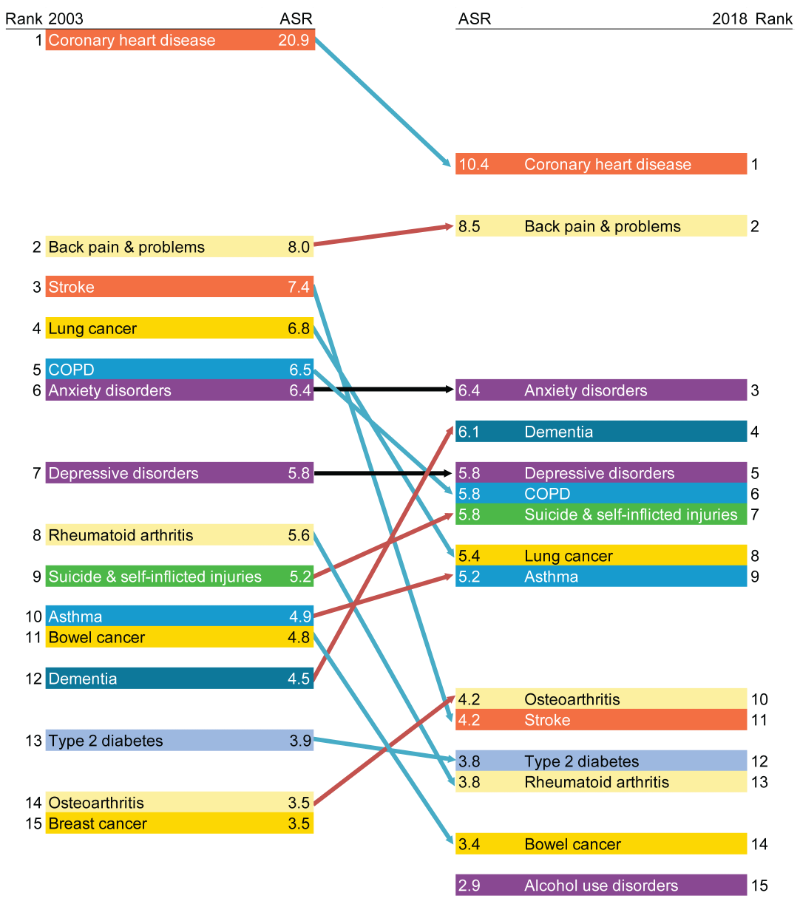
ASR = Age-standardised rate.
Notes
- Diseases are presented in descending order, from highest ASR to lowest ASR, with arrows indicating either an increase (red), decrease (blue) or no change (black) in the ASR over time.
- ‘Other musculoskeletal conditions’ are excluded from the rankings.
- There were changes in practices of coding deaths due to dementia; therefore, caution is recommended when interpreting changes over time for dementia burden.
A decline in total burden (based on age-standardised DALY rates) was also seen for stroke, lung and bowel cancer and rheumatoid arthritis. The total burden from dementia increased from 4.5 to 6.1 DALY per 1,000 (partly due to changes in practices of coding deaths due to dementia), and the rank increased from 12 in 2003 to 4 in 2018.
The leading diseases causing fatal burden were coronary heart disease (which had a large decline between 2003 and 2018), lung cancer (slight decline) and suicide & self-inflicted injuries (slight increase). Back pain & problems (which increased slightly between 2003 and 2018) was the leading cause of non-fatal burden, followed by anxiety disorders and depressive disorders (which remained stable).
More burden for males
Males experienced more total burden than females for most age groups. In 2018, males suffered 1.6 times the rate of fatal burden (104 YLL per 1,000 population) experienced by females (65 YLL per 1,000 population). Males suffered almost 3 times the amount of burden due to suicide & self-inflicted injuries (ranked third in males) and more burden from lung cancer than females, while females experienced more burden from dementia (ranked first in females).
Over one-third of disease burden is potentially preventable
In 2018, 38% of the burden of disease could have been prevented by reducing or avoiding exposure to the modifiable risk factors examined in this study.
The risk factors contributing the most burden in 2018 were tobacco use (8.6%), overweight (including obesity) (8.4%), followed by dietary risks (5.4%), high blood pressure (5.1%), and alcohol use (4.5%).
Figure 5: Proportion (%) of total burden attributable to the leading 5 risk factors in 2018
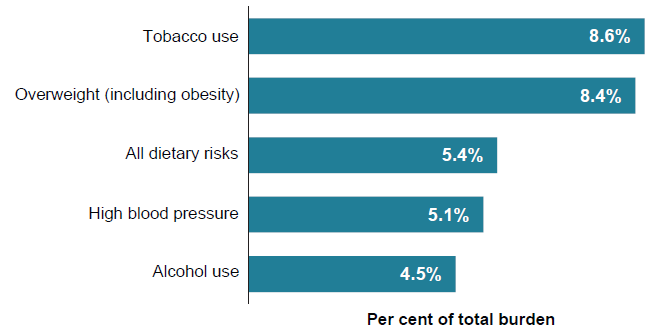
Tobacco use was the leading risk factor for both males and females and contributed the most to fatal burden, with almost 20,500 attributable deaths (13% of all deaths) in 2018. Overweight (including obesity) contributed the most to non-fatal burden.
After adjusting for population growth and ageing, the rates of burden attributable to the top 2 risk factors were shown to decrease over the period 2003 to 2018. For tobacco use, the decline in attributable burden was mainly driven by continued declines in smoking prevalence and major linked diseases. For overweight (including obesity), small declines were evident between 2003 and 2015, followed by a small increase between 2015 and 2018. These trends were partly driven by increasing rates of burden attributable to obesity and some linked diseases such as dementia; and declining rates in burden attributable to overweight (but not obesity) and linked diseases such as cardiovascular diseases.
Figure 6: Change between 2003 and 2018 in the age-standardised attributable DALY rate (per 1,000 population) for the leading 2 risk factors in 2018
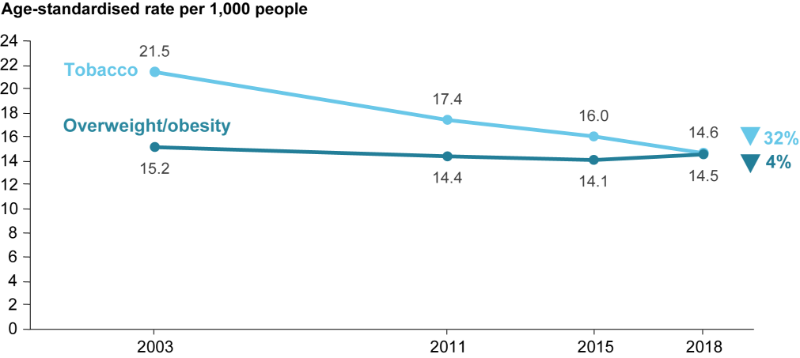
Declines were observed for most leading risk factors with the exception of illicit drug use for which the age-standardised DALY rate increased by 35% between 2003 and 2018, resulting in change in ranking from the 8th leading risk factor in 2003 to 6th in 2018.
Disease burden is not shared equally across Australia
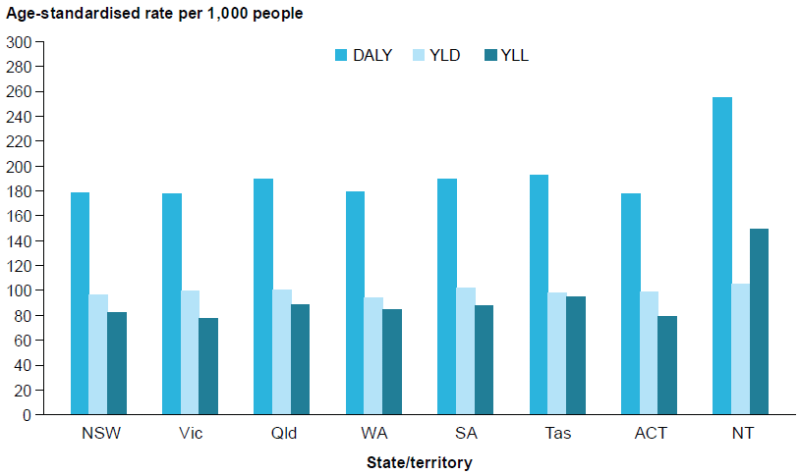
The overall rate of total, fatal and non-fatal burden was similar across states and territories, except the Northern Territory where the age-standardised DALY rate was 1.4 times as high as the national rate. The Northern Territory has the smallest population, but also a younger population and a higher proportion identifying as Aboriginal or Torres Strait Islander than in other states and territories.
Figure 7: DALY, YLD and YLL age-standardised rates (per 1,000 population), by state or territory, 2018
Large inequalities were also found across socioeconomic groups and remoteness areas. The total burden (DALY rate) in:

Remote and very remote areas is
1.4 x
Major cities


Lowest socioeconomic group is
1.6 x
Highest socioeconomic group

Living longer but no change in proportion of life spent in full health
Australians are, on average, living longer and spending more years in full health (meaning no disease or injury; also referred to as health-adjusted life expectancy). However, years lived in ill health are also increasing, resulting in little change in the proportion of life spent in full health.
Males and females born in 2018 could expect to live an average of 89% and 87% of their lives in full health respectively (71.5 years of the 80.7 years of average life expectancy for males and 74.1 years of the 84.9 years of average life expectancy for females).
Between 2003 and 2018, the average proportion of life spent in full health remained largely the same for males (89%), but decreased slightly for females (from 88% to 87%).
The gap in both life expectancy and health-adjusted life expectancy between Major cities and Remote and very remote areas reduced between 2011 and 2018.
Lower socioeconomic groups live fewer years in full health
In 2018, males and females in the lowest (most disadvantaged) socioeconomic group lived fewer years in full health, and a smaller proportion of life expectancy (at birth) in full health, compared to those in the highest (least disadvantaged) socioeconomic group.
Figure 8: Expected years lived in full health and ill health (and proportion of life lived in full health), by sex and socioeconomic group, 2018
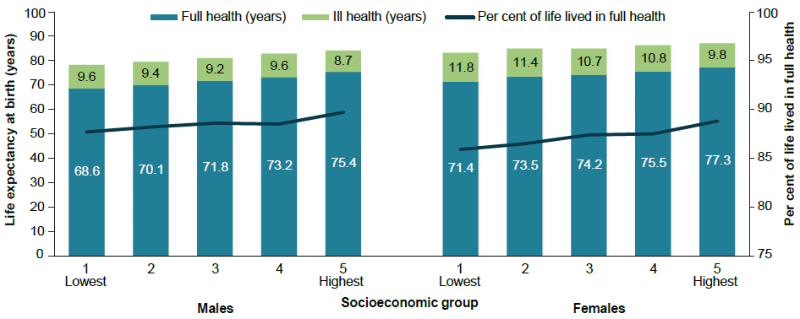
The proportion of life expectancy at birth lived in full health for the period 2011 to 2018 remained largely the same for males and females in the highest socioeconomic group, and declined for females in the lowest socioeconomic group (there was no change for males). Similar patterns were observed at age 65 except that declines in the lowest socioeconomic group were observed for both males and females, suggesting a slight widening of the gap in health-adjusted life expectancy between the lowest and highest socioeconomic groups at that age.