Respiratory conditions

Because of the link between air pollution from bushfire smoke and respiratory conditions (see Australian bushfires 2019–20: exploring the short-term health impacts), hospitalisations with a principal diagnosis categorised as a respiratory condition (ICD-10-AM codes J00–J99) were analysed.

It should be noted that respiratory conditions, particularly in the earlier part of the bushfire season, may be largely caused or exacerbated by factors other than bushfire smoke (for example, pollen, dust storms, respiratory infections and random variation) which may vary from year to year. 

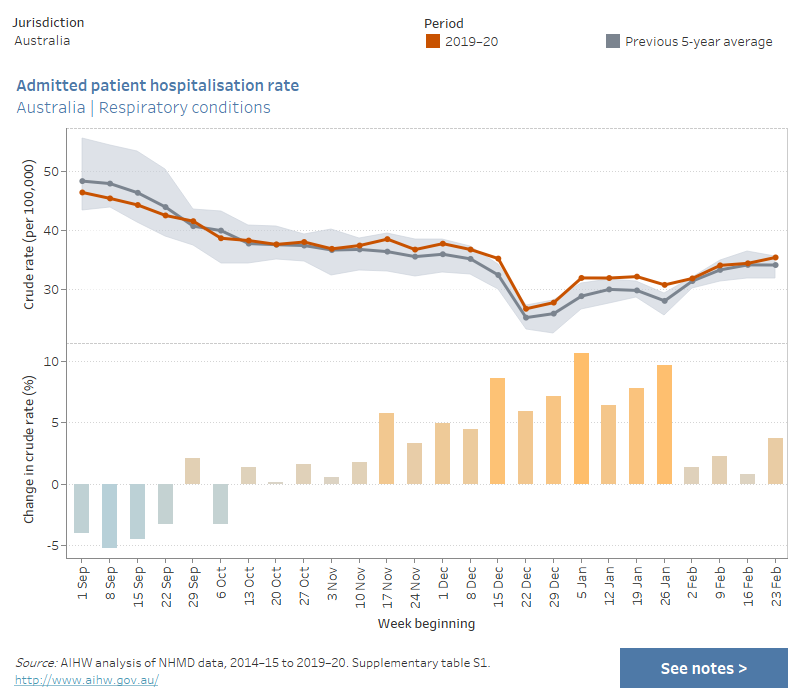
To explore changes in hospitalisations, data from each week in the 2019–20 bushfire season were compared with a 5-year average (2014–15 to 2018–19) of the same week. Increases in hospitalisation rates for respiratory conditions coincided with weeks with increased bushfire activity. This was largely driven by increases in more populous states (New South Wales, Victoria and Queensland) which sustained heavy impacts from bushfire.

Nationally, compared with the previous 5-year average, the hospitalisation rate for respiratory conditions was particularly high during January 2020. The largest increase in the hospitalisation rate was 11% in the week beginning 5 January 2020—32 per 100,000 persons (about 8,100 hospitalisations), compared with the previous 5-year average of 29 per 100,000 (an average of about 7,000 hospitalisations).

To explore national data and data for states and territories, see interactive data visualisations below (for data tables see Supplementary table S1).

Admitted patient hospitalisation rate, by jurisdiction, respiratory conditions (ICD-10-AM codes J00–J99), weeks in 2019–20 bushfire season relative to previous 5-year average

This combined chart shows the crude rate of admitted patient hospitalisations (per 100,000 persons) for respiratory conditions for the periods 2019–20 and the previous 5-year average, and the percentage change in crude rate between the two periods. Data are presented by jurisdiction and by week, for the period 1 September to 29 February/1 March, which correspond to the bushfire season. The chart shows that nationally, compared with the previous 5-year average, the hospitalisation rate for respiratory conditions was particularly high during January 2020. There were also variations at the jurisdictional level.

At the state and territory level, examples of large increases in the hospitalisation rate for respiratory conditions coinciding with periods of significant fire activity or air pollution include:

  • a 14% increase in the week beginning 5 January 2020 for Victorian residents—31 per 100,000 persons (about 2,000 hospitalisations), compared with an average of 27 per 100,000 in the previous 5-year period (an average of about 1,700 hospitalisations)
  • a 20% increase in the week beginning 15 December 2019 for South Australian residents—41 per 100,000 persons (about 720 hospitalisations), compared with an average of 34 per 100,000 in the previous 5-year period (an average of about 590 hospitalisations)
  • a 52% increase in the week beginning 5 January 2020 for Australian Capital Territory residents—32 per 100,000 persons (about 135 hospitalisations), compared with an average of 21 per 100,000 in the previous 5-year period (an average of 86 hospitalisations).

At the level of Statistical Area Level 4 (SA4), examples of large increases in the hospitalisation rate for respiratory conditions coinciding with periods of significant fire activity or air pollution include:

  • a 67% increase in the week beginning 5 January 2020 for Sydney – Sutherland residents—34 per 100,000 persons (78 hospitalisations), compared with an average of 20 per 100,000 in the previous 5-year period (an average of 46 hospitalisations)
  • a 64% increase in the week beginning 22 December 2019 for Bendigo residents—44 per 100,000 persons (72 hospitalisations), compared with an average of 27 per 100,000 in the previous 5-year period (an average of 42 hospitalisations)
  • a 71% increase in the week beginning 17 November 2019 for Queensland – Outback residents—84 per 100,000 persons (69 hospitalisations), compared with an average of 49 per 100,000 in the previous 5-year period (an average of 41 hospitalisations).

For data by Statistical Area Level 4 (SA4), see Supplementary table S2.