How common is visual impairment?
It is estimated that over 13 million Australians have one or more chronic (long-term) eye conditions, according to self-reported data from the Australian Bureau of Statistics (ABS) 2017–18 National Health Survey (NHS). This includes:
- 7.2 million with hyperopia (long-sightedness)
- 6.3 million with myopia (short-sightedness)
- 1.4 million with astigmatism
- 687,000 with presbyopia (loss of focusing ability with age)
- 549,000 with colour blindness
- 411,000 with cataract
- 244,000 with macular degeneration
- 131,000 with blindness (complete and partial).
For eye health definitions see the eye health glossary. Note that there are limitations to self-reported eye problems. For more information, see Livingston et. al (1998).
Chronic eye conditions vary in their presentation, treatment and consequences, but almost all are more common in older people. In 2017–18, chronic eye conditions affected 93% of people aged 65 and over, compared with only 12% among people aged 0–14 (Figure 1). Females experience a higher prevalence of chronic eye conditions than males (59% and 51% respectively) (ABS 2018).
Figure 1: Prevalence of self-reported chronic eye conditions(a) by age and sex, 2017–18
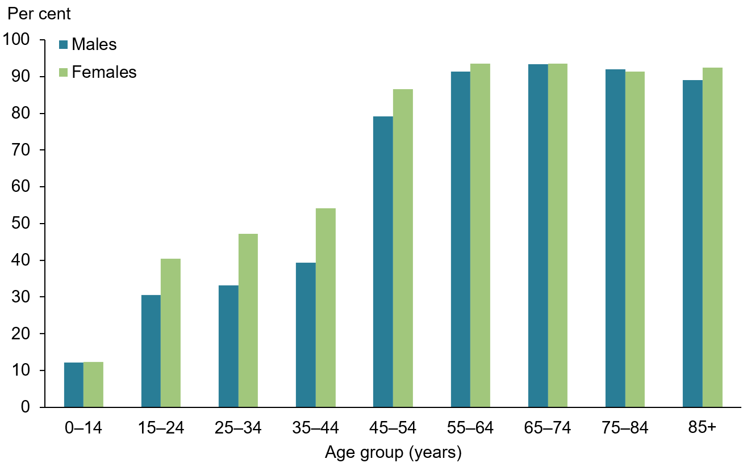
(a) Includes colour blindness, hyperopia, myopia, astigmatism, presbyopia, other disorders of ocular muscles, cataract, macular degeneration, other disorders of the choroid and retina, glaucoma, partial and complete blindness in one or both eyes, other visual disturbances or loss of vision, other diseases of eye and ocular adnexa.
Source: ABS 2019a (Table 1.1).
From 2007–08 to 2017–18, prevalence of self-reported chronic eye conditions increased for 0 to 30 year olds (from 20% to 24%), and decreased for those aged 61 years and above (95% to 93%). The prevalence overall remained steady at about 50%, after adjusting for age (Figure 2).
Figure 2: Prevalence of self-reported chronic eye conditions(a), by age group, 2007–08 to 2017–18
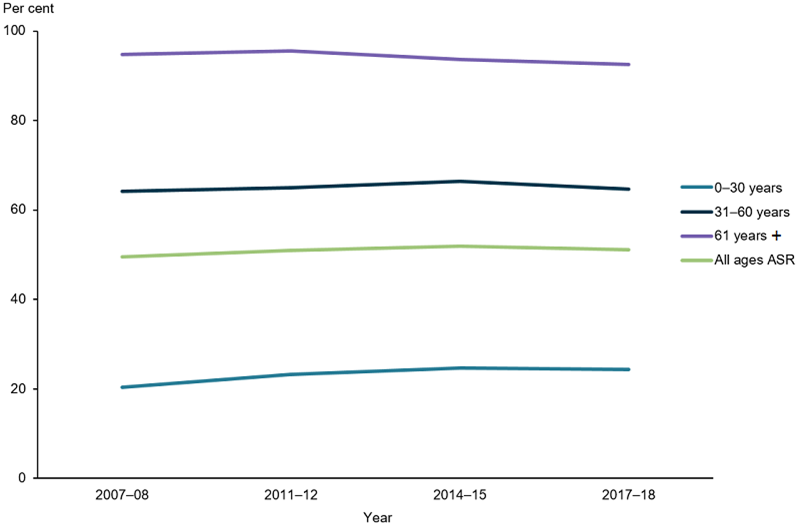
(a) Includes hyperopia, myopia, astigmatism, presbyopia, other disorders of ocular muscles, cataract, macular degeneration, other disorders of the choroid and retina, glaucoma, partial and complete blindness in one or both eyes, other visual disturbances or loss of vision, other diseases of eye and ocular adnexa.
Note: Age-standardised to the 2001 Australian standard population.
Source: ABS 2009, ABS 2013, ABS 2016, ABS 2019a (Table 1.2).
Types of vision disorders
Refractive error
Refractive error refers to a group of common eye conditions where the eye cannot clearly focus, causing blurred vision. Corrective glasses or contact lenses can generally remedy refractive error (CERA, 2014a).
These conditions include:
- myopia (or short-sightedness), when someone has trouble seeing in the distance
- hyperopia (or long-sightedness), when someone has trouble seeing both up close and in the distance
- astigmatism, distorted vision due to irregular curvature of the eye’s front surface
- presbyopia, when someone has trouble seeing up close due to reduced focusing ability of the lens with age (CERA, 2014a).
Between 2007–08 and 2017–18, there was a slight increase in the prevalence of both long-sightedness (from 25% to 28%) and short-sightedness (from 22% to 25%), after adjusting for age (Figure 3).
Figure 3: Prevalence of refractive error from 2007–08 to 2017–18
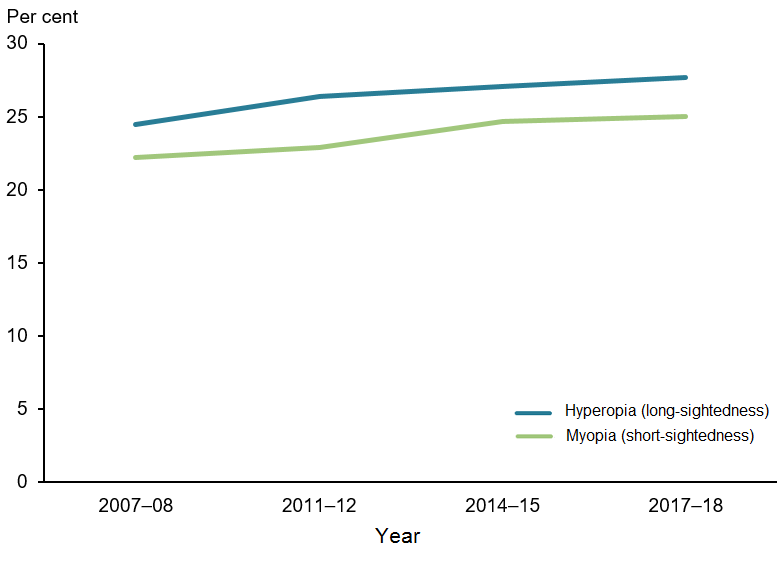
Note: Age-standardised to the 2001 Australian standard population.
Source: ABS 2009, ABS 2013, ABS 2016, ABS 2019a (Table 1.3).
Cataract
Cataract is a clouding of the lens inside the eye (NEI, 2019). It is a condition that mostly occurs gradually with age, though there are congenital types and some acute forms due to ocular trauma or systemic disease. Left unmanaged it can lead to vision loss and blindness. In most cases cataract is treated through surgical removal of the cloudy lens, and insertion of a clear synthetic lens (NEI, 2019). See Treatment and Management.
Based on results from the National Health Survey (NHS), prevalence of cataract among Australians aged 65 and older has not changed significantly between 2007–08 (9.0% males and 10.2% females) and 2017–18 (7.4% males and 10.6% females) (Figure 4).
Figure 4: Prevalence of cataract in adults aged 65 and over by sex, 2007–08 to 2017–18
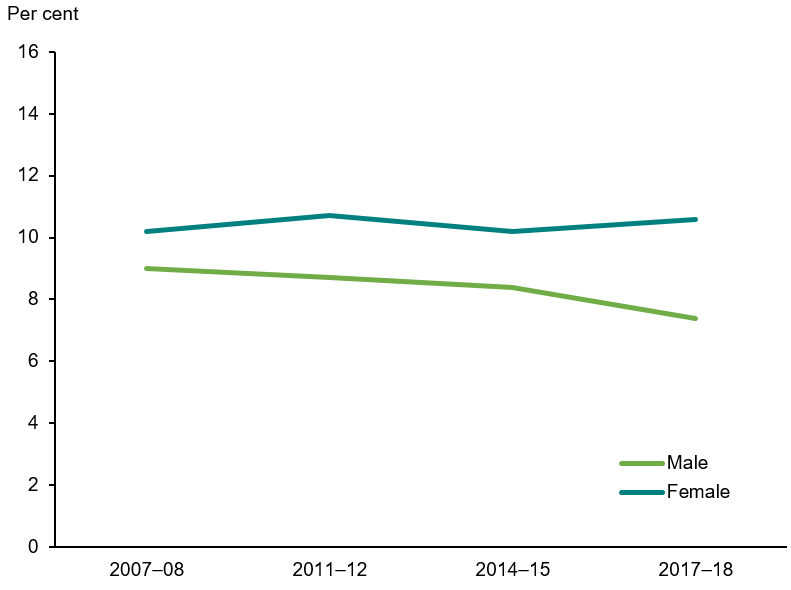
Source: ABS 2009, ABS 2013, ABS 2016, ABS 2019a (Table 1.4).
Macular degeneration
The macula is the part of the eye responsible for central vision. Tasks such as reading, recognising faces and driving all rely on macular function. Macular degeneration is a disease that slowly degrades the macula, leading to vision loss and sometimes blindness (MDFA 2020, CERA 2014b). In Australia, it is the leading cause of blindness in those aged 65 and over (Foreman et al. 2016).
There are two forms of macular degeneration:
- dry macular degeneration, there is currently no treatment (HMS 2013).
- wet macular degeneration, the more serious form of the disease characterised by growth of new leaky blood vessels at the macula (HMS 2013). It leads to severe vision loss and blindness, and is most commonly managed via eye injections (CERA 2014a). See Treatment and Management.
Among Australians aged 65 and over, prevalence has remained stable from 2007–08 to 2017–18 (between 3.6 and 5.1% in males, 6.8% and 4.9% in females) (Figure 5).
Figure 5: Prevalence of macular degeneration in people aged 65 and over by sex, 2007–08 to 2017–18
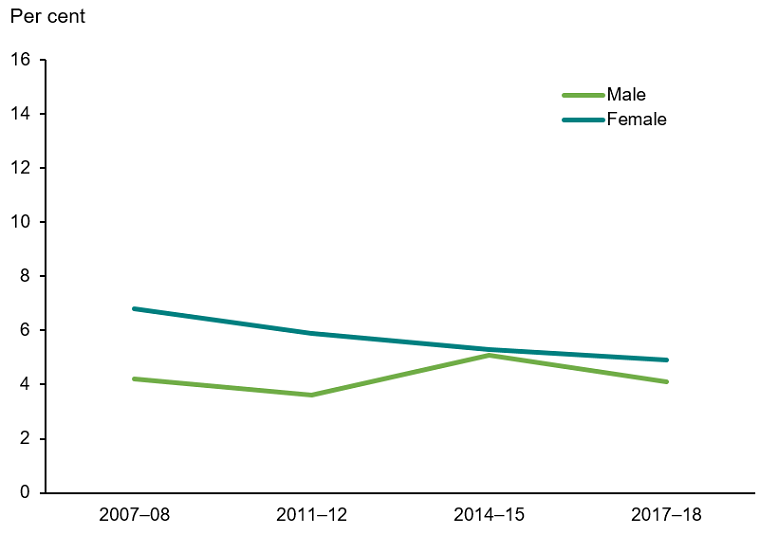
Source: AIHW analysis of ABS 2009, ABS 2013, ABS 2016, ABS 2019a (Table 1.5).
Glaucoma
In glaucoma, high pressure inside the eye damages the optic nerve. The optic nerve transmits signals from the eye to brain (Glaucoma Australia 2020a). Glaucoma can occur at any stage of life, though risk increases above age 50 (Glaucoma Australia 2020b). Left unmanaged, it can lead to vision loss and blindness (Glaucoma Australia 2020a). However, early detection and treatment often prevents or halts this.
Among Australians aged 65 and over, prevalence has remained stable in both males (from 5.2% to 3.5%) and females (from 5.0% to 3.8%) between 2007–08 and 2017–18 (Figure 6).
Figure 6: Prevalence of glaucoma in people aged 65 and over by sex, 2007–08 to 2017–18
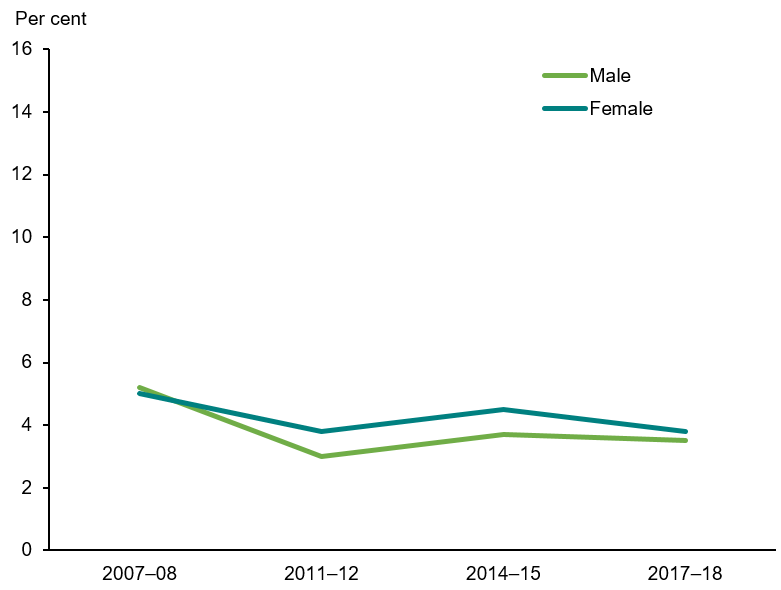
Source: ABS 2009, ABS 2013, ABS 2016, ABS 2019a (Table 1.6).
Diabetic retinopathy
Diabetes is a chronic disease characterised by high levels of blood glucose, caused by an inability to produce or effectively use insulin, a hormone for blood glucose control. In 2017–18, about 1.2 million (6.2%) Australian adults aged 18 and over had diabetes (ABS 2018).
Diabetic retinopathy causes small blood vessels in the eye to leak and bleed. By the twentieth year after a diabetes diagnosis, the disease affects almost everybody with Type 1 diabetes and more than 60% of people with Type 2 diabetes (Lee et al. 2015). Left untreated, the condition can cause blindness. However, most cases can be successfully managed with laser therapy. See Treatment and Management.
In the 2016 National Eye Health Survey, 53% of Indigenous Australians (aged 40 and over) and 78% of non-Indigenous Australians (aged 50 and over) with self-reported diabetes reported having a diabetes eye examination within the last year and last two years respectively, the period recommended in the National Health and Medical Research Council Guidelines (Foreman et al. 2016).
Low vision and blindness
Based on results from the National Health Survey (NHS) conducted by the ABS, the prevalence of self-reported total or partial blindness in one or both eyes in Australia remained stable between 0.6%–0.7% in males and 0.4–0.6% in females from 2007–08 to 2017–18 (Figure 7). Although permanent vision loss or blindness impair an individual’s ability to read, move around in the world and other common tasks, services are available to support patients and help them maintain their usual activities of daily living where possible. See Treatment and Management.
Figure 7: Prevalence of total or partial blindness in one or both eyes by sex, from 2007–08 to 2017–18
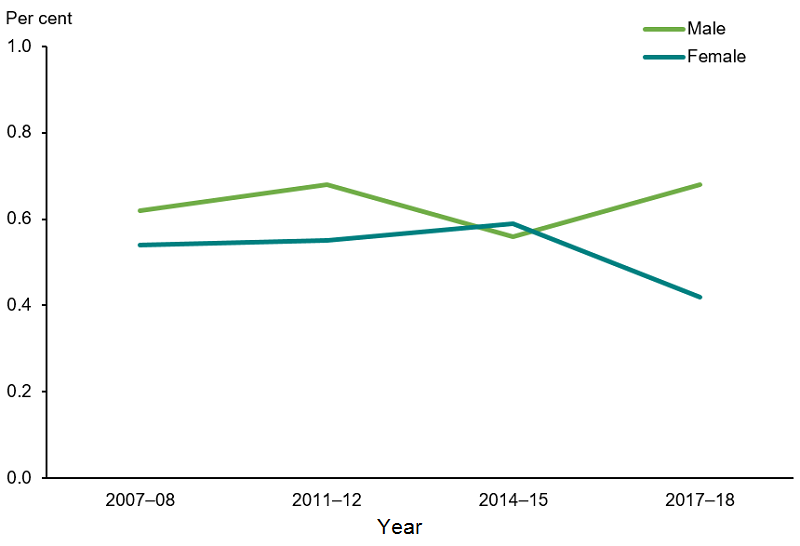
Note: Blindness is a rare condition, rates have not been age-standardised.
Source: ABS 2009, ABS 2013, ABS 2016, ABS 2019a (Table 1.7).
Paediatric eye disease
Vision disorders affect people of all ages, including children. Based on results from the National Health Survey (NHS), the self-reported prevalence of chronic eye conditions in children aged 0–14 in Australia increased from 2007–08 (9.2%) to 2017–18 (12%) (Figure 8).
Figure 8: Prevalence of chronic eye conditions(a) in children aged 0–14, from 2007–08 to 2017–18
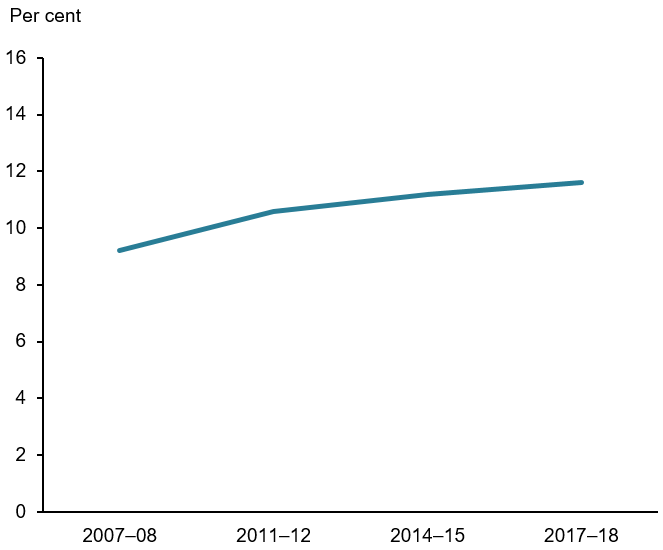
(a) Includes hyperopia, myopia, astigmatism, presbyopia, other disorders of ocular muscles, cataract, other disorders of the choroid and retina, glaucoma, partial and complete blindness in one or both eyes, other visual disturbances or loss of vision, other diseases of eye and ocular adnexa.
Source: ABS 2009, ABS 2013, ABS 2016, ABS 2019a (Table 1.8).
Reported prevalence of refractive error increased from 7.7% in 2007–08 to 9.6% in 2017–18 among children aged 0–14 (Figure 9). Refractive error accounts for the majority of chronic paediatric eye conditions. Globally, the increasing prevalence of myopia in children—as high as 60–90% in some Asian countries—concerns health experts, as the condition increases the risk of sight-threatening eye diseases in adulthood, and often progresses with time (Dolgin 2015, Holden et al. 2015, Theophanous et al. 2018). However, according to the NHS results, prevalence of myopia among children aged 0–14 has remained steady at about 4.5% in Australia (Figure 9).
Figure 9: Prevalence of refractive error in children aged 0–14, 2007–08 to 2017–18
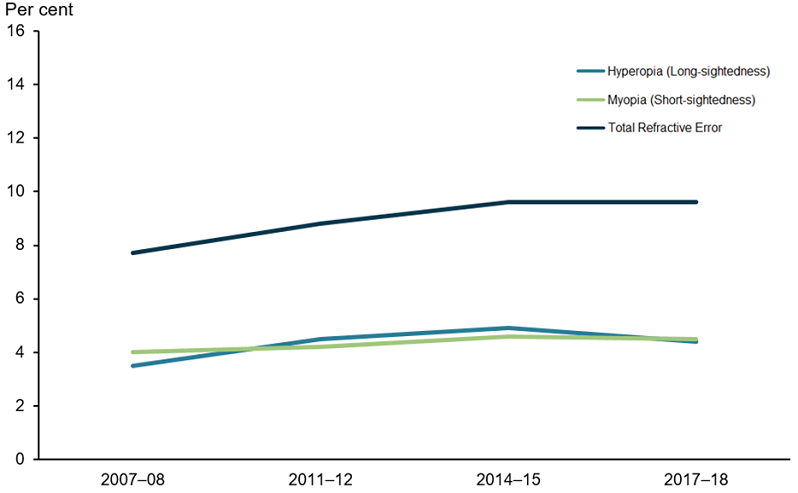
Source: ABS 2009, ABS 2013, ABS 2016, ABS 2019a (Table 1.9).
Aboriginal and Torres Strait Islander people
According to self-reported data from the ABS 2018–19 National Aboriginal and Torres Strait Islander Health Survey (NATSIHS), the prevalence of self-reported eye or sight problems among Aboriginal and Torres Strait Islander people was 38%, affecting about 307,000 people—including about 44,100 who live in Remote areas (30% of the remote Indigenous population).
After adjusting for age, females (54%) had higher rates of self-reported eye or sight problems than males (45%). The proportion of Indigenous Australians (49%) and non-Indigenous Australians (52%) with eye or sight problems was similar, after adjusting for age (Figure 10).
According to the National Eye Health Survey (NEHS), an estimated 15,000 Aboriginal and Torres Strait Islander people aged 40 and over experienced vision impairment and blindness in 2016. The leading causes of vision impairment were uncorrected refractive error (61%), cataract (20%) and diabetic retinopathy (5.2%) (AIHW 2020, Foreman et al. 2017).
Figure 10: Prevalence of self-reported chronic eye conditions(a) by Indigenous status, 2017–18 and 2018–19
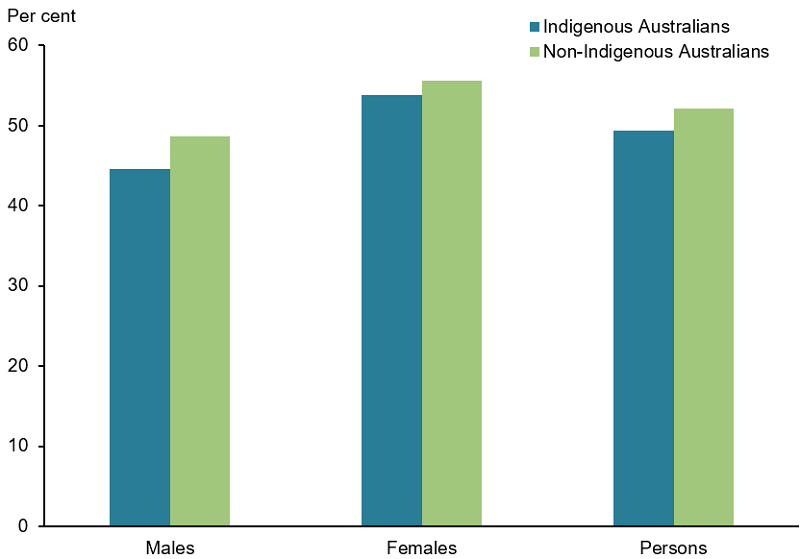
(a) Includes cataract, glaucoma, disorders of the choroid and retina, disorders of the ocular muscles, binocular movement, accommodation and refraction, visual disturbances and blindness, and other diseases of the eye and adnexa.
Note: Age-standardised to the 2001 Australian standard population.
Source: ABS 2019b (Table 1.10).
In addition to the aforementioned conditions, trachoma – an infectious eye disease that is easily prevented but can lead to blindness if left untreated—is still present in many Indigenous communities in remote Australia (DOH 2014). Australia remains the only high-income country in the world where the disease is still commonly found (Kirby Institute 2017). However, health promotion programs focusing on good face hygiene, which helps prevent spread of the disease, have been in place over the last 15 years and screening outcomes have shown optimistic trends (Razavi et al. 2018). Prevalence of active trachoma among those aged 5 to 9 years in at-risk communities has declined from 15% in 2009 to 4.5% in 2019 (AIHW 2020).
For more information, see Indigenous eye health measures 2020.