Poor diet in adults
The five food groups
The last comprehensive survey of diet in adults occurred in the Australian Health Survey (ABS 2014) using 24 hour dietary recall. On average in 2011–12, both men and women of all ages;
- Vegetables: did not meet the recommendations
- Fruit: did not meet the recommendations
- Grains: did not met the recommendations, except women aged 71 and over who on average did meet the guidelines
- Lean meats and alternatives: did not meet the recommendations
- Dairy products and alternatives: did not meet the recommendations
For the full results of adult’s nutrition, see Nutrition across the life stages
Fruit and vegetables
Based on self-reported data from the Australian Bureau of Statistics (ABS) 2017–18 National Health Survey (NHS), 1 in 2 people aged 18 and over (49%) did not eat the recommended 2 serves of fruit, while over 9 in 10 (92%) did not eat the recommended 5–6 serves of vegetables (ABS 2018).
The proportion of adults with inadequate vegetable intake was similar across age groups (Figure 1). Fruit intake was worse among young people: more than half (54%) of those aged 18–24 had inadequate fruit intake, compared to one-third (36%) of people aged 75 and over.
Figure 1: Prevalence of inadequate fruit and vegetable intake for persons aged 18 and over, 2017–18
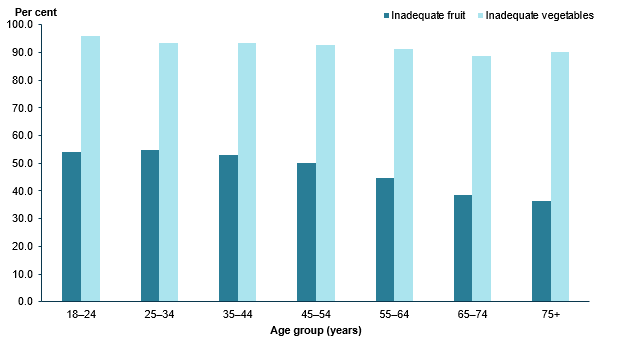
Source: ABS 2018; (see Table S1 for footnotes).
Trends in fruit and vegetable consumption
Fruit and vegetable consumption is also able to be measured over time. Between 2007–08 and 2017–18, the proportion of the population not meeting the fruit and vegetable guidelines remained about the same, approximately 49–52% of people do not meet the fruit guidelines, and approximately 93–94% do not meet the vegetable guidelines (Figure 2).
Figure 2: Trend in the prevalence of inadequate fruit and vegetable intake for persons aged 18 and over, 2007–08 to 2017–18
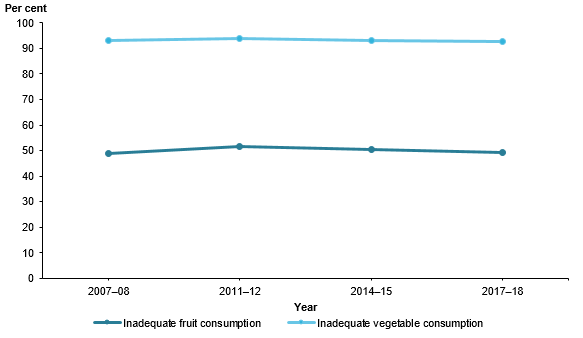
Note: Rates are aged-standardised to the 2001 Australian standard population.
Source: ABS 2018; AIHW analysis of ABS 2019; (see Table S1 for footnotes).
Population groups
In 2017–18, Australians aged 18 or over in the lowest socioeconomic areas were less likely to meet the fruit and vegetable guidelines than those in the highest socioeconomic group, although the differences were not large.
- For fruit, 46% did not eat enough in the highest socioeconomic areas compared with 53% in the lowest.
- For vegetables 92% did not eat enough in the highest socioeconomic areas compared with 94% in the lowest (ABS 2019; Table S1).
In 2017–18, people living in Outer regional and remote areas were more likely to have inadequate fruit consumption than those living in Major cities (53% compared with 48%). There was no difference by remoteness area for inadequate vegetable consumption. (ABS 2019; Table S1).
Discretionary foods
Discretionary foods are foods that are not needed to meet nutrient requirements and generally tend to be high in kilojoules, saturated fat, added sugars, added salt and alcohol (NHMRC 2013). The Australian Dietary Guidelines recommend that discretionary foods should be consumed occasionally and in small amounts, and for most people 0 to 3 serves a day is suitable depending on age, height and activity level (See the Eat for Health website).
Among adults in 2011–12, the proportion of daily energy intake from discretionary foods ranged from 33% to 36%—between 5 to 7 serves per day on average. For men and women across all age groups, discretionary food intake was high and contributed a similar proportion towards daily energy intake (around one third of total energy intake) (AIHW 2018).
High intake of discretionary foods is at the expense of more nutritious foods from the 5 food groups and may contribute to Australians exceeding the recommended intakes of saturated fats, sugars and sodium.
For more information see Nutrition across the life stages.
Sugar sweetened drinks
The Australian Dietary Guidelines recommend to limit intakes of drinks high in added sugars, as they can provide excess kilojoules with little nutritional value and can increase the risk of excessive weight gain (NHMRC 2013). In 2017–18:
- 9.1% of adults aged 18 and over consumed sugar sweetened drinks daily.
- A greater proportion of men consumed sugar sweetened drinks daily than women—12% compared with 6.4%
- 18-24 year olds had the highest daily consumption —16% of men and 10% of women.
- Women were more likely than men to report not consuming any sugar sweetened drinks—72% compared with 56%
- Overall, sugar sweetened drinks consumption decreased as age increased (Figure 3).
Figure 3: Prevalence of sugar sweetened drink consumption for persons aged 18 and over, 201718
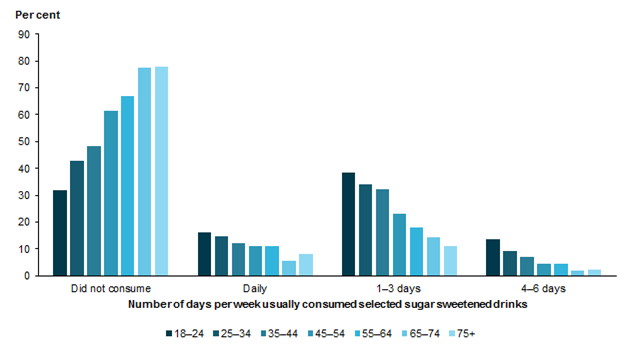
Note:
Sugar sweetened drinks includes soft drink, cordials, sports drinks or caffeinated energy drinks and may include soft drinks in ready to drink alcoholic beverages. Fruit juice, flavoured milk, ‘sugar free’ drinks or coffee/hot tea are excluded.
Source: ABS 2018; (see Table S3 for footnotes).
References
ABS (Australian Bureau of Statistics) 2014. Australian Health Survey: Nutrition First Results—Foods and Nutrients, 2011–12, ABS cat. no. 4364.0.55.007, Canberra: Australian Bureau of Statistics.
ABS 2018. National Health Survey: First Results, 2017–18. ABS cat. no. 4364.0.55.001. Canberra: Australian Bureau of Statistics.
ABS 2019. Microdata: National Health Survey 2017–18. ABS cat. no. 4324.0.55.001. Canberra: Australian Bureau of Statistics.
AIHW 2018. Nutrition across the life stages. Cat. no. PHE 227. Canberra: AIHW.
NHMRC 2013. Australian Dietary Guidelines, Canberra: National Health and Medical Research Council.