Housing in Australia
Housing plays a major role in the health and wellbeing of Australians, by providing shelter, safety, security and privacy. The availability of affordable, sustainable and appropriate housing enables people to participate in the social, economic and community aspects of their lives.
Australia’s growing and ageing population, government policy and a range of other factors have an impact on supply, demand and cost of housing. The absence of affordable, secure and appropriate housing can have a number of negative consequences, including homelessness, poor health and lower rates of employment and education. Housing, therefore, plays a major role in the living standards of Australians.
The main sources of Australian home ownership data include the Census of population and housing, the Survey of Income and Housing (SIH), and the Household, Income and Labour Dynamics in Australia (HILDA) Survey.
The latest Australian Bureau of Statistics (ABS) data from the SIH show that in 2015–16, 67.5% of Australian households owned their own home (37.1% with a mortgage, and 30.4% without a mortgage). A further 30.3% were renting, either privately (25.3%) or through social housing programs (3.5%). The proportion of total renters also includes ‘other landlord types’ [1].
Over the last 20 or so years Australia has seen a shift from outright ownership to owning with a mortgage, and a shift from overall home ownership to private rental (SIH data: Figure 1.1). Between 1994–95 and 2015–16, the proportion of outright owner-occupied households fell from 41.8% to 30.4%. Comparatively, the proportion of households owning with a mortgage has increased, from 29.6% to 37.1%, over the same period. Overall, the proportion of households in home ownership fell from 71.4% to 67.5%. There has also been an increase in the proportion of households renting privately (from 18.4% to 25.3%), and a decline in the proportion of households renting through state and territory housing programs (from 5.5% to 3.5%).
Figure 1.1: Housing tenure in Australia (per cent), by tenure type, 1994–95 to 2015–16
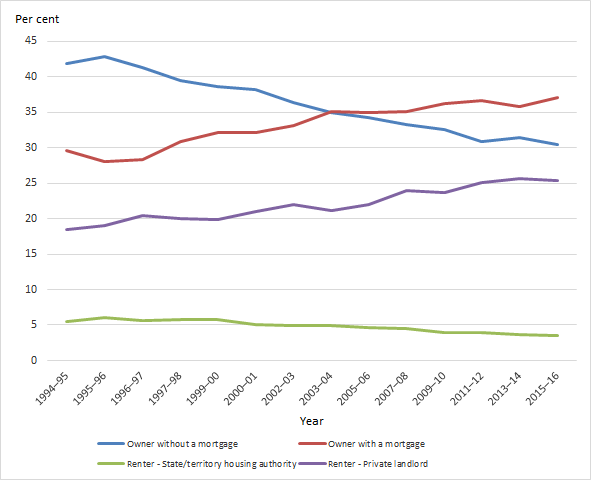
Source: [1].
Research has shown that Australia is experiencing generational change when it comes to home ownership, with younger households being affected by factors such as economic constraints, lifestyle choices and work–home preferences; therefore limiting their ability to become home owners [6,13].
Home ownership data from the latest Census, 2016, report a national aggregate home ownership rate of 67%, down from 68% in 2011 (count of occupied private dwellings by nature of occupancy/tenure type; not stated have been excluded). While this aggregate home ownership rate has remained relatively steady at around 67–70% since the mid-1960s, the rate of home ownership for different age groups have varied markedly.
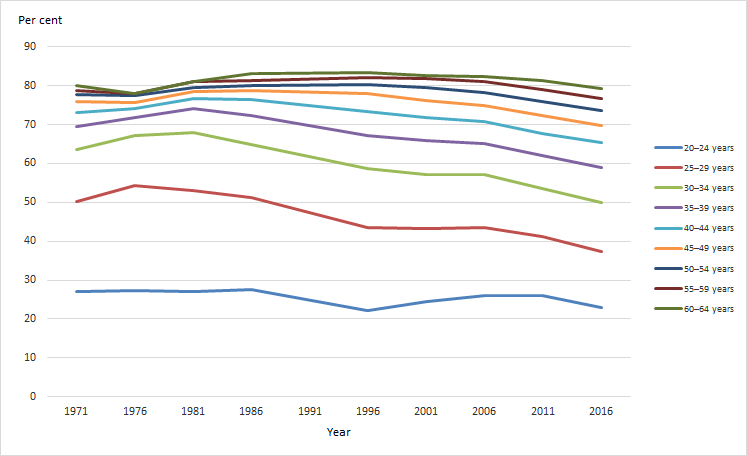
Figure 1.2 displays home ownership rates reported in Censuses in Australia between 1971 and 2016, by selected 5-year age groups. The home ownership rate of 30–34 year olds was 64%, and 50% for 25–29 year olds, in 1971. Forty-five years later these rates have decreased notably, with the home ownership rate of 30–34 year olds falling 14 percentage points to 50%. Similarly, that of 25–29 year olds fell 13 percentage points (to 37%). While declines are evident for other age groups they are much less marked.
Fewer Australians are tending to own their home at retirement. For Australians nearing retirement, for example, age groups 50–54, 55–59, and 60–64, home ownership rates peaked in 1996 at 80%, 82% and 83%, respectively (Figure 1.2). Since 1996 however, there has been a gradual decline in home ownership rates, most notably in the 50–54 age group which has seen a 6.6 percentage point fall over these 20 years (from 80.3% to 73.7%).
Figure 1.2: Home ownership (aggregate) rates, by selected age groups, Census years 1971 to 2016
Notes
- Data exclude ‘not stated’.
- ‘Not stated’ could not be extracted for Census data in 1991, and therefore are not reported here. Linear interpolation has been used to account for the missing data from 1991.
Source: ABS Census data, 1971 to 2016, AIHW customised data report.
Global comparison in home ownership
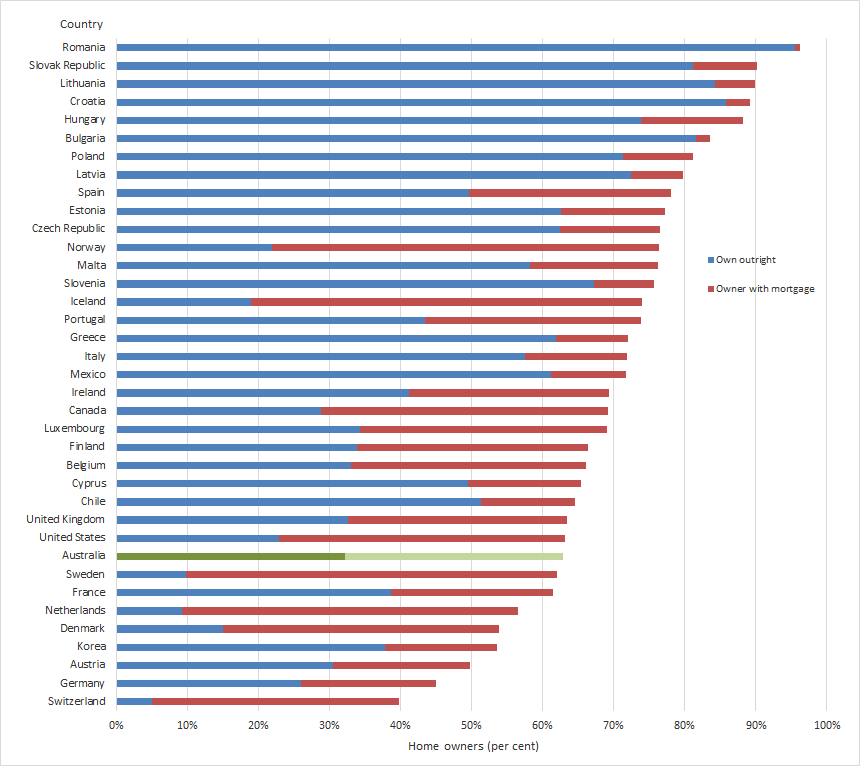
Despite changes in housing tenure over time, home ownership is still the most common tenure type in Australia, as it is in many other Organisation for Economic Co-operation and Development (OECD) countries and European Union (EU) member states [9] (Figure 1.3).
In the OECD countries and EU member states, except for Switzerland and Germany, owner households (outright or with a mortgage) are more common than rental households (private market or subsidised). Notably, former communist countries of Central and Eastern Europe have a very high share of home-owners without a mortgage, because after the fall of the communist regimes tenants were offered the opportunity to buy the dwellings in which they lived at a low price [9].
There is considerable variation in home ownership rates across OECD countries and EU member states. Factors such as differing access to finances, mortgage market deregulation, and bank lending policies contribute to this variation. While Australia ranks in the lowest quarter in terms of aggregate home ownership rates (twenty-ninth out of thirty-seven countries), it ranks in the top third for home owners with a mortgage (twelfth) (Figure 1.3). It is similar to the United Kingdom and Portugal at around 30%. In addition, Iceland ranks highly for the proportion of home owners with a mortgage (55%), but is one of the lowest for outright home ownership (19%). Conversely, Romania ranks the highest in the proportion of outright home owners (96%), and lowest for home owners with a mortgage (1%).
Figure 1.3: Home ownership distribution in OECD countries and European Union member states (per cent), 2014 or most recent year
Notes
- Year of collection and method of collection varies across countries and may affect comparisons. Data for Australia are sourced from the Household, Income and Labour Dynamics Survey 2014.
- Percentage of renter (private and subsidised) and ‘Other, unknown’ not shown.
- OECD countries and European Union member states are displayed from collated data in the Affordable Housing Database.
Source: [9].
Housing affordability
The term ‘housing affordability’ usually refers to the relationship between expenditure on housing (prices, mortgage payments or rents) and household incomes. The concept of housing affordability means different things to different people and households, depending on the housing situation. Affordability for home owners relates to purchase and repayment expenses; for renters, it relates to rental expenses [5].
Generally, measurements of housing affordability focus on quantifying housing stress as a proxy for all housing affordability driven outcomes [7, 10]. Based on the OECD’s price to income ratio index, housing affordability in Australia has broadly declined since the early 1980s, and the demand for sustainable, affordable housing continues to grow [11]. This demand puts pressure on dwelling prices, with a particularly adverse effect for low-income households. A number of factors influence house prices, such as interest rates, population growth, availability and release of land, and building approvals; therefore affecting housing affordability.
House prices in Australia have increased substantially in recent decades. However, as shown in Figure 1.4, house price growth has not been uniform across Australian cities. For example, Sydney prices have seen the steepest rises, particularly in the past 5 years, and are the most expensive. In contrast, Hobart has the lowest median house price, currently less than half that of Sydney.
Figure 1.4: Median price of established house transfers, by capital city, March 2002 to December 2017
Data visualisation showing median price of established house transfers, by capital city, March 2002 to December 2017
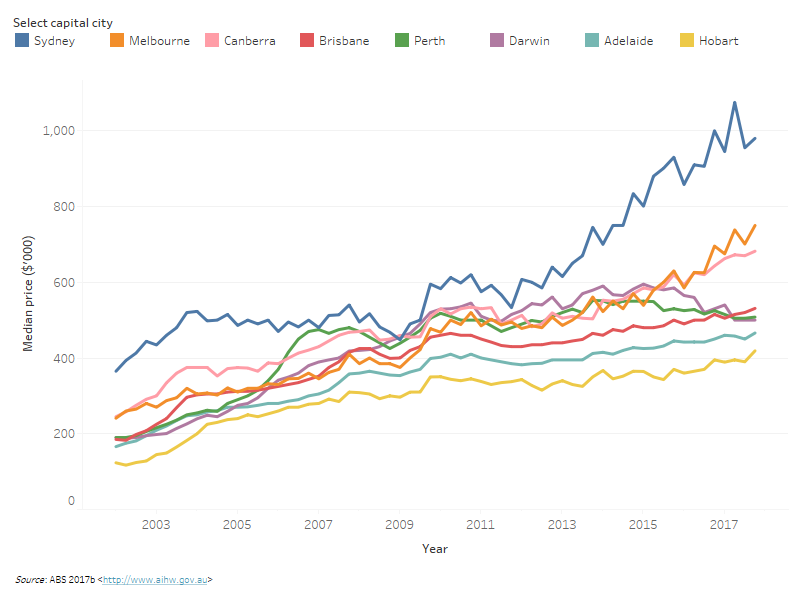
Source: ABS 2017b [2].
Social share
In recent years across Australia, the stock of social housing, which includes both public rental housing and community housing, has not kept pace with growth in either the overall national dwelling stock or the number of households.
The share of all dwellings in Australia accounted for by public rental housing (this does not include community housing) rose from 1981 to 1996 but has fallen since 1996. Census data for 1981 and 1996 show that Australia had a rise in public rental stock, by almost 100,000 additional dwellings, or 43% over this period. This was a faster growth rate than the total national dwelling stock (an increase from 4.6 to 6.3 million dwellings, or 34%), meaning that public housing stock increased from 4.9% to 5.2% of total dwellings over this period. By contrast, from 1996 to 2011 Australia saw a decline in the share accounted for by public rental housing, declining to 4.1% of the national dwelling stock.
Social housing, which includes both public rental housing and community housing, has been growing in recent years. However, despite the policy shift towards growing the community housing sector over this time, the proportion of the national dwelling stock accounted for by social housing (that is, rental housing administered through either a state or territory housing authority, or housing co-operative; community or church group) has declined from 5.1% in 2001 to 4.8% of the national dwelling stock in 2011 [8, 6]. Estimates from the latest Census show this contracting trend continuing with social housing supply relative to its share of tenure in Australia falling to 4.2% of the national dwelling stock in 2016 (AIHW analysis of Census data).
While the number of households in Australia continues to grow, the number of social housing dwellings has failed to keep pace. The National Housing Assistance Data Repository (AIHW) collates annual state and territory data on households in the four main social housing programs (public rental housing, mainstream community housing, state owned and managed Indigenous housing, and Indigenous community housing). While the total number of social housing dwellings provided through these programs has increased each year (see table DWELLINGS.1), the rate of growth has not kept up with household growth. The number of social housing dwellings per 100 Australian households has declined from 5.1 per 100 households in 2007–08 to 4.6 in 2016–17 (Figure 1.5). Factors influencing this trend include a decreasing number of new housing allocations (see Priority groups and waitlists), increasing tenure length in public housing (see Social housing tenants), and underlying changes in the housing programs contributing to the social housing stock; a decreasing public rental housing stock, and a growing community housing stock (see Social housing dwellings).
Figure 1.5: Social share, as social housing dwellings per 100 households in Australia, 2007–08 to 2016–17
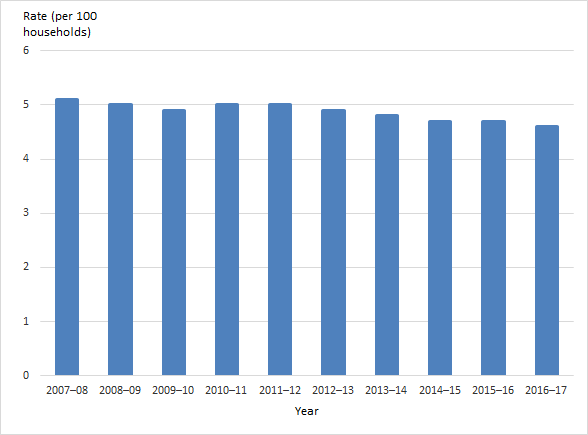
Sources: AIHW analysis of AIHW National Housing Assistance Data Repository 2016–17, ABS Household and Family Projections, Australia, 2011–2036.
Location of social housing dwellings
At the 2016 Census, over 8 million Australian dwellings were privately occupied and of these, an estimated 1 in 25 (4.2% or 351,000 dwellings) were social housing dwellings (Census social housing dwellings include those provided by a state or territory housing authority and a housing co-operative, community or church group).
The distribution of Australian housing accords with the location of the Australian population, with 7 in 10 dwellings (71%) located in Major cities and fewer than 1 in 100 (0.6%) in Very remote areas (AIHW analysis of Census data). Statistical area level 3 (SA3) boundaries combine areas with similar regional characteristics and can range in size and population from as low as 30,000 up to 130,000 persons [3]. Major population centres in Australia are typically located along the coast, particularly on the east coast of Australia and consequently have relatively smaller SA3 areas. The number of occupied dwellings decreases with increasing distance from major cities while the relative SA3 size increases.
Social housing providers have differing target groups, reflected in the different locations of the dwelling stock they manage (see also Social housing dwellings). High rates of social housing dwellings are located in both remote Australia and within more densely populated cities.
The Australian outback makes up 5.6 million square kilometres (73%) of Australia’s land mass and is characterised by relatively vast natural environments and low population densities [12]. Of the existing dwellings in these sparsely populated areas, social housing makes up a notably high proportion of the housing stock with the highest rates recorded in the Northern Territory. For example, in East Arnhem, over 2 in 5 dwellings were social housing dwellings (44% or 1,111 of 2,513 dwellings). However, at a national level, less than 10% of Australia’s social housing stock falls in Very Remote and Remote Australia (6% or 22,000 dwellings) with the majority of social housing dwellings located in Major cities (69% or 241,000 dwellings).
Census data include information on the type of social housing provider, that is, state and territory governments and the community sector. As reported in the 2016 Census, social housing dwelling stock across Australia was mainly provided by state and territory governments (85% or 300,000 dwellings) compared to the community sector (15% or 51,000 dwellings).
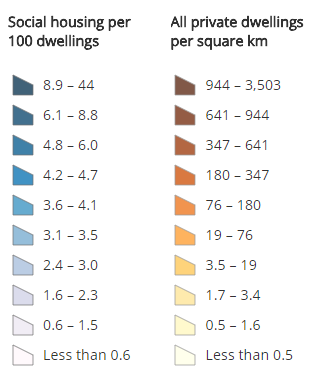
Figure 1.6: Social housing dwellings (per 100 occupied private dwellings), SA3, 2016
Notes
- Dwelling counts exclude dwellings containing ‘Visitor only’ and ‘Other non-classifiable’ households.
- Social housing includes dwellings provided by a “state or territory housing authority” (public housing) and a “housing co-operative, community or church group” (community housing).
- Counts have been randomly adjusted to avoid release of confidential data. No reliance should be placed on small numbers.
- Social housing rate calculated as the rate of all occupied private dwellings within respective SA3 (excluding 'Visitors only' and 'Other non-classifiable' households).
- Large areas with small dwelling counts will report a false zero dwellings/square kilometre rate due to rounding. Dwelling counts have been provided to assist with interpreting rates.
Source: AIHW analysis of ABS 2016 Census of Population and Housing [4].
Housing assistance
The Australian governments and community-based organisations assist households finding it difficult to meet housing costs. Assistance is provided through a range of programs, collectively referred to as housing assistance. Housing assistance can encompass:
- provision of housing (social housing), with rents based on tenant income,
- assistance with rent in the private rental market,
- home purchase assistance, or
- provision of services to assist in obtaining accommodation or sustaining tenancies.
Housing assistance is important for many Australians who, for a variety of reasons, experience difficulty in securing or sustaining affordable and appropriate housing in the private market.
The following sections in this web report present information on housing assistance available in each segment of the assisted housing sector: government, not-for-profit and the private rental sectors.
References
- ABS (Australian Bureau of Statistics) 2017a. Housing Occupancy and Costs, Australia, 2015–16. ABS cat. No. 4130.0, Canberra: ABS.
- ABS 2017b. Residential property price indexes: eight capital cities, Sept. 2017. ABS cat. no. 6416.0. Canberra: ABS.
- ABS 2016. Australian Statistical Geography Standard (ASGS): Volume 1 – Main Structure and Greater Capital City Statistical Areas, July 2016. ABS cat no.1270.0, Canberra: ABS.
- ABS 2016b. 2016 Census of Population and Housing, TableBuilder Pro. Findings based on use of ABS TableBuilder Pro data.
- AIHW (Australian Institute of Health and Welfare) 2017. Australia's welfare 2017. Australia’s welfare series no. 13. AUS 214. Canberra: AIHW.
- Burke T, Stone W & Ralston L 2014. Generational change in home purchase opportunity in Australia. Melbourne: AHURI.
- Gabriel M, Jacobs K, Arthurson K, Burke T & Yates J 2005. Conceptualising and measuring the housing affordability problem. National Research Venture 3: housing affordability for lower income Australians. Research paper 1. Melbourne: AHURI.
- Groenhart, L. and Burke, T. 2014. Thirty years of public housing supply and consumption: 1981–201, AHURI Final Report No.231. Melbourne: Australian Housing and urban Research Institute.
- OECD (Organisation for Economic Co-operation and Development) 2017. Affordability Housing Database. Paris: OECD Publishing.
- Rowley S & Ong R 2012. Housing affordability, housing stress and household wellbeing in Australia. AHURI final report no. 192. Melbourne: AHURI.
- Thomas M. 2015. Housing affordability in Australia. Canberra: Parliament of Australia.
- Woinarski, John and Booth, Carol. The Australian outback: Icon, opportunity and obligation [online]. Wildlife Australia, Vol. 52, No. 1, Autumn 2015: 26-31.
- Yates, J. 2011. Explaining Australia’s trends in home ownership. Housing Finance International, Winter 2011:6–13.