Social housing dwellings
Key findings
- As at 30 June 2015, there were 427,800 social housing dwellings across Australia.
- Public rental housing stock decreased by approximately 4% between 2008–09, while mainstream community housing stock increased by 76% over the same period.
- New South Wales has the largest number of social housing dwellings (147,947 or 35%) of social housing.
Social housing is rental housing that government or non-government organisations (including not-for-profit organisations) provide to assist people who are unable to access affordable and sustainable housing. Social housing aims to deliver appropriate, flexible and diverse housing, targeted to assist low income and disadvantaged households, usually with rents based on income at below market rates. There are four social housing programs in Australia:
- public rental housing,
- mainstream community housing,
- state owned and managed Indigenous housing (SOMIH), and
- Indigenous community housing.
For more information about social housing programs, see Glossary.
Number of dwellings?
In 2014–15, there were 427,800 social housing dwellings across Australia—very similar number to the previous 12 months (427,600), and an increase of 3% from the 415,100 dwellings in 2008–2009.
There has been a gradual but steady policy focus towards growing the community housing sector and transferring ownership or management of public rental housing stock to community housing organisations. This is a result of the rising cost of social housing programs that are managed and run by state housing authorities, and the ability of community organisations to be flexible in their delivery of social housing.
Between 2008–09 and 2014–15, public rental housing stock reduced by approximately 5% (336,500 to 321,600 dwellings) (Figure SHD.1), and mainstream community housing increased by 76%, from 41,700 to 73,600 dwellings (Figure SHD.2).
Figure SHD.1: Number of social housing dwellings by program type, 2008–2015
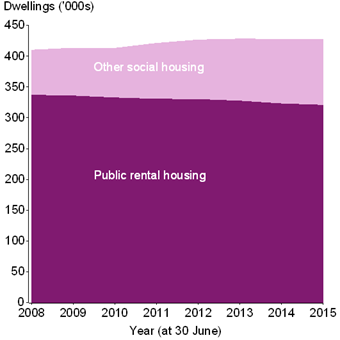
Note: ‘Other social housing’ includes mainstream community housing, SOMIH, Indigenous community housing and NT remote community housing.
Source: AIHW National Housing Assistance Data Repository 2014–15. Source data.
SOMIH stock reduced between 2008–09 and 2014–15 by 17%—from 12,100 to 10,000 dwellings. Indigenous community housing dwelling numbers also decreased by 13% over the same period—from 20,200 to 17,500 dwellings (Figure SHD.2).
Figure SHD.2: Number of social housing dwellings by program type (excluding public rental housing), 2008–2015
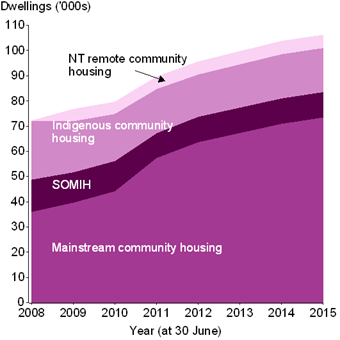
Source: AIHW National Housing Assistance Data Repository 2014–15. Source data.
The overall occupancy rate for social housing are very high across Australia. As at 30 June 2015, occupancy rates for public housing dwellings was 98%, ranging from 95% in the Northern Territory to 99% in New South Wales. Overall, SOMIH dwelling occupancy rates were 97%, and for community housing dwellings, 94%. The overall occupancy rate for Indigenous community housing dwellings was 93%.
Location
As at 30 June 2015, New South Wales had the largest number of social housing dwellings across each program type, except for Indigenous community housing, which had more dwellings reported in Queensland. Victoria had the next highest number of dwellings for public housing and community housing.
| Social housing program | NSW | Vic | Qld | WA | SA | Tas | ACT | NT | Aust |
|---|---|---|---|---|---|---|---|---|---|
| Number of dwellings | |||||||||
| Public housing | 110,214 | 64,404 | 51,248 | 33,361 | 39,428 | 7,234 | 10,833 | 4,905 | 321,627 |
| SOMIH(a) | 4,641 | . . | 3,355 | . . | 1,817 | 222 | . . | . . | 10,035 |
| Mainstream community housing(b) | 28,214 | 13,943 | 11,580 | 6,776 | 5,941 | 6,202 | 663 | 301 | 73,620 |
| Indigenous community housing(b,c,d) | 4,878 | 1,964 | 5,000 | 2,575 | 1,116 | 75 | . . | 1,858 | 17,466 |
| Total | 147,947 | 80,311 | 71,183 | 42,712 | 48,302 | 13,733 | 11,496 | 7,064(e) | 422,748(e) |
| Dwellings (%) | |||||||||
| Public housing | 74.5 | 80.2 | 72.0 | 78.1 | 81.6 | 52.7 | 94.2 | 69.4 | 76.1 |
| SOMIH(a) | 3.1 | . . | 4.7 | . . | 3.8 | 1.6 | . . | . . | 2.4 |
| Mainstream community housing(b) | 19.1 | 17.4 | 16.3 | 15.9 | 12.3 | 45.2 | 5.8 | 4.3 | 17.4 |
| Indigenous community housing(b,c,d) | 3.3 | 2.4 | 7.0 | 6.0 | 2.3 | 0.5 | . . | 26.3 | 4.1 |
| Total | 100.0 | 100.0 | 100.0 | 100.0 | 100.0 | 100.0 | 100.0 | 100.0 | 100.0 |
- Victoria, Western Australia, the Australian Capital Territory and the Northern Territory do not have SOMIH programs.
- Community housing data are incomplete due to non-reporting or under-reporting by community housing providers, Data may not be comparable across jurisdictions due to differences in the accuracy of the data (e.g., reflecting differences in how the data for the collection was sourced by jurisdictions, the number and profiles of providers for which data were provided/not provided, the completeness of the data reported for some providers and the instances of unknown values recorded for some data items). Note, the total number of tenancy (rental) units is counted for mainstream community housing instead of actual dwellings because some dwellings such as group houses have multiple rental spaces within the one overall dwelling.
- NSW Indigenous community housing data includes permanent dwellings managed by funded and unfunded providers. Vic, Qld, WA, SA, Tas and NT Indigenous community housing data relates to dwellings managed by funded providers only.
- ACT has advised that it does not have any providers in-scope for the Indigenous community housing collection.
- The figures for Australia and NT do not include remote community housing dwellings in the Northern Territory (5,025). Remote community housing dwelling counts are provided separately, as they are not currently captured by the Indigenous community housing or Public housing data collections.
Source: AIHW National Housing Assistance Data Repository 2014–15.
Proportions of social housing dwellings varied across remoteness areas. Public rental housing and mainstream community housing represented the highest proportion of social housing in Major cities, SOMIH in Outer regional areas, and Indigenous community housing in Remote and Very Remote areas (Figure SHD.3).
As at 30 June 2015, almost 3 in 4 public rental housing dwellings were located in Major cities (74%) and a further 15% in Inner regional areas. Less than 1% of public rental housing was located in Very remote areas. Just over one-third of SOMIH dwellings were located in Major cities (36%), 25% in Outer regional locations and 24% in Inner regional areas.
Mainstream community housing followed a similar trend, with almost two-thirds (64%) of dwellings located in Major cities, with an additional 24% located in Inner regional areas. Less than 1% of mainstream community housing dwellings were located in Very Remote areas.
As expected, a large proportion (59%) of Indigenous community housing was located in Remote or Very Remote areas.
Figure SHD.3: Proportion of social housing dwellings by remoteness area and housing program type, 2015 (per cent)
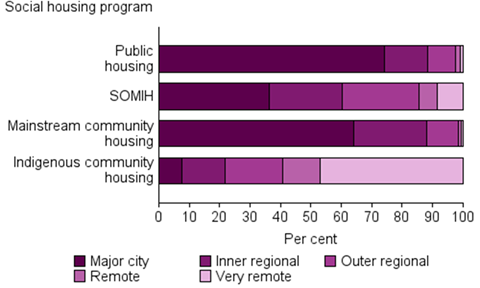
Source: AIHW National Housing Assistance Data Repository 2014–15. Source data.
Dwelling type
As at 30 June 2015, public rental housing dwellings were more likely to be in the form of a separate house (39%), followed by a flat, unit or apartment (34%).
The vast majority of SOMIH dwellings were in the form of a separate house (82%), with a further 15% being a semi-detached house or townhouse.
Mainstream community housing dwellings were more likely to be a flat, unit or apartment (48%), followed by a separate house (32%) (Figure SHD.4).
Figure SHD.4: Proportion of social housing dwellings by dwelling type and housing program type, 2015 (per cent)
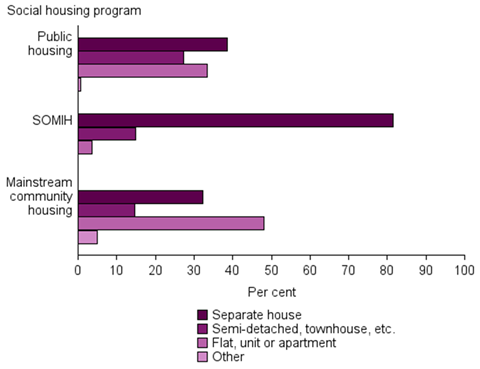
Source: AIHW National Housing Assistance Data Repository 2014–15. Source data.
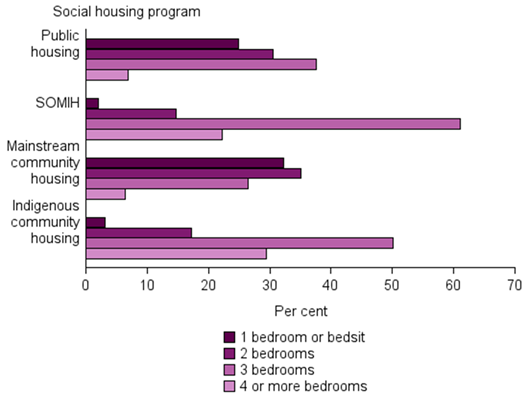
Dwelling size
The size of social housing dwellings in 2015 differed across program type. Public rental housing dwellings were most likely to be three bedroom dwellings (38%), followed by two bedroom dwellings (31%).
SOMIH dwellings were also most likely to be three bedroom dwellings (61%), followed by four bedroom dwellings (19%).
In contrast, mainstream community housing dwellings were more likely to be one and two bedroom dwellings (32% and 35%, respectively), with a further 27% being three bedroom dwellings.
Half of Indigenous community housing dwellings were three bedroom (50%) with a further 25% four bedroom dwellings (Figure SHD.5).
Figure SHD.5: Proportion of social housing dwellings by household size and housing program type, 2015 (per cent)
Source: AIHW National Housing Assistance Data Repository 2014–15. Source data.
Dwelling standard
In 2014, the National Social Housing Survey found that tenants reported most social housing dwellings were of an acceptable standard, defined as having at least four working facilities and not more than two major structural problems.
Of social housing dwellings:
- 70% of SOMIH dwellings were of an acceptable standard
- 81% of public housing dwellings were of an acceptable standard
- 89% of mainstream community housing dwellings were of an acceptable standard.
Data on dwelling standard on Indigenous Community Housing dwellings are not available.
Indigenous households within public rental housing were less likely to report living in a dwelling of an acceptable standard (66%), compared with SOMIH dwellings (70%) and mainstream community housing dwellings (83%). Households with at least one member with a disability were also less likely to live in a dwelling of an acceptable standard within public rental housing (75%), SOMIH (64%) and community housing dwellings (85%).