Meth/amphetamine and other stimulants
Key findings
View the Meth/amphetamine and other stimulants in Australia fact sheet >
Stimulants are a group of drugs that produce stimulatory effects by increasing nerve transmission in the brain and body (Nielsen & Gisev 2017). Included in this group are:
- Amphetamines used for therapeutic purposes to treat attention deficit-hyperactivity disorder (ADHD), but may also be used non-medically, non-medical use of these substances is included in Pharmaceuticals.
- Methamphetamine (also referred to as methylamphetamine) – a potent derivative of amphetamine that is commonly found in 3 forms: powder (speed), base and its most potent form, crystalline (ice or crystal).
- 3, 4-methylenedioxymethamphetamine (MDMA) – commonly referred to as ‘ecstasy’ – is an amphetamine derivative. (Note ecstasy may contain a range of other drugs and substances and may contain no MDMA at all).
- Cocaine – produced from a naturally occurring alkaloid found in the coca plant.
The focus in this section is on the illicit use of meth/amphetamine and other stimulants (Box STIM1).
Box STIM1: Defining amphetamines and other stimulants
Data sources on methamphetamine, amphetamine and other psychostimulants contain a variety of terms; in some instances, these terms cover similar, but not the same range of drugs. This can be confusing when interpreting results across different data sources.
Below is a description of each term used in these data sources and the types of drugs they encompass:
Amphetamine-type stimulants (ATS) covers a large range of drugs, which includes amphetamine, methylamphetamine and phenethylamines (a class of drug that includes MDMA or ‘ecstasy’).
Amphetamines refers to a broad category of substances. According to the Australian Standard Classification of Drugs of Concern (ASCDC) (ABS 2011), this includes amphetamine, methylamphetamine, dexamphetamine, amphetamine analogues and amphetamines not elsewhere classified. This is the term used in the Alcohol and Other Drug Treatment Services National Minimum Data Set (AODTS NMDS).
Methamphetamine (also methylamphetamine) also comes in different forms, including powder/pills (speed), crystal methylamphetamine (crystal meth or ice), a sticky paste (base), and a liquid form.
Methamphetamine and amphetamine includes methylamphetamine and amphetamine and is the term used in the National Drug Strategy Household Survey (NDSHS). Prior to 2022–2023, the NDSHS asked about the use of “Meth/amphetamines”, which also included the non‑medical use of pharmaceutical amphetamines, such as Ritalin (methylphenidate) and pseudoephedrine based cold and flu tablets. The change in terminology was implemented to improve national estimates for use of methamphetamine and amphetamine and improve the understanding of the questions among people who had used methamphetamine and amphetamine. The change represents a break in the timeseries. Results for methamphetamine and amphetamine in 2022–2023 should not be compared to meth/amphetamines results from previous survey waves.
Ecstasy (also MDMA) is often consumed in the form of a tablet or capsules but can also be in powder or crystal form.
Cocaine is commonly consumed in powder form, which can be snorted or dissolved in water so it can be injected.
Psychostimulants (also stimulants) includes ecstasy, methamphetamine, cocaine, and new psychoactive substances (NPS). This is the sampling criteria for participants of the Ecstasy and related Drugs Reporting System (EDRS).
Availability
People who regularly use illicit drugs report that methamphetamine and other stimulants are easy to obtain in Australia.
Findings from the Illicit Drug Reporting System (IDRS) show that people who inject drugs commonly report it is ‘easy’ or ‘very easy’ to obtain methamphetamine and other stimulants. Specifically in 2023:
- Over 9 in 10 (94%) people who had recently used crystal methamphetamine reported that it was ‘easy’ or ‘very easy’ to obtain (Sutherland et al. 2023b, Figure 15).
- Over 2 in 3 (68%) people who had recently used cocaine reported that it was ‘easy’ or ‘very easy’ to obtain (Sutherland et al. 2023b).
Similarly, data from the 2023 Ecstasy and Related Drugs Reporting System (EDRS) show that most people who use ecstasy and other stimulants report that methamphetamine, ecstasy, and cocaine are ‘easy’ or ‘very easy’ to obtain (Sutherland et al. 2023a). Findings show that:
- Perceived availability was the highest for crystal methamphetamine (95% of participants rated it ‘easy or very easy’ to obtain), a small increase from 2022 (92%). Perceived availability for powder methamphetamine increased to 2023 (68% of participants rated availability as it ‘easy or very easy’ to obtain).
- In 2023 a significant change in the perceived availability of ecstasy in all forms was reported relative to 2022. For capsules 77% of participants rated it ‘easy’ or ‘very easy’ to obtain, an increase from 49% in 2022. Powder forms increased to 63% from 42%, crystal increased to 72% from 42%, and pills to 63% from 48% in 2022.
- Perceived availability of cocaine remained stable relative to 2022; 80% of participants in 2023 who could comment rated it ‘easy’ or ‘very easy’ to obtain.
- The main approach for arranging the purchase of any illicit or non-prescribed drugs by participants in the previous 12 months was face-to-face (72%), an increase from 69% in 2022. Social networking applications (such as Facebook, Wickr, WhatsApp, SnapChat, Grindr, Tinder) were used by 71% of participants, a small decrease from 2022 (73%) (Sutherland et al. 2023a).
Please see the data quality statements for the EDRS and the IDRS for data collection during COVID-19 and comparability across years.
The Australian Criminal Intelligence Commission (ACIC) collects national illicit drug seizure data annually from federal, state and territory police services, including the number and weight of seizures to inform the Illicit Drug Data Report (IDDR). According to the latest IDDR, in 2020–21, around one-third of national illicit drug seizures (28,503 or 27%) were amphetamine-type stimulants (ATS) (including MDMA). Additionally:
- The number of national ATS seizures has increased by 88% over the last decade, with 28,503 seizures in 2020–21, up from 15,191 in 2011–12.
- In 2020–21, ATS accounted for 15% of the total weight of illicit drugs seized nationally.
- The total weight of ATS seized nationally has increased 300% over the last decade, from 1,573 kilograms in 2011–12 to 6,287 kilograms in 2020–21 (ACIC 2023a, Figure 8).
Amphetamines accounted for the majority of ATS seizures in 2020–21:
- 25,745 national amphetamines seizures accounted for 90% of the total number of seizures
- 5,892 kilograms accounted for 94% of the weight of seizures (ACIC 2023).
Nationally, in 2020–21, there were:
- 1,753 amphetamine-type stimulant (excluding MDMA) detections at the Australian border, weighing 5,290 kilograms (ACIC 2023a, Figure 1).
- 1,773 MDMA (ecstasy) detections, weighing 106 kilograms (ACIC 2023a, Figure 2).
- 2,578 MDMA seizures (9% of total ATS seizures), weighing 249 kilograms (4% of the total weight of ATS seized) (ACIC 2023a).
Over the last decade, cocaine detections at the Australian border increased:
- from 979 detections in 2011–12 to 2,169 detections in 2020–21 (an increase of 122%).
- The weight of cocaine detected increased by 228%, from 786 kilograms in 2011–12 to a record 2,576 kilograms in 2020–21 (ACIC 2023a, Figure 19).
The number and weight of national cocaine seizures has also increased over the last decade:
- from 1,336 seizures in 2011–12 to a record 6,452 in 2020–21 (a 383% increase).
- The weight of cocaine seized increased over the same period, from 956 kilograms in 2011–12 to 4,421 kilograms in 2020–21 (a 362% increase) (ACIC 2023a, Figure 22).
Research (ACIC 2019) has shown the impact of seizures on consumption—see Supply reduction – Prohibited substances (ACIC 2023a).
Consumption
For related content on meth/amphetamine and other stimulant consumption by region, see also:
There are differences in trends and patterns of consumption in Australia according to the type of stimulant used.
Methamphetamine and amphetamine
- The 2022–2023 NDSHS reported 1.0% of people aged 14 and over in Australia had used methamphetamine and amphetamines in the last 12 months, whereas 7.5% had used methamphetamine and amphetamines in their lifetime (AIHW 2024b, tables 5.2 and 5.6).
- The 2022–2023 NDSHS found that most people who had used methamphetamine and amphetamine recently had used powder/speed at some point in their lifetime (67%), followed by crystal/ice (55%) (AIHW 2024b, Table 5.85).
- 30% of participants in the EDRS reported use of any form of methamphetamine in the previous 6 months, stable relative to 2022 (31%) (Sutherland et al. 2023a).
- 81% of participants in the IDRS reported use of any form of methamphetamine in the previous 6 months, stable relative to 2022 (81%) (Sutherland et al. 2023b).
Participants in the EDRS reported a decrease in the use of crystal methamphetamine in the preceding 6 months (29% in 2012 to 18% in 2022) (Sutherland et al. 2022a, Figure 16).
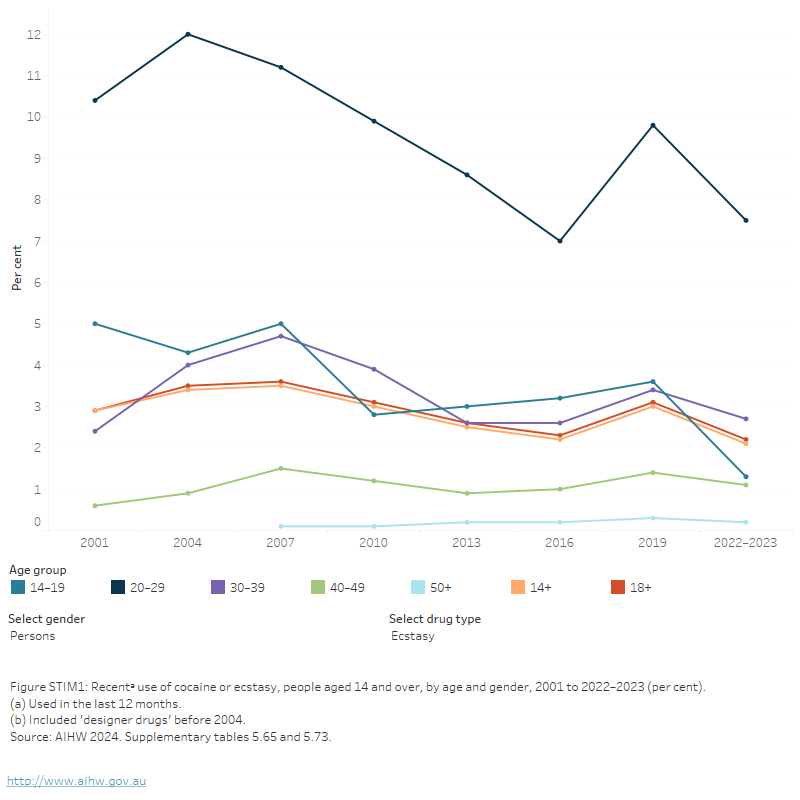
Figure STIM1: Recentᵃ use of cocaine or ecstasy, people aged 14 and over, by age and gender, 2001 to 2022–2023 (per cent)
The figure shows the proportion of people who recently used meth/amphetamine in the last 12 months by age group from 2001 to 2019. Between 2001 and 2019, there were decreases for age groups of 14–19, 20–29, and 14 and over who had recently used meth/amphetamine. Over the same period, the proportion of people aged 30–39, and 50 and over who recently used meth/amphetamine remained stable. In 2019, people aged 20–29 (2.4%) and 30–39 (2.0%) were most likely to have recently used meth/amphetamine.
View data tables >
Ecstasy
The 2022–2023 NDSHS found:
- 2.1% of people aged 14 and over in Australia used ecstasy in the previous 12 months, a decrease since 2019 (3.0%) (Figure STIM1). This may be due to disruptions in the ecstasy market between 2019 and 2022–2023 due to seizures of ecstasy and detections of ecstasy laboratories and COVID-19 disruptions to festivals, raves/dance parties (AIHW 2024b, Ecstasy in the NDSHS). Early evidence from 2023 shows that use may already be increasing again.
- A higher proportion of males than females reported recent ecstasy use in 2022–2023 (2.5% compared with 1.6%).
- In 2022–2023, people aged 20–29 were more likely to be recent users of ecstasy 7.5%) (AIHW 2024b, Table 5.73).
In 2023 ecstasy and cannabis were the most common reported drug of choice for participants of the EDRS who regularly use ecstasy and other stimulants (Sutherland et al. 2023a, Figure 1). EDRS participants indicated that when the past 6 months was compared with the previous year:
- Ecstasy use was reported by 95% of participants, an increase from 88% of participants in 2022 (Sutherland et al, 2023a).
Cocaine
The 2022–2023 NDSHS found:
- 4.5% of people aged 14 and over in Australia used cocaine in the last 12 months, similar to 2019 (4.2%).
- Cocaine was the second most used illicit drug, after marijuana/cannabis.
- Recent use of cocaine remained stable among males (5.3%), while the proportion of females who had recently used cocaine increased in 2022–2023 (3.7%), narrowing the gap between males and females use (FIGURE STIM1).
- In 2022–2023, the proportion of people who reported recent use of cocaine was 3.5 times higher than the level reported in 2001 (1.3% in 2001 compared with 4.5% in 2022–2023 (AIHW 2024b, Table 5.65).
- Recent cocaine use remained stable between 2019 and 2022–2023 across all age groups, except those in their 30s where use increased from 6.5% in 2019 to 8.1% in 2022–2023 (AIHW 2024b, Table 5.65).
For participants of the EDRS, cocaine was the second most commonly used stimulant drug (after ecstasy) with 81% reporting past 6 months use in 2022, remaining stable relative to 2022 (79%) (Sutherland et al. 2023a).
Geographic trends
Data from the National Wastewater Drug Monitoring Program (NWDMP) show that the population-weighted average consumption of stimulant drugs varies based on drug type and geographic area.
Data from Report 21 of the NWDMP show that methylamphetamine was the second most consumed illicit drug (behind cannabis) both nationally and across each jurisdiction. Specifically:
- In August 2023 consumption of methylamphetamine was higher in regional areas than in capital cities.
- Between April and August 2023, the population-weighted average consumption of methylamphetamine decreased in capital cities and increased in regional sites (ACIC 2024).
The estimated weight of methylamphetamine consumed increased by 17% between August 2022 and August 2023. The market value of methylamphetamine consumed during this period is estimated to be $10.58 billion (ACIC 2024).
For state and territory data, see the National Wastewater Drug Monitoring Program reports.
Figure STIM2: Estimated consumption of methylamphetamine in Australia based on detections in wastewater, 2021 to 2023

Australians consumed an estimated 10,585 kg of methylamphetamine in 2021–22
Methylamphetamine consumption was higher in capital cities than in regional areas in August 2023
Increases were reported in estimated consumption of MDMA (19%) and cocaine (33%) between 2021–22 and 2022–23
(a) 'Average consumption' refers to estimated population-weighted average consumption.
Note: Report 21 covers 57% of the Australian population (62 wastewater treatment sites).
Source: AIHW, adapted from ACIC 2024.
MDMA consumption is low across the country, relative to other illicit drugs. The estimated weight of MDMA consumed annually in Australia decreased from a high of 2,630 kilograms in 2019–20 to 962 kilograms in 2022–23. However, there was a 33% increase from 2021–22 (723kg) (ACIC 2024). Data from Report 21 of the NWDMP indicate that nationally:
- In August 2023, the population-weighted average consumption of MDMA in regional areas was higher than in capital cities.
- Between April and August 2023, the population-weighted average consumption of MDMA decreased in cities and increased in regional areas (ACIC 2024).
For state and territory data, see the National Wastewater Drug Monitoring Program reports.
Cocaine consumption in Australia increased to 5,675 kilograms in 2019–20, before declining to 4,037 kilograms in 2022–23. However, there was a 19% increase from 2021–22 (3,385kg) (ACIC 2024). Data from Report 21 of the NWDMP indicate that:
- In August 2023, the population-weighted average consumption of cocaine was higher in capital city areas than in regional areas .
- Between April and August 2023, consumption decreased in capital cities and increased in regional areas (ACIC 2024).
For state and territory data, see the National Wastewater Drug Monitoring Program reports.
Data from the 2022–2023 NDSHS showed that:
- Similar proportions of people living in Major cities, Inner regional and Outer regional remote areas recently used methamphetamine and amphetamine in 2022–2023 (1.1%, 0.9% and *0.7%, respectively). A higher proportion (*2.1%) of people living in Outer Remote and very remote areas reported recent use of methamphetamine and amphetamine (AIHW 2024b, Table 9a.12; Figure STIM3).
- There was little variation in the recent use of methamphetamine and amphetamine for those living in the lowest socioeconomic areas compared with those living in the highest socioeconomic areas (1.1% and 1.3%, respectively) (AIHW 2024b, Table 9a.14; Figure STIM3).
- Recent cocaine use was most common among people living in Victoria (5.3%) and least common among people living in Tasmania (*1.3%) (AIHW 2024b, Table 9a.11).
- Recent ecstasy use was most common in Victoria (2.9%) and least common in the Australian Capital Territory (*0.9%) (AIHW 2024b, Table 9a.11).
- Cocaine and ecstasy use were higher among those who lived in Major cities or the highest socioeconomic areas (AIHW 2024b, tables 9a.12 and 9a.14).
* Estimate has a relative standard error of 25% to 50% and should be used with caution.
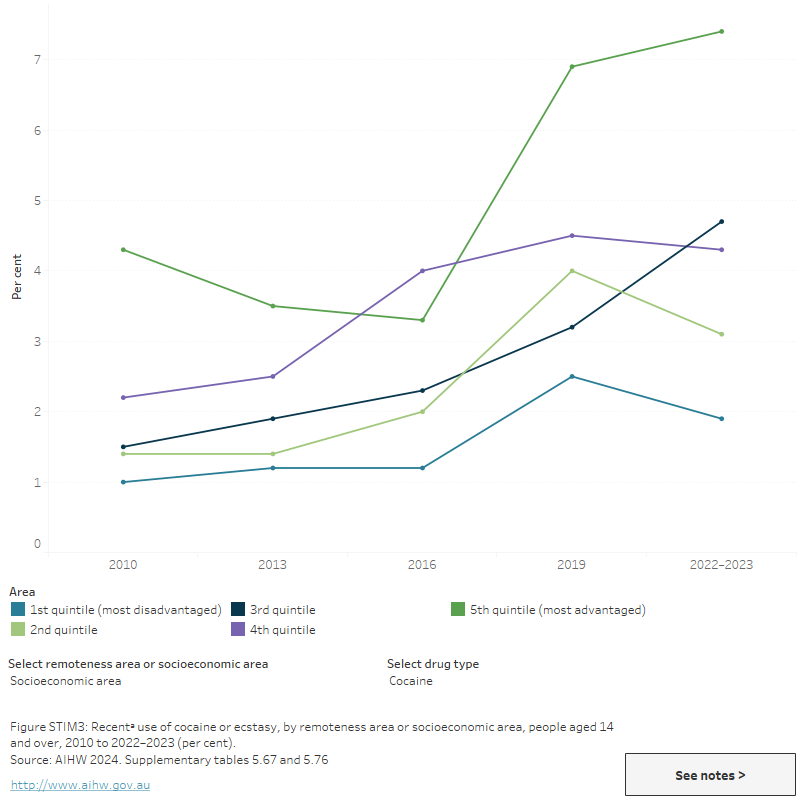
Figure STIM3: Recentᵃ use of cocaine or ecstasy, by remoteness area or socioeconomic area, people aged 14 and over, 2010 to 2022–2023 (per cent)
This figure shows the proportion of recent cocaine use for people aged 14 and over by remoteness area for 2010, 2013, 2016 and 2019. Recent cocaine use trends differed across all 4 remoteness areas between 2010 and 2019. In 2019, recent cocaine use was more common in Major cities (5%) than in Outer regional and Remote and very remote areas (1.4% and 1.7%, respectively).
International comparisons
The National Wastewater Drug Monitoring Program (NWDMP) recently examined average stimulant consumption (amphetamine, methylamphetamine, cocaine, and MDMA) in Australia compared with 24 countries across Europe, Oceania and Asia; also included was 1 city in the United States of America. In March-May 2022:
- Australia had the 6th highest average total stimulant consumption of all included countries at 44 doses per 1,000 people per day, lower than the USA (110 doses per day), Czechia (73 doses), Sweden (68 doses) Belgium (54 doses) and the Netherlands (50 doses).
- Australia had the 3rd highest average consumption of methylamphetamine (42 doses per 1,000 people per day), lower than the USA (85 doses per day) and Czechia (57 doses).
- Cocaine consumption in Australia ranked 18th of 27 countries at 4.0 doses, compared with 35 doses for the highest-ranked country (Belgium) and 0.43 doses for the lowest-ranked countries (New Zealand; 0.43 doses and South Korea; 0.01 doses).
- Australia ranked 21st of 27 reporting countries in MDMA consumption at 1.5 doses per 1,000 people per day, compared with the Netherlands (6.1 doses), New Zealand (4.3 doses) and Portugal (3.6 doses).
- Australia ranked 6th of 16 reporting countries in cannabis consumption at 120 doses per 1,000 people per day, behind the USA (790 doses), Switzerland (160 doses) and the Netherlands (150 doses).
When examining each drug type as a proportion of total combined stimulant consumption:
- Most stimulant consumption in Australia related to methylamphetamine use, which is similar to New Zealand, Czechia, the USA, South Korea, Latvia, Cyprus and Turkey. Finland, Sweden, Poland and the United Kingdom had higher use of amphetamine and the remaining locations predominantly featured cocaine consumption.
- Average consumption in Australia was proportionally higher for methamphetamine than MDMA, which is consistent with most other countries.
- Cocaine consumption in Australia was proportionally higher than the use of MDMA. This was consistent with most participating countries but was the opposite of New Zealand (where MDMA consumption was higher than cocaine) (ACIC 2023b).
Poly drug use
Poly drug use is defined as the use of mixing or taking another illicit or licit drug whilst under the influence of another drug. In 2022–2023, the NDSHS showed that among people who had used methamphetamine or amphetamine in the previous 12 months:
- alcohol (71%) and tobacco (56%) were the most common other drugs used at the same time
- cannabis (48%) and ecstasy (31%) were the most common illicit drugs used at the same time.
- *11.1% of said they did not use any other illicit drug (AIHW 2024b, Table 5.96).
People who reported recent use of ecstasy and cocaine also reported concurrent use of cannabis (38% and 26%, respectively) (AIHW 2024b, tables 5.69 and 5.79).
Data on alcohol and other drug-related ambulance attendances are sourced from the National Ambulance Surveillance System (NASS). Monthly data are currently available for New South Wales, Victoria, Queensland, Tasmania, the Australian Capital Territory and the Northern Territory from 2021. It should be noted that some data for Tasmania and the Australian Capital Territory have been suppressed due to low numbers. Please see the data quality statement for further information.
In 2022, the proportion of amphetamine-related ambulance attendances where multiple drugs were involved (excluding alcohol) ranged from 34% of attendances in Queensland to 52% of attendances in Victoria (Table S1.11).
For related content on multiple drug involvement see Impacts: Ambulance attendances.
Harms
For related content on meth/amphetamine and other stimulant impacts and harms, see also:
The short and long-term effects associated with the use of methamphetamine and other stimulants are provided in Table STIM1.
| Drug type | Short-term effects | Long-term effects |
|---|---|---|
Methamphetamine (includes powder, base and crystal/ice) |
|
|
Ecstasy/MDMA |
|
|
Cocaine |
|
|
Source: Adapted from ACIC 2019a; Darke, Kaye & Duflou 2017; NSW Ministry of Health 2017.
Burden of disease and injury
The Australian Burden of Disease Study, 2018, found that amphetamine use was responsible for 0.7% of the total burden of disease and injuries in Australia in 2018 and 24% of the total burden due to illicit drug use (AIHW 2021) (Table S2.5).
Of the burden due to amphetamine use, drug use disorder (excluding alcohol) contributed 32%, poisoning 17% and suicide and self-inflicted injuries 5.4%. Other contributors to the burden due to amphetamine use included road traffic injuries–motor vehicle occupants and motorcyclists (3.0% each) (AIHW 2021).
Cocaine use contributed 0.3% of the total burden of disease and injuries in 2018 and 10.9% of the total burden due to illicit drug use (Table S2.5). Of the burden due to cocaine use, suicide and self-inflicted injuries accounted for 6.4% and drug use disorder (excluding alcohol) 10.6% (AIHW 2021).
Ambulance attendances
Data on alcohol and other drug-related ambulance attendances are sourced from the National Ambulance Surveillance System (NASS Monthly data are presented from 2021 for people aged 15 years and over for New South Wales, Victoria, Queensland, Tasmania, and the Australian Capital Territory. Monthly data for Northern Territory are presented from 2022.
For the 6 jurisdictions where amphetamine-related ambulance attendances data are available, in 2022:
- Rates of attendances ranged from 49.0 per 100,000 population in Tasmania to 81.4 per 100,000 population in Queensland.
In New South Wales, Victoria, and Queensland (age and sex disaggregations for Tasmania and the Australian Capital are too small to report):
- Almost 2 in 3 (64%) of total attendances were for males
- The highest rates of attendances were in people aged 25–34:
- Queensland (1,300 attendances, 178.0 per 100,000 population)
- Victoria (1,600 attendances, 155.7 per 100,000 population) (Table S1.10).
For the 5 jurisdictions where monthly data from 2021 is available, between 2021 and 2022:
- Rates of amphetamine-related ambulance attendances have decreased across all jurisdictions, with the exception of Queensland and Tasmania.
- In Queensland and Tasmania, amphetamine-related ambulance attendance rates have increased from 2021 to 2022 (73.5 to 81.4 per 100,000 population in Queensland and 46.9 to 75.9 per 100,000 population in Tasmania).
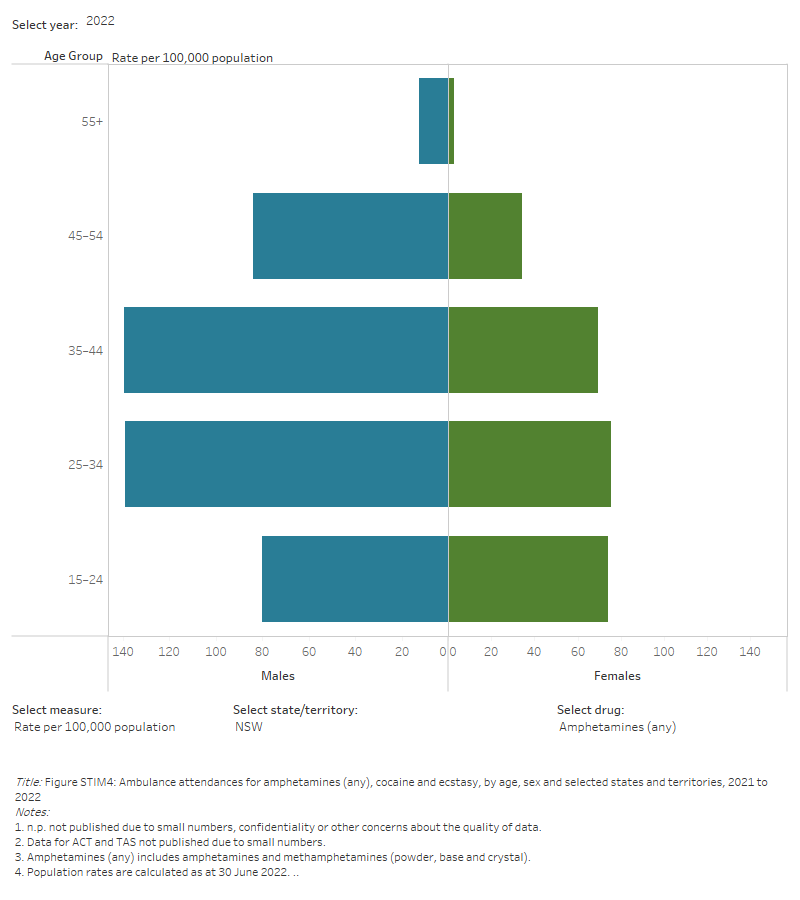
Figure STIM4: Ambulance attendances for amphetamines (any), cocaine and ecstasy, by age, sex and selected states and territories, 2021 to 2022
This figure shows amphetamine-related ambulance attendances in NSW. The highest number of attendances were for males aged 25-34. There is a filter to select year, state/territory, drug and measure (number of attendances or rate per 100,000 population).
Hospitalisations
Drug-related hospitalisations are defined as hospitalisations with a principal diagnosis relating to a substance use disorder or direct harm relating to use of selected substances (AIHW 2018).
AIHW analysis of the National Hospital Morbidity Database (NHMD) showed that, among all drug-related hospitalisations in 2021–22:
- Almost one in 10 were for amphetamines and other stimulants (9.0% or 12,200 hospitalisations). Within this category, over 4 in 5 hospitalisations were for methamphetamine (82% or 10,100 hospitalisations)
- Less than 1% were for cocaine (0.9% or 1,300 hospitalisations) (Table S1.12c).
This is a rate of 39.1 hospitalisations per 100,000 population for methamphetamine and 4.9 per 100,000 for cocaine (Table S1.12c).
In 2021–22, for methamphetamine-related hospitalisations:
- 7 in 10 hospitalisations involved an overnight stay (70% or 7,000).
- Most hospitalisations involved males (64% or 6,500 hospitalisations).
- Over 2 in 5 were people aged 25–34 (42% or 4,200 hospitalisations) (Table S1.12a–12c).
In 2021–22, for cocaine related hospitalisations:
- Around 2 in 3 ended with a same-day discharge (67% or 840 hospitalisations).
- Most hospitalisations involved males (71% or 900 hospitalisations).
- Almost 3 in 4 were people aged 25–44 (74% or 900 hospitalisations).
In 2021–22, most hospitalisations occurred in Major cities for both methamphetamine (72% or 7,200 hospitalisations) and cocaine (92% or 1,200 hospitalisations) (Table S1.14).
- Accounting for differences in population size, the rates of hospitalisations for methamphetamine were similar in Major cities and Remote and very remote areas (39.2 and 35.3 hospitalisations per 100,000 population, respectively).
- The rate of hospitalisations for cocaine was highest in Major cities (6.3 per 100,000 population, compared with 1.0 and 0.9 per 100,000 in Outer regional and Inner regional areas, respectively) (Table S1.14).
In the 7 years to 2021–22:
- The number of methamphetamine-related hospitalisations increased between 2015–16 (9,300 hospitalisations or 38.8 per 100,000 population) and 2019–20 (14,100 hospitalisations or 55.1 per 100,000), before falling to 10,100 in 2021–22 (39.1 per 100,000).
- The rate of methamphetamine-related hospitalisations increased in Major cities between 2015–16 (38.1 per 100,000) and 2019–20 (52.8 per 100,000), then declined in 2021–22 (39.2 per 100,000).
- The number of cocaine-related hospitalisations steadily increased between 2015–16 (780 hospitalisations or 3.2 per 100,000 population) and 2020–21 (1,800 hospitalisations or 7.0 per 100,000). In 2021–22, hospitalisations returned to pre-pandemic levels (1,300 or 4.9 per 100,000).
- The rate of cocaine-related hospitalisations has increased in Major cities from 2015–16 (4.2 per 100,000) to 2021–22 (6.3 per 100,000) (Table S1.14; Figure IMPACT4).
The finding for cocaine is consistent with analysis of the NHMD by the National Drug and Alcohol Research Centre (NDARC). This analysis showed that, accounting for population growth and ageing, the rate of cocaine-related hospitalisations increased almost 6-fold between 2010–11 (0.8 per 100,000 population) and 2018–19 (4.5 per 100,000 population). A significant increased was also observed between 2019–20 (4.8 per 100,000 population) and 2020–21 (6.7 per 100,000 population) (Chrzanowska et al. 2022a).
Deaths
Drug-induced deaths are determined by toxicology and pathology reports and are defined as those deaths that can be directly attributable to drug use. This includes deaths due to acute toxicity (for example, drug overdose) and chronic use (for example, drug-induced cardiac conditions) (ABS 2021).
The rate of drug-induced deaths related to methamphetamine and other stimulants has increased rapidly in recent years.
See also Health impacts: Drug-induced deaths for more information.
- AIHW analysis of the AIHW National Mortality Database shows that the death rate for all psychostimulants (including amphetamines, methamphetamine, ecstasy/MDMA and caffeine) in 2022 was almost 4 times higher than that in 2000 (1.8 deaths compared with 0.5 deaths per 100,000 population, respectively). Over the same period, the rate of drug-induced deaths involving cocaine increased from 0.1 deaths to 0.3 deaths per 100,000 population (Table S1.1).
- Estimates by the National Drug and Alcohol Research Centre (NDARC) showed that, in 2021, there were 451 drug-induced deaths involving amphetamines – a rate of 1.8 deaths per 100,000 people. This is an increase from 104 deaths (0.5 deaths per 100,000) in 2011 (Chrzanowska et al. 2023).
- Recent research examining methamphetamine-related deaths in isolation from other stimulants found that mortality rates have almost doubled during a period of 7 years between 2009 and 2015. The most common manner of methamphetamine-related death was accidental drug toxicity; however, natural disease (e.g. coronary disease, stroke, kidney disease, and liver disease), suicide and accidents comprised more than half of the deaths (Darke, Kaye & Duflou 2017).
Treatment
The latest Alcohol and other drug treatment services in Australia: early insights report shows that amphetamines were the principal drug of concern in 24% of treatment episodes provided to people for their own drug use in 2022–23. Around 4 in 5 (82%) of these amphetamine-related episodes were for methamphetamine, consistent with the previous year. Cocaine and MDMA were reported as the principal drug of concern in 1.2% of episodes in 2022–23, stable from 1.3% in 2021–22 (AIHW 2024a).
Data collected for the AODTS NMDS are released twice each year: an early insights report in April and a detailed report mid-year. The section below will be updated with information from the annual report once these data become available.
Amphetamines
Data from the AIHW’s AODTS NMDS for amphetamines correspond to the Australian Standard Classification of Drugs of Concern (ASCDC) code for the general ‘amphetamines’ classification, in which methamphetamine is a sub-classification. Specific coding for methamphetamine episodes has not previously been available due to the nature of the coding structure. This has improved over time, due to improved workforce training and new system updates (AIHW 2023).
The AODTS NMDS provides information on treatment provided to clients by publicly funded AOD treatment services, including government and non-government organisations.
In 2021–22, where amphetamines were the principal drug of concern:
- 3 in 5 (61%) of clients were male and 1 in 5 (20%) clients were Indigenous Australians (AIHW 2023, tables SC.9 and SC.11).
- Most clients (58%) were aged 20–39 (AIHW 2023, Table SC.10).
- The most common source of referral for treatment was self/family (37% of treatment episodes), followed by health services (26%) (AIHW 2023, Table Drg.37).
- The most common main treatment type was counselling (38% of treatment episodes), followed by assessment only (23%) (AIHW 2023, Table Drg.36; Figure STIM5).
- Counselling has remained the most common main treatment type across the 10-year period to 2021–22 (AIHW 2023).
Figure STIM5: Treatment provided for own use of amphetamines, 2021–22
Amphetamines were the 2nd most common principal drug of concern (24% of treatment episodes)
Around 1 in 5 clients were Indigenous Australians

Around 1 in 5 clients were Indigenous Australians
Source: AIHW 2023, tables Drg.1, SC.11 and Drg.36.
In 2016–17, where the principal drug of concern was amphetamines, the proportion of people living in Regional and remote areas who travelled 1 hour or longer to treatment services was higher than in Major cities (31% compared with 10%) (AIHW 2019).
Ecstasy
In 2020–21, ecstasy was the principal drug of concern in less than 1% (0.3%) of closed treatment episodes provided for clients’ own drug use (AIHW 2022, Table Drg.5). Treatment episodes for ecstasy remained relatively stable over the 10-year period to 2020–21.
In 2020–21, where ecstasy was the principal drug of concern:
- 2 in 3 (66%) clients were male and 8% were Indigenous Australians (AIHW 2022, tables SC.9 and SC.11).
- Over 4 in 5 (85%) clients were aged 10–29 (AIHW 2022, Table SC.10).
- The most common source of referral was diversion from the criminal justice system (31%) followed by self/family (25%) (AIHW 2022, Table Drg.73).
- The most common main treatment type was counselling (51%), followed by assessment only (17%) (AIHW 2022, Table Drg.72).
Cocaine
In 2020–21, cocaine was the principal drug of concern in 1.1% of closed treatment episodes provided for clients’ own drug use (AIHW 2022, Table Drg.5). The proportion of treatment episodes for cocaine has remained low over the 10-year period to 2020–21, increasing from 0.3% of episodes in 2011–12 (AIHW 2022).
In 2020–21, where cocaine was the principal drug of concern:
- Over 4 in 5 (85%) clients were male and 5.4% were Indigenous Australians (AIHW 2022, tables SC.9 and SC.11).
- 1 in 2 (50%) clients were aged 20–29, and 28% were aged 30–39 (AIHW 2022, Table SC.10).
- The most common source of referral was self or family (37% of closed treatment episodes), followed by health services (24%) (AIHW 2022, Table Drg.82).
- Counselling was the most common main treatment type (49% of closed treatment episodes), followed by assessment only (21%) (AIHW 2022, Drg.81).
At-risk groups
For related content on at-risk groups, see:
The use of meth/amphetamine and other stimulants can be disproportionately higher for specific population groups.
- Aboriginal and Torres Strait Islander people were more than 2 times as likely to report the recent use of meth/amphetamine than non-Indigenous Australians. However, the estimate for Indigenous Australians has a relative standard error of 25% to 50% and should be used with caution.
- More than half of police detainees and prison entrants recently used methamphetamine.
- People with a mental health condition were more than 2 times as likely to report recent meth/amphetamine use than people who had not been diagnosed or treated for a mental health condition.
- Methamphetamine is the most commonly injected drug in Australia.
Policy context
Public perceptions and policy support
The NDSHS found that between 2019 and 2022–2023, less people thought of methamphetamine and amphetamine as a drug of concern for the general community (40% compared with 35%), fewer people thought it caused the most deaths (20% compared with 14.8%) (AIHW 2024b, tables 11.5 & 11.3).
National Ice Action Strategy 2015
In April 2015, the Australian Government established a National Ice Taskforce, to provide advice on the development of a National Ice Action Strategy (NIAS).
The objectives of the NIAS are to ensure that:
- families and communities have better access to information, support and tools to help them to respond to ice (methamphetamine);
- prevention messages are targeted at high-risk populations and accurate information about ice is more accessible;
- early intervention and treatment services are better tailored to respond to ice and meet the needs of the populations they serve;
- law enforcement efforts are better targeted to disrupt the supply of ice; and
- better evidence is available to drive responses to the effects of ice in our community (Department of Health 2017).
Resources and further information
The NDSHS found that between 2019 and 2022–2023, less people thought of methamphetamine and amphetamine as the drug of most concern for the general community (40% compared with 35%), and fewer people thought it caused the most deaths (20% compared with 14.8%) (AIHW 2024b, tables 11.5 & 11.3).
ACIC (Australian Criminal Intelligence Commission) (2019). Methylamphetamine supply reduction—measures of effectiveness. Canberra: ACIC. accessed 14 October 2019.
ACIC (2023a). Illicit Drug Data Report 2020–2021. Canberra: ACIC, accessed 24 October 2023.
ACIC (2023b). National Wastewater Drug Monitoring Program Report 19. Canberra: ACIC, accessed 24 July 2023.
ACIC (2024) National Wastewater Drug Monitoring Program Report 21. Canberra: ACIC, accessed 14 March 2024.
AIHW (Australian Institute of Health and Welfare) (2018). Drug related hospitalisations. Cat. no. HSE 220. Canberra: AIHW, accessed 18 August 2021.
AIHW (2019). Alcohol and other drug use in regional and remote Australia: consumption, harms and access to treatment, 2016–17. Cat. no. HSE 212. Canberra: AIHW, accessed 15 March 2019.
AIHW (2021). Australian Burden of Disease Study: Impact and causes of illness and death in Australia 2018, AIHW, Australian Government. doi:10.25816/5ps1-j259
AIHW (2023). Alcohol and Other Drug Treatment Services annual report. Cat. No. HSE 250. Canberra: AIHW, accessed 21 June 2023.
AIHW (2024a) Alcohol and other drug treatment services in Australia: early insights. AIHW, Australian Government, accessed 16 April 2024.
AIHW (2024b) National Drug Strategy Household Survey 2022–2023. AIHW, accessed 29 February 2024.
Chrzanowska A, Man N, Akhurst J, Sutherland R, Degenhardt L & Peacock A (2022). Trends in drug-related hospitalisations in Australia, 1999–2021. Drug Trends Bulletin Series. Sydney: National Drug and Alcohol Research Centre, UNSW, accessed 2 November 2022.
Chrzanowska A, Man N, Akhurst J, Sutherland R, Degenhardt, L Peacock A (2023). Trends in overdose and other drug-induced deaths in Australia, 2002-2021 . Sydney: National Drug and Alcohol Research Centre, UNSW Sydney, accessed 4 May 2023.
Darke S, Kaye S & Duflou J (2017). Rates, characteristics and circumstances of methamphetamine-related death in Australia: a national 7-year study. Addiction 112: 2191-2201.
Department of Health (2017). National ice action strategy. Canberra: DoH, accessed 29 November 2017.
Nielsen S & Gisev N (2017). Drug pharmacology and pharmacotherapy treatments. In Ritter, King and Lee (eds). Drug use in Australian society. 2nd edn. Oxford University Press.
NSW Ministry of Health (2017). A quick guide to drugs & alcohol, 3rd edn. Sydney: National Drug and Alcohol Research Centre, UNSW, accessed 24 June 2021.
Sutherland R, Karlsson A, King C, Uporova J, Chandrasena U, Jones F, Gibbs D, Price O, Dietze P, Lenton S, Salom C, Bruno R, Wilson J, Grigg J, Daly C, Thomas N, Radke S, Stafford L, Degenhardt L, Farrell M, & Peacock A (2023a). Australian Drug Trends 2023: Key Findings from the National Ecstasy and Related Drugs Reporting System (EDRS) Interviews. Sydney: National Drug and Alcohol Research Centre, UNSW Sydney. Accessed 25 October 2023.
Sutherland R, Uporova J, King C, Chandrasena U, Karlsson A, Jones F, Gibbs D, Price O, Dietze P, Lenton S, Salom C, Bruno R, Wilson J, Agramunt S, Daly C, Thomas N, Radke S, Stafford L, Degenhardt L, Farrell M, & Peacock A (2023b). Australian Drug Trends 2023: Key Findings from the National Illicit Drug Reporting System (IDRS) Interviews. Sydney: National Drug and Alcohol Research Centre, UNSW Sydney. Accessed 25 October 2023.