Chapter 6 Preventing and treating ill health
6.0 Introduction
A fundamental aim of any health system is to prevent disease so that people remain as healthy as possible for as long as possible. Should they become ill, people need to have access to timely and appropriate treatment. This chapter examines these two functions of the health system: prevention and treatment.
Health prevention and promotion strategies—such as sanitation, immunisation, anti-smoking campaigns, clean air and water, food safety and workplace health and safety—have helped to prevent the spread of infectious diseases and to create safer, healthier environments in which to live.
Immunisation is one of the most effective health-prevention strategies, and in Australia more than 90% of children are fully immunised by the time they start school.
Population-based cancer screening is another major area of prevention activity in Australia, with national programs for breast, cervical and bowel cancers. In each of the 2-year periods 2012–2013 and 2013–2014, more than 3.8 million women took part in the National Cervical Screening Program. Although this program reached almost 60% of the eligible population, there is room for improvement.
As outlined in Chapter 2, Australia's health system is a complex network of providers, services and settings, not all of which are covered in Australia's health 2016. This chapter focuses principally on primary health care and hospital services, and on selected specialised treatment services: mental health services and alcohol and other drug treatment services. This chapter also includes feature articles on end-of-life care and on Indigenous women's access to maternal health services.
Primary health care is generally the first point of contact that people have with the health system, and it is also the gateway for access to other, specialised health services. In 2014–15, more than one-third of the 335 million out-of-hospital Medicare services claimed were for non-referred consultations with general practitioners who, along with allied health professionals, play a major role in primary care.
Despite the importance of the primary health care sector, only limited data are available on the delivery of primary health care in Australia. (An exception is the Indigenous primary health care sector, where regular and comprehensive performance data are collected, and this is profiled in 'Chapter 6.5 Using data to improve the quality of Indigenous health care'.)
This chapter also includes an overview of Australia's public and private hospitals, which provide nearly 90,000 hospital beds and about 28 million days of patient care each year. It examines safety and quality in hospitals, how hospital care is changing, and health care use by older Australians, who account for an increasing share of our population and hospital patients.
6.1 Prevention and health promotion
A fundamental aim of any health system is to prevent disease and reduce ill health so that people remain as healthy as possible for as long as possible. Reducing the impacts of preventable illness, disability and injury increases participation rates in the labour force and education and increases the quality of life enjoyed by individuals and society (Gruszin et al. 2012). In Australia, health prevention activities have long played a part in improving the health of Australians—for example, early prevention measures in the 1800s included sewerage systems and water supply in Sydney to improve public sanitation (Hector 2011). Some prevention activities target all people in a given population (for example, fluoridated water), while others target particular groups based on age or other risk factors (for example, breast cancer screening).
Health promotion (for example, education, social marketing, legislation and regulation) is an important part of disease prevention and can be used to help build social and physical environments that support healthy behaviours. In the past, prevention and promotion strategies, such as sanitation, immunisation, quarantine, workplace health and safety, safe birthing practices, and better food and water supply, have helped to prevent the spread of infectious diseases, improve maternal and child health, and create safer, healthier environments in which to live and work. These strategies continue to be vital today.
In 2013–14, $2.2 billion, or 1.4% of total health expenditure, went to public health activities, which included prevention and health promotion (AIHW 2016). This did not include spending in non-health sectors such as road safety, the environment, and schools. The proportion of health expenditure allocated to public health has been declining since it peaked in 2007–08 (2.2%) (AIHW 2016).
This snapshot highlights selected prevention and promotion activities.
Immunisation and vaccination
Immunisation is an important public health intervention to stop the spread of diseases that can cause serious illness and death. Worldwide, immunisation programs prevent an estimated 3 million deaths every year (Department of Health 2015a).
In Australia, immunisation begins at birth and vaccinations for children cover 13 diseases, including measles, mumps, diphtheria and whooping cough (Department of Health 2015a).
For immunisation to provide the greatest benefit, a large proportion of the community must be fully immunised. In the past, target coverage rates have been around 90%, with these rates for children being largely achieved (Table 6.1.1). However, due to a higher level of vaccine coverage required to achieve community immunity for measles, a recent national aspirational immunisation target (that is, the proportion of people who are fully immunised) has been set at 95% (Department of Health 2016c).
| Group | Age (years)(a) 1 |
Age (years)(a) 2 |
Age (years)(a) 5 |
|---|---|---|---|
 All children All children |
92.3% | 89.3% | 92.6% |
 Indigenous children Indigenous children |
88.7% | 86.2% | 93.9% |
- Children aged 1, 2 and 5 refer to 12–<15 months, 24–<27 months and 60–<63 months, respectively.
Sources: Department of Health 2016a, 2016b.
A national Human Papillomavirus (HPV) vaccination program (using the quadrivalent HPV vaccine which protects against four types of HPV) was introduced for females in 2007 and extended to males in 2013. Australia was the first country to introduce such a program and there has been a fall in HPV-related infection in females, high-grade cervical abnormalities (for example, precancerous lesions of the cervix) in young women, and genital warts among females and males since it began (Department of Health 2015b; NCIRS 2014). For example, 4 years after the beginning of the program, there was a substantial decrease in vaccine-targeted HPV genotypes (the specific types of HPV covered by the vaccine) among women aged 18–24—from 29% in 2004–2007 to 6.7% in 2010–2011 (Tabrizi et al. 2012). Of children turning 15 in 2014, 73% of girls were fully immunised (having received three HPV vaccinations) and 60% of boys were fully immunised (NHPVVPR 2015).
The Australian Government also funds a range of vaccinations for eligible people under the Immunise Australia Program. For example, the flu vaccine is available, for free, to pregnant women, Aboriginal and Torres Strait Islander Australians, people aged 65 and over, and people who are medically at risk and thus more likely to experience complications from flu (Department of Health 2015a).
Success stories
Two of the biggest prevention success stories in Australia have been reductions in road deaths and tobacco smoking rates. Even though the number of registered vehicles continues to increase over time, road deaths have fallen—from nearly 3,800 in 1970 to fewer than 1,200 in 2014 (BITRE 2010, 2015). During that time, a number of national road safety initiatives were introduced, including the compulsory wearing of seat belts, random breath testing and 50 km/h residential street speed limits.
Similarly, comprehensive public health policy approaches, including promotion, regulation and increased taxation on tobacco products, have contributed to the steady reduction in the daily tobacco smoking rate from 24% in 1991 to 13% in 2013 for people aged 14 and over (Figure 6.1.1). This reduction has been particularly marked for younger people, with the fall in daily smoking rates over the past decade occurring predominantly among people aged 18–49. The average age at which young people aged 14–24 smoked their first cigarette has risen steadily since 2001 (15.9 years in 2013 compared with 14.3 in 2001) and the proportions of secondary school students aged 12–17 who reported smoking in their lifetime, in the past 4 weeks, past week or on 3 days of the last 7, continues to decline (White & Williams 2015) (see 'Chapter 4.7 Tobacco smoking').
Figure 6.1.1: Daily smokers aged 14 and over and key tobacco control measures, Australia, 1990–2016
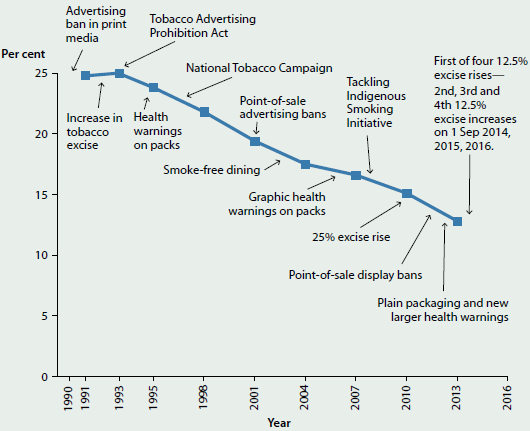
Source: Department of Health 2015c.
Preventing chronic disease
Chronic diseases, such as coronary heart disease, cancer and diabetes, are the leading causes of illness, disability and death in Australia, and accounted for 17 of the 20 top causes of death in 2013 (see 'Chapter 3.3 Chronic disease and comorbidities'). Strategies to help reduce the impact of chronic disease and associated risk factors are a focus for all Australian governments.
Key risk factors associated with chronic disease include poor diet, physical inactivity, tobacco smoking, excessive alcohol consumption, high body mass and high blood pressure (see 'Chapter 3.1 Burden of disease and injury in Australia' and 'Chapter 4 Determinants of health'). These risk factors are largely preventable and can be reduced or eliminated through behavioural changes or managed with medical treatments (for example, medication for high blood pressure). Population health strategies targeting risk factors are wide-ranging, from guidelines and legislation to health programs and media campaigns (see Box 6.1.1 for examples in relation to diet).
Box 6.1.1: Population health approaches targeting diet and nutrition
- Australian Dietary Guidelines
- Mandatory fortification, for example folate fortification of bread
- Legislative instruments (for example Australia New Zealand Food Standards Code; mandatory food labelling)
- Policy and programs for healthy eating and good nutrition in schools
- National campaigns such as the Swap It, Don't Stop It campaign (2008) and the Go for 2&5 campaign (2005)
- Initiatives such as the National Heart Foundation 'Tick' endorsement program and other food labelling (beginning 1989) and the Health Star Rating System (2014)
What is missing from the picture?
Evaluating the impact and cost of community and nationwide initiatives can be difficult. Directly attributing outcomes to a specific initiative can also be a challenge, especially when multiple strategies are being applied at once (for example, legislation, taxation and promotion campaigns). Adding to this challenge is the fact that the impact of an intervention will often be delayed, meaning evidence to support the effectiveness of prevention activities may not be available for many years.
Vaccinations are recorded in Australia for children up to the age of 7, but there is no register for adults. The national system for recording childhood vaccinations is the Australian Childhood Immunisation Register (ACIR). A 'whole-of-life' Australian Immunisation Register will be introduced during the second half of 2016, starting with expansion of the ACIR to record vaccines delivered during adolescence (NCIRS 2015).
Where do I go for more information?
More information on the Immunise Australia Program is available at Department of Health website. The reports National Drug Strategy Household Survey detailed report: 2013 and Australia's food and nutrition 2012 are also available for free download.
References
AIHW (Australian Institute of Health and Welfare) 2016. National health expenditure, current and constant prices, 1985–86 to 2013–14, data cube. Canberra: AIHW.
BITRE (Bureau of Infrastructure, Transport and Regional Economics) 2010. Road deaths in Australia 1925–2008. Canberra: BITRE.
BITRE 2015. Road trauma Australia, 2014 statistical summary. Canberra: BITRE.
Department of Health 2015a. Immunise Australia Program. Canberra: Department of Health. Viewed 15 October 2015.
Department of Health 2015b. Immunise Australia Program. Human Papillomavirus (HPV). Canberra: Department of Health. Viewed 31 March 2016.
Department of Health 2015c. Tobacco key facts and figures. Canberra: Department of Health. Viewed 23 October 2015.
Department of Health 2016a. Immunise Australia Program. ACIR current data. Canberra: Department of Health.
Department of Health 2016b. Immunise Australia Program. ACIR current data: Aboriginal and Torres Strait Islander children. Canberra: Department of Health.
Department of Health 2016c. Immunise Australia Program. Immunisation coverage targets. Canberra: Department of Health.
Gruszin S, Hetzel D & Glover J 2012. Advocacy and action in public health: lessons from Australia over the 20th century. Canberra: Australian National Preventive Health Agency.
Hector D 2011. Sydney's water sewerage and drainage system. Journal and Proceedings of the Royal Society of New South Wales 144:3–25.
NCIRS (National Centre for Immunisation Research and Surveillance) 2014. Evaluation of the National Human Papillomavirus Vaccination Program: final report.
NCIRS 2015. Adult vaccination: fact sheet. Vaccines for Australian adults: information for immunisation providers, August 2015. Sydney: NCIRS.
NHPVVPR (National HPV Vaccination Program Register) 2015. Coverage data. Melbourne: NHPVVPR.
Tabrizi SN, Brotherton JM, Kaldor JM, Skinner SR, Cummins E, Liu B et al. 2012. Fall in human papillomavirus prevalence following a national vaccination program. Journal of Infectious Diseases 206(11):1645–51.
White V & Williams T 2015. Australian secondary school students' use of tobacco in 2014: report. Report prepared for the Tobacco Control Taskforce and the Australian Government Department of Health. Melbourne: Cancer Council of Victoria.
6.2 Cancer screening
Population-based cancer screening is an organised, systematic and integrated process of testing for signs of cancer or pre-cancerous conditions in populations without obvious symptoms. In Australia, there are national population-based screening programs for breast, cervical and bowel cancers. They are run through partnerships between the Australian Government and state and territory governments. The programs target particular populations and age groups where evidence shows screening is most effective at reducing cancer-related morbidity and mortality.
BreastScreen Australia
BreastScreen Australia, established in 1991, provides free, 2-yearly screening mammograms (see Glossary) to women aged 40 and over, and actively targets women aged 50–74.
The target age group for BreastScreen Australia was expanded from women aged 50–69 to women aged 50–74 from 1 July 2013. The target age group 50–69 is used here because during the years reported, most data were collected when only women aged 50–69 were actively targeted.
- High attendance for screening is needed to maximise the number of breast cancers detected early, and subsequent reductions in mortality from breast cancer.
- In 2012–2013 and 2013–2014, more than 1.4 million women aged 50–69 participated in BreastScreen Australia, which is around 55% of the population.
- Participation was lower among Aboriginal and Torres Strait Islander women, at around 36% of the population in 2012–2013, as well as among women living in Very remote areas (47%) and women from a culturally or linguistically diverse background (49%).
- Over time, participation in BreastScreen Australia has remained relatively steady, being around 55–57% between 1996–1997 and 2011–2012, before falling slightly to 54% in the latest available reporting periods of 2012–2013 and 2013–2014 (Figure 6.2.1).
- More than half of all breast cancers detected through BreastScreen Australia are small, and small breast cancers are associated with more treatment options and improved survival.
National Cervical Screening Program
The National Cervical Screening Program (NCSP), established in 1991, targets women aged 20–69 for a 2-yearly Papanicolau smear, or 'Pap test' (see Glossary).
- High attendance for screening means that more cervical abnormalities can be detected and treated that could otherwise develop into cervical cancer, leading to a reduction in cervical cancer incidence and mortality.
- In 2012–2013 and 2013–2014, more than 3.8 million women aged 20–69 participated in the NCSP, which is around 58% of the eligible population.
- Participation in 2012–2013 was similar across remoteness areas—highest in Inner regional areas (60%) and lowest in Very remote locations (55%), but increased with increasing socioeconomic position (from 52% in the lowest socioeconomic group to 64% in the highest group).
- Participation has remained steady since 2004–2005 at around 57%–59% (Figure 6.2.2).
- For every 1,000 women screened, around 8 have a high-grade abnormality detected, providing an opportunity for treatment before possible progression to cervical cancer.
Figure 6.2.1: Number of women screened and age-standardised participation rate, BreastScreen Australia, 1996–1997 to 2013–2014
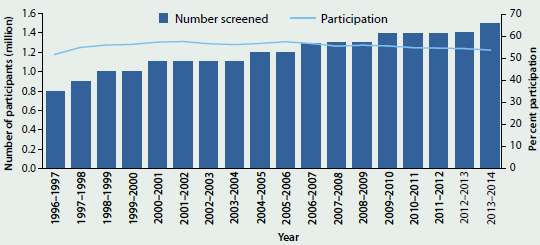
Sources: AIHW analysis of BreastScreen Australia data; AIHW analysis of state and territory cervical cytology register data.
Figure 6.2.2: Number of women screened and age-standardised participation rate, National Cervical Screening Program, Australia, 1996–1997 to 2013–2014
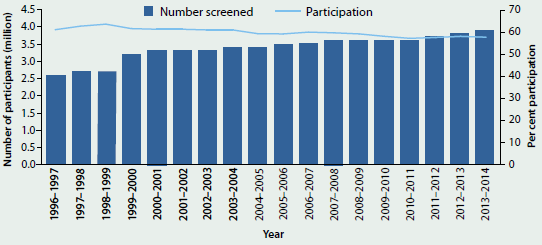
Sources: AIHW analysis of BreastScreen Australia data; AIHW analysis of state and territory cervical cytology register data.
National Bowel Cancer Screening Program
The National Bowel Cancer Screening Program (NBCSP), established in 2006, currently targets men and women turning 50, 55, 60, 65, 70 and 74, inviting them to screen for bowel cancer using a free faecal occult blood test (FOBT) (see Glossary). In 2014, the Australian Government announced that the program was to be expanded, and once fully implemented in 2020 would offer free 2-yearly screening for all Australians aged 50–74.
From 1 July 2013 to 30 June 2014, 1.4 million FOBT invitation kits were issued to eligible Australians. Of these:
- nearly 510,000 returned a completed FOBT kit for analysis—a participation rate of 36%. Participation was higher among women (39%) than men (34%)
- of the people who returned a valid screening test, 7.5% returned a FOBT with a positive screening result and 68% of those had a follow-up colonoscopy (see Glossary) recorded
- of those participants who underwent a colonoscopy, 1 in 25 were diagnosed with a confirmed or suspected bowel cancer, and 1 in 11 were diagnosed with an advanced adenoma (pre-cancerous tumour).
What is missing from the picture?
National cancer data do not include whether a new case of cancer was identified through screening.
Participation in cervical screening cannot be measured nationally for Aboriginal and Torres Strait Islander women as Indigenous status is not included on all pathology forms in all states and territories, which is the only source that provides information to cervical screening registers. However, available evidence on the participation in cervical screening by Indigenous women suggests that Aboriginal and Torres Strait women are under-screened.
What is the AIHW doing?
A recent AIHW study compared bowel cancer outcomes of those invited to participate in the NBCSP with those of similar age who had not yet been invited. To do this, data from the NBCSP were linked to the Australian Cancer Database and the National Death Index data set. Of people aged 50–69 who were diagnosed with bowel cancer in 2006–2008, those without a previous NBCSP invitation had a 15% higher risk of dying from bowel cancer by 2012 than those diagnosed after a NBCSP invitation. The study found that bowel cancers diagnosed in non-invitees were, on average, more likely to be at a more advanced stage of cancer development. It is planned that this study will be updated with additional years of cancer incidence and mortality data in the next few years.
Where do I go for more information?
The BreastScreen Australia monitoring report 2012–2013, Cervical screening in Australia 2012–2013 and National Bowel Cancer Screening Program: monitoring report 2013–14 are available for free download.
6.3 Primary health care
In Australia, primary health care is typically the first contact an individual with a health concern has with the health system. 'Primary health' broadly encompasses health care that is not related to a hospital visit, and includes activities such as health promotion, prevention, early intervention, treatment of acute conditions, and management of chronic conditions (Department of Health 2015d).
Primary health services are delivered in settings such as general practices, community health centres, allied health practices, and through communication technology such as telehealth and video consultations. General practitioners (GPs), nurses, nurse practitioners, allied health professionals, midwives, pharmacists, dentists, and Aboriginal health practitioners are all considered primary health care professionals.
What is the scale and nature of primary health care delivery in Australia?
The vast majority of health care services in Australia are delivered in primary health care settings. For example, in 2014–15, there were:
 139 million non-referred encounters with GPs claimed through Medicare—from a total of 335 million out-of-hospital services. Other Medicare-funded out-of-hospital services included pathology and allied health such as physiotherapy (Department of Health 2015a). 17% increase from 119 million non-referred encounters with GPs in 2010–11.
 117 million medications were prescribed by a GP and a further 11 million medications were provided directly. to the patient (Britt et al. 2015). 17% increase from 100 million medications prescribed by GPs in 2010–11.
 3.5 million episodes of care were delivered by Aboriginal and Torres Strait Islander-specific services. 42% increase from 2.5 million episodes of care in 2010–11.
In comparison, Australian public hospitals provided around 18 million occasions of service for outpatient care in 2013–14 (excluding Victoria, which provided 3.7 million occasions of service in 2012–13). In 2013–14, public hospitals also provided 5.7 million episodes of admitted care (hospitalisations), and responded to 7.2 million emergency department presentations (see 'Chapter 6.11 Emergency department care').
Data from the Australian Bureau of Statistics (ABS) 2014–15 Patient Experience Survey showed:
- more than 4 in 5 people (83%) had consulted a GP at least once in the previous 12 months, and females were more likely than males to see a GP (88% and 78%, respectively)
- almost 1 in 5 (18%) saw three or more health professionals for the same health condition
- about 1 in 11 (8.7%) had seen an after-hours GP in the previous 12 months
- almost 1 in 2 (49%) had seen a dental professional in the previous 12 months (ABS 2015).
About $55 billion of total health expenditure was spent on primary health care in 2013–14. This equates to 38% of total health funding and was similar to spending on hospital services (40%).
How is primary health care in Australia changing?
The health care system in Australia faces a number of ongoing challenges, including the provision of effective and coordinated care, an ageing population, rising prevalence of some risk factors such as obesity and physical inactivity, and increased incidence of chronic disease and multiple chronic diseases (see 'Chapter 2.1 How does Australia's health system work?' and 'Chapter 3.3 Chronic disease and comorbidities').
During 2014–15, the Australian Government established the Primary Health Care Advisory Group and Primary Health Networks (PHNs) (Box 6.3.1) as part of its reform of the primary health care system. Priorities of the reform program include complex and chronic disease management; better recognition and treatment of mental health conditions; and greater connection between primary health care and hospital care.
Primary health care delivery, efficacy, accessibility and integration with other facets of the health care system may also be informed by and impacted upon by Australian Government-led reviews of:
- after-hours primary health care (Jackson 2014)
- services reimbursed under the Medicare Benefits Schedule (Department of Health 2015b)
- Pharmaceutical Benefits Advisory Committee Guidelines (Department of Health 2015c).
Box 6.3.1: Primary Health Networks
On 1 July 2015, the Australian Government established PHNs with the aim of increasing the efficiency and effectiveness of health services, and to ensure patients receive the right care in the right place at the right time.
The 31 PHNs replace the 61 Medicare Locals, and are aligned with Local Hospital Networks, to assist with the management of patients with complex or chronic conditions between the primary health care and hospital systems. PHNs work directly with GPs, other primary health care providers, secondary care providers, hospitals, and the broader community for the purpose of ensuring better outcomes for patients.
What is missing from the picture?
Primary health care has not experienced the same national focus on data capture, collation and reporting as other parts of the Australian health system. As a result, there is limited or no detailed information on primary health care consultations; national data for ambulance, aeromedical and allied health services; or state-funded community health activity data.
Australia's emerging e-Health system may provide an additional source of data to improve our understanding of primary health care; however, the extent of this contribution is not yet clear. Other means of improving primary health care information include improving GP surveys or improving the extraction and analysis of core GP data; making better use of existing national data in reporting at the PHN level, and collating existing data for reporting at the national level; and assessing the benefits of data linkage to report on patient journeys through the health system.
Where do I go for more information?
More information on primary health care in Australia is available in previous editions of this report, including Australia's Health 2014, which can be downloaded for free. In addition, further information is available at Primary health care.
References
ABS (Australian Bureau of Statistics) 2015. Patient experiences in Australia: summary of findings, 2013–14. ABS cat. no. 4839.0. Canberra: ABS.
Britt H, Miller GC, Henderson J, Bayram C, Harrison C, Valenti L et al. 2015. General practice activity in Australia 2014–15. General practice series no. 38. Sydney: Sydney University Press.
Department of Health 2015a. Annual Medicare statistics. Canberra: Department of Health.
Department of Health 2015b. Medicare Benefits Schedule Review. Canberra: Department of Health.
Department of Health 2015c. Pharmaceutical Benefits Advisory Committee Guidelines Review. Canberra: Department of Health.
Department of Health 2015d. Primary care. Canberra: Department of Health.
Jackson C 2014. Review of after hours primary health care. Report to the Minister for Health and Minister for Sport. Canberra: Department of Health.
6.4 Medicines in the health system
Medicines are used to treat, prevent and manage a wide range of health conditions. Some require prescriptions; others can be bought without a prescription over the counter at a pharmacy or through other retail outlets such as supermarkets. Data on medicines are mainly available for medications available through these community outlets and come from Australian Government subsidy schemes, the Pharmacy Guild of Australia and from market surveys for over-the-counter goods purchased from pharmacies and supermarkets. There is little information collected nationally regarding the medications provided to patients by hospitals, apart from information from the Australian Government Section 100 program which allows supply of restricted medicines under a special arrangement in public and private hospitals (Department of Health 2015b).
The Pharmaceutical Benefits Scheme (PBS) and the Repatriation Pharmaceutical Benefits Scheme (RPBS) are the two main government subsidy schemes for medicines. The PBS and RPBS specify a price for each listed pharmaceutical to be paid to the pharmacy when dispensing the medication. This price includes an amount to cover the services provided by the pharmacist, as well as the cost of the pharmaceutical. Consumers pay out-of-pocket costs up to a maximum copayment limit ($38.30 for general patients or $6.20 for concession card holders).
Medicines dispensed through the PBS and RPBS
The best available data on the dispensing of medicines comes from the PBS and RPBS and the most recent financial year with data on the total number of dispensed PBS and RPBS prescriptions is 2014–15. In 2014–15, there were nearly 225 million subsidised prescriptions dispensed under the PBS and RPBS that were priced over the maximum copayment limit. This was an increase of 21% from 185 million in 2004–05 (DHS 2015). In the same period, Australia's population increased from 20.0 million to 23.3 million people, a growth of 16%. About 91% of PBS services in 2014–15 were provided to concession card holders.
Some of the medicines dispensed under the PBS and RPBS are dispensed at a price less than the maximum copayment and do not attract a government subsidy. In 2013–14, the most recent year with data on these under-copayment medicines, there were 72 million prescriptions dispensed under the copayment level (Department of Health 2015a). This is in addition to the 210 million subsidised medicines in 2013–14. This was an increase from 62 million in 2012–13. Prior to 1 April 2012, data on PBS prescriptions priced below the copayment level were not collected by the Australian Government.
In 2013–14, of all drugs dispensed under the PBS or RPBS, including those where there was no subsidy from the Government, the most commonly dispensed groups of drugs were cholesterol-lowering drugs (atorvastatin and rosuvastatin); drugs treating gastro-oesophageal reflux disease (esomeprazole and pantoprazole); and antibiotics (amoxycillin, cephalexin, and amoxycillin with clavulanic acid) (see Figure 6.4.1). The analgesic paracetamol and the anti-hypertensive perindopril were also commonly dispensed. Metformin, a drug used for treatment of diabetes, was the ninth highest prescribed drug.
Figure 6.4.1: PBS and RPBS dispensed drug volumes, including under- and over-copayment prescriptions, 2013–14
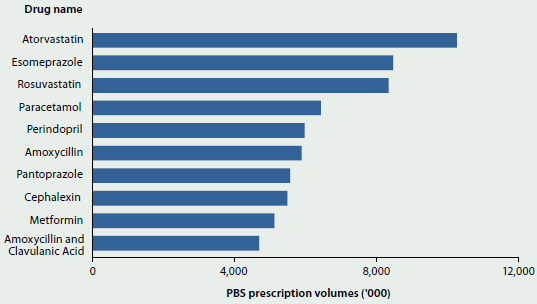
Source: Department of Health 2015a.
Cholesterol-lowering drugs also had the highest total expenditure in 2013–14 of all drugs under the PBS and RPBS (see Figure 6.4.2). Other high-expenditure drugs were those used for the treatment of severe arthritis (adalimumab and etanercept); the treatment of gastro-oesophageal reflux disease (esomeprazole); the management of respiratory disorders (fluticasone with salmeterol and tiotropium); the treatment of macular degenerative disorders (aflibercept and ranibizumab); and for long-acting control of blood sugar levels in diabetics (insulin glargine).
Figure 6.4.2: PBS and RPBS dispensed drug expenditure, including under- and over-copayment prescriptions, 2013–14
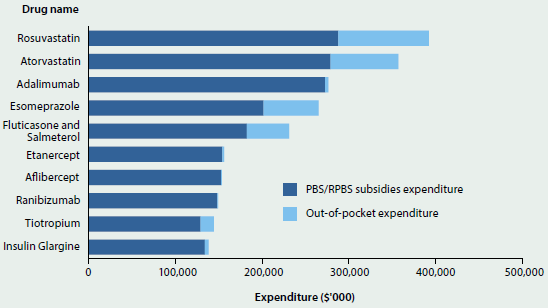
Source: Department of Health 2015a.
In 2013–14, more than half of the drugs subsidised through the PBS and RPBS—that is, drugs where the cost was above the maximum copayment level and there was a subsidy paid by government—affected the cardiovascular system (31%) or the nervous system (22%). In 2003–04, the subsidised drugs most supplied were also medicines for the cardiovascular system and nervous system, but these made up a lower proportion of the total subsidised medicines (30% and 18%, respectively) (Department of Health 2015a).
According to the Bettering the Evaluation and Care of Health survey of general practice, antibiotics and analgesics (used for pain relief) were the medicines most commonly prescribed by general practitioners in 2013–14. It is not known whether these were then dispensed through the PBS or RPBS. This pattern has not changed since 2003–04 (Britt et al. 2015).
Medicines expenditure
Expenditure on medicines grew in absolute terms, from $10.3 billion in 2003–04 to $19.8 billion in 2013–14, and as a proportion of recurrent health expenditure, from 11% in 2003–04 to 14% in 2013–14. The estimate of the expenditure on medicines includes expenditure by the Australian Government, such as expenditure on medicines subsidised through the PBS and RPBS, and non-government expenditure, which includes expenditure on below-copayment prescriptions. Apart from expenditure on medicines dispensed in hospitals under the Section 100 provisions, it does not include expenditure on medicines supplied in hospitals, which is regarded as hospital expenditure.
The growth in medications expenditure was mostly related to expenditure for non-PBS and non-RPBS subsidised medicines, referred to as All other expenditure on medicines, which is mostly non-government expenditure such as expenditure on over-the-counter medicines and below-copayment prescriptions. However, it includes some government expenditure such as incentive payments to pharmacies to process prescription subsidies using PBS Online, and payment for medicines provided under the Life Saving Drugs program. All other expenditure on medicines rose from 4.2% of recurrent health expenditure in 2003–04 to 6.7% in 2013–14. PBS and RPBS subsidies reduced from 7.4% of recurrent health expenditure in 2003–04 to 6.7% in 2013–14 (Figure 6.4.3).
In real terms, PBS and RPBS expenditure generally increased since 2003–04, but decreased recently, from $9.1 billion in 2011–12 to about $9 billion in 2013–14.
Lower expenditure does not necessarily mean fewer prescriptions dispensed. The volumes of prescriptions subsidised increased from 201 million government-subsidised medicines dispensed in 2011–12 to 210 million in 2013–14.
Figure 6.4.3: Proportion of recurrent health expenditure on medications, constant prices, 2003–04 to 2013–14
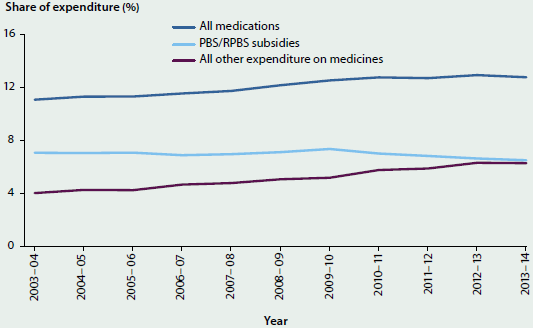
Source: AIHW health expenditure database.
What is missing from the picture?
In most cases where a medicine is dispensed there is little information captured and collated at a national level on the purpose for which it was prescribed, whether the medicine was taken, and the outcome that occurred from use of the medicine. This information at the patient level would greatly enhance monitoring of the use of medicines in Australia.
Nationally collected information on all medicines provided through hospitals would add extra understanding of the use of medicines in Australia and expenditure on them.
Where do I go for more information?
For more information on medicine statistics in Australia, visit the Medicare Statistics website.
References
Britt H, Miller GC, Henderson J, Bayram C, Harrison C, Valenti L et al. 2015. General practice activity in Australia 2013–14. General practice series no. 38. Sydney: Sydney University Press.
DHS (Department of Human Services) 2015. Pharmaceutical Benefits Schedule group reports. Canberra: DHS.
Department of Health 2015a. Expenditure and prescriptions twelve months to 30 June 2014. Canberra: Department of Health.
Department of Health 2015b. Section 100—items available under special arrangement. Canberra: Department of Health.
6.5 Using data to improve the quality of Indigenous health care
For nearly a decade now, the AIHW has collected data from Aboriginal and Torres Strait Islander primary health care organisations for national performance reporting. Over this time there have been major developments in the processes used to collect the data, as well as an expansion of the content and scope of the data collection.
The national data are collected directly from Indigenous health care providers and there is now a rich source of information on the quality of health care from the organisation level upwards. These data allow primary health care organisations to track their performance over time, and for comparing the performance of organisations against peers. This type of data is increasingly being used to drive improvements in the quality of health care provided to Aboriginal and Torres Strait Islander Australians.
This feature article describes some of the national data developments in the Indigenous primary health care sector and how these data are being used. It also includes two case studies from the sector that show how data has been used to improve the quality of health care.
Indigenous primary health care data
Primary health care is generally the first point of contact that people have with the health system and is also the gateway to access other health services. It includes most services not delivered by hospitals, and encompasses a range of providers and services across public, private and the non-government sectors (AIHW 2014a). There are, however, only limited data available on the delivery of primary health care in Australia. An exception to this is the Indigenous primary health care sector where regular and comprehensive performance data are collected.
It is particularly important that Indigenous Australians have good access to primary health care services because of their poorer health (AIHW 2011). The Australian Government provides funding to organisations to provide primary health care to Indigenous Australians. Many of these organisations are Aboriginal Community Controlled Health Organisations which provide access to a range of primary health care services, including prevention, diagnosis, treatment and referral, in one location.
At the national level, organisations funded by the Department of Health to provide primary health care to Aboriginal and Torres Strait Islander people are required to report six-monthly organisation-level data for the national key performance indicators (the nKPIs) for Aboriginal and Torres Strait Islander primary health care. There are similar efforts in place for organisations funded by state and territory governments, for example the Northern Territory Aboriginal Health Key Performance Indicators (NTAHKPIs) which have been in place since July 2009. This means that data are regularly collected about how individual services are performing, along with comparative data from other services. These data have increasingly been used to improve the quality of health care provided to consumers at the service level through formal continuous quality improvement (CQI) or other quality improvement processes (Box 6.5.1).
Box 6.5.1: Continuous quality improvement in Aboriginal and Torres Strait Islander primary health care
Continuous quality improvement is a process of using objective information at the health service level to understand and improve the quality of care that clients are receiving. It is an iterative process that includes the collation and analysis of patient and provider data to measure service level activities, and the identification of needs and gaps in these activities by comparing these data against an agreed set of standards.
The Plan-Do-Study-Act cycle is a key component of CQI, a process where health services assess their present service delivery against objective criteria, plan and implement changes, and then reassess their progress. This cycle allows ongoing improvements to specifically meet the priority health outcomes identified by individual services.
There are a number of CQI initiatives operating in the Indigenous primary health care sector at national, state/territory and regional levels, driven from the state, territory and national governments and from frontline services upwards. At the national level there are the Australian Primary Care Collaboratives, One21seventy and Healthy for Life initiatives, while state-based initiatives include the Northern Territory CQI Strategy and the Queensland Aboriginal and Torres Strait Islander Health Council Achieving Clinical Excellence program.
The uptake of CQI initiatives in Aboriginal and Torres Strait Islander primary health care has, however, not been uniform across Australia. Recognising these disparities, the Department of Health commissioned a first report that outlined the current state of play in relation to CQI activity and evidence, and identified barriers and linkages relevant to the development of a national CQI framework (Lowitja 2014). A second stage, involving the development of the national CQI framework for Aboriginal and Torres Strait Islander primary health care, is currently under way.
Sources: Bailie et al. 2007; Lowitja Institute 2014.
The nKPIs
The nKPIs are a set of indicators developed under the National Indigenous Reform Agreement. The nKPIs focus on maternal and child health, and chronic disease management, and were designed to support the Council of Australian Governments Closing the Gap targets: to close the gap in life expectancy within a generation and to halve the gap in mortality rates for Indigenous children under 5 within a decade. The nKPI data are collected from organisations that provide primary health care to Aboriginal and Torres Strait Islander people. The AIHW is responsible for the ongoing collection and reporting of these indicators.
The nKPIs were developed based on the experience of the Healthy for Life program (HfL), and many of the initial nKPIs had forerunners in the HfL Essential Indicators (Box 6.5.2). They embedded the concept of CQI in their design, with a focus on measuring and improving health service processes and outcomes that were specifically related to the quality of care provided to clients.
Box 6.5.2: The Healthy for Life program
The HfL program was introduced by the Australian Government in 2005–06 to improve the health of Aboriginal and Torres Strait Islander mothers, babies and children; to improve the early detection and management of chronic disease; and to reduce the incidence of adult chronic disease. HfL pioneered the collection of national health data specifically for CQI processes and to improve health care delivery (AIHW 2013).
An external evaluation of the HfL program, conducted by Urbis in 2009, found considerable evidence of a wide range of improvements that services had made to health service systems, practices and service delivery as a result of HfL funding. A significant legacy for most participating services was the improvement in their capacity to collect, report and act on good quality data that reflected the processes and outcomes of their service (Urbis 2009).
The evaluation report noted that HfL provided a model for other program areas in aggregating local-level data for national reporting and establishing reporting frameworks that demonstrate tangible population-level outcomes (Urbis 2009). The evaluation found that the program had led to a wide range of service quality improvements such as:
- improved physical access to care—including through transport services and visiting community members in their homes, in hospitals and in schools
- new approaches to care delivery—including targeted clinics such as diabetes clinics, peer support programs and other initiatives that support healthy living
- new approaches to care planning and coordination—including new program areas, individualised care planning, internal coordination activities and improved relationships with other agencies (Urbis 2009).
Sources: AIHW 2013; Urbis 2009.
The nKPIs are categorised as either process-of-care indicators or outcome indicators (for more information about the indicators see the AIHW nKPI website.) The process-of-care indicators, in particular, reflect activities that are largely under the control of organisations, for example Birthweight recorded or Smoking status recorded (AIHW 2015c). The number of indicators in the nKPI collection increased progressively, from 11 in the first reporting round in June 2012 to 21 indicators in the December 2014 reporting round.
An electronic data extraction tool extracts aggregate nKPI data directly from the health organisations' clinical information systems and this is submitted to OCHREStreams, a web portal from which the AIHW can access the data. The AIHW then works with health care organisations to improve their data quality, in a process of data checking and resubmission, before it is used to meet various reporting requirements.
The number and scope of services providing nKPI data has increased over time. The first collection round only included services participating in the HfL program (about 90 services) and in January 2013 this was expanded to include all Indigenous primary health services funded by the Australian Government. Services funded by the Northern Territory Government were included in the collection from December 2014, when 233 services provided nKPI data (Table 6.5.1).
| Governance arrangement | NSW/ ACT |
Vic/ Tas |
Qld | WA | SA | NT | Total | % |
|---|---|---|---|---|---|---|---|---|
| Aboriginal and Torres Strait Islander Community Controlled Health Organisations | 40 | 26 | 21 | 17 | 10 | 20 | 134 | 57.5 |
| State and territory governments | 13 | 2 | 3 | 5 | 6 | 54 | 83 | 35.6 |
| Medicare Locals(a) | 10 | 1 | 2 | 0 | 0 | 0 | 13 | 5.6 |
| Other non-government | 0 | 1 | 2 | 0 | 0 | 0 | 3 | 1.3 |
| Total | 63 | 30 | 28 | 22 | 16 | 74 | 233 | 100.0 |
- Medicare Locals were abolished in 2014 and replaced by Primary Health Networks.
Source: AIHW nKPI collection.
Reports provided to organisations
The AIHW provides organisations that submit data with a written report and PowerPoint presentation specifically for their service. These show the data for the relevant reporting period, time series data and national, state/territory and regional averages for use in comparing and assessing their own performance (Figure 6.5.1). This information allows services to track their performance relative to others and over time. It can be readily used by the organisation for a range of purposes including CQI, staff training and as input for Board or executive meetings.
Tracking organisations' performance
The AIHW produces national reports and presentations based on the aggregated nKPI data (AIHW 2014b, 2014c, 2015c). The national reports show that performance on most of the nKPIs has improved over time, but there is a wide variation in organisations' performance for most indicators.
For example, the national nKPI reports include graphs of where individual services fit within the national distribution for all process-of-care indicators (Figure 6.5.2). The performance of each organisation is represented as a point on the graph and this can range widely depending on the indicator and what proportion of clients have been provided with a particular service. The shape of the curve reflects this distribution and the three lines show how the performance distribution has changed over time, relative to the first reporting period.
Figure 6.5.1: Examples of nKPI organisation-level and comparison data
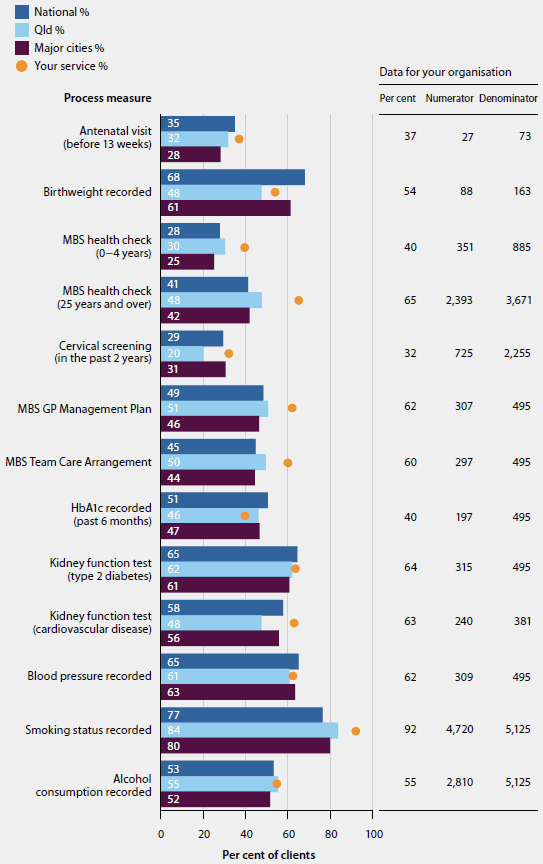
Figure 6.5.2: Distribution of performance of all organisations on selected nKPI indicators
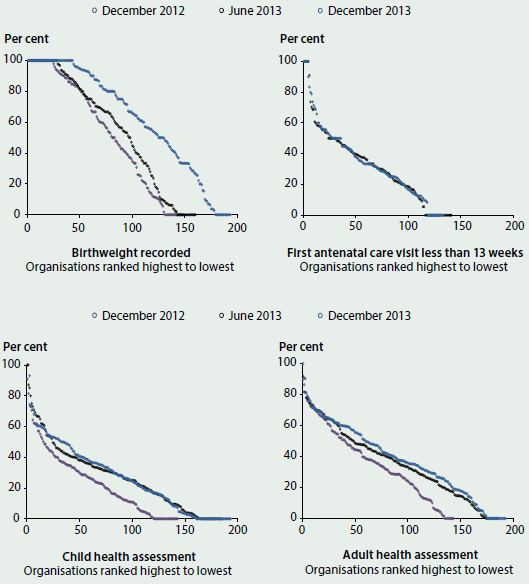
Note: Organisation performance can range from 0 to 100% on each nKPI for the relevant reporting period, with 100% being the optimal score. The performance of each organisation is represented by a dot on the graph for the relevant nKPI.
Source: AIHW 2014c.
Analyses of the variation in performance over time showed that clients at organisations that had participated in HfL—the national CQI program—had better results than clients at other organisations. The clients attending HfL organisations had better results than those attending non-HfL organisations on eight measures, while clients at the non-HfL organisations had better results on only three measures. Similarly, clients at organisations in jurisdictions with a history of using CQI processes (that is, the Northern Territory and Queensland) had better results than clients at organisations that did not use these processes (Figure 6.5.3) (AIHW 2014b).
Figure 6.5.3: Comparison of organisation performance on nKPIs over three reporting periods, June 2012–June 2013
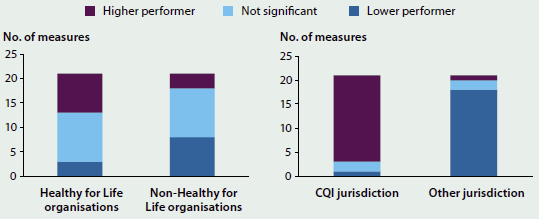
Note: Graphs compare the performance of the two types of organisations (HfL and non-HfL; CQI and other jurisdiction) and show the number of measures where they performed higher or lower than each other.
Source: AIHW 2014b.
Case studies
Northern Territory Department of Health
The Northern Territory Aboriginal Health Forum developed the NTAHKPIs for monitoring service delivery and improvement in maternal and child health programs, as well as early intervention and chronic disease management. Making these data visible has been a critical element of service improvement for health care services delivered by Aboriginal Community Controlled Organisations as well as for the Northern Territory Government.
The indicators are used by policy and program staff to identify areas of concern and target areas where improvements can be made across the Territory. Strategies are then put in place to address these. Health care services with strong performance in a particular area can also be identified, and the strategies they used to obtain these results are shared with other services.
In the area of improving childhood iron deficiency and anaemia, for example, persistent high rates were noted in the NTAHKPIs. The data showed the range of performance across organisations and indicated that improvements in service delivery were possible. A combination of strategies was used to address the issue:
- The Northern Territory Department of Health developed and led a more systematic approach and monitored progress with monthly data
- the Northern Territory CQI Collaborative led by Aboriginal Medical Services NT held forums bringing together clinicians, managers and policymakers to learn from successful services and to train and motivate staff
- a regional approach was used in Katherine with three collaborating Aboriginal health services and in East Arnhem through a clinical advisory group.
The outcome of these strategies could then be tracked through the indicator results for anaemia. These showed that there was a large increase across organisations in the proportion of children assessed (with the range 29% to 96% in 2012–13 rising to 49% to 96% in 2014–15) and a decline in the proportion of Aboriginal children recorded as being anaemic (the range 18% to 41% in 2012–13 falling to 11% to 30% in 2014–15) (Figure 6.5.4).
Figure 6.5.4: Performance indicator results for anaemia, Northern Territory
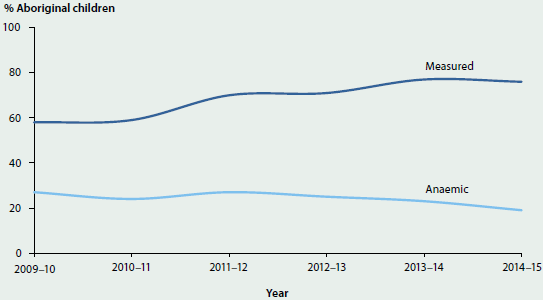
Source: NT Department of Health presentation, unpublished.
The Goondir Health Service Dashboard
Goondir Health Service has developed its own visually appealing and easy-to-use electronic reporting system to improve service delivery. The service is located in regional Queensland and operates multiple clinics across 160,000 kilometres. The Clinical Performance Dashboard is a service-planning and management tool that brings together three types of data: clinical data from the patient information recording system, organisational data from the quality management system, and financial data. It provides clinicians, managers and the executive with up-to-date data to inform clinical and management decisions (Hansford 2015).
The dashboard provides different levels of information, beginning with high-level summary data, and then allows users to 'drill down' to more detailed views of key measures. The first level includes measures such as patient numbers, appointments, services delivered and performance indicator results (Figure 6.5.5). Large ticks are used to indicate where the service is on target or improving and crosses indicate areas that are not doing well.
Figure 6.5.5: Goondir Health Service Clinical Performance Dashboard manager’s snapshot
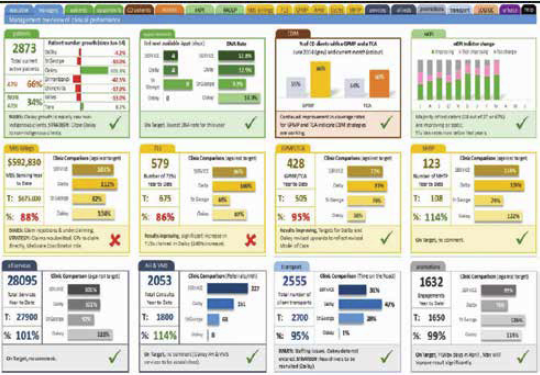
Note: This image is a low resolution screenshot included to provide an overall impression of the dashboard.
Source: Hansford 2015.
Drilling down further to the performance data, for example, a dashboard summary graph shows trends over time in the number of performance indicators that are improving or not, and then provides a list of the indicators where the service is performing poorly. For example, the health service manager could check how they are performing on smoking rates or the proportion of overweight/obese clients. With this information, health service managers can assess and develop strategies, such as targeted health-promotion activities, to improve performance against these indicators (Hansford 2015).
What is the AIHW doing?
There is an increasing interest in using data to improve health outcomes at the local level, where there can be large variations in the quality of health care delivered. The Indigenous primary health care sector is leading the way in the use of organisation-level data to improve the quality of health care through a variety of different quality improvement strategies.
As detailed in this feature article, the nKPIs contribute to these processes by providing regular standardised indicators and comparison data that can be used by organisations to assess their performance. This is in line with the AIHW's strategic priority to provide value-added feedback to data providers (AIHW 2015a), and its support for individual organisations to improve the quality of their data—and, in turn, the quality of the health care they provide.
Over time, the scope of the nKPI collection is also likely to be widened to include state- and territory-funded services, in addition to the Northern Territory. This will mean better quality data about a wider range of primary health care services provided to Aboriginal and Torres Strait Islander Australians.
Where do I go for more information?
More information about the nKPIs available at Indigenous Australians health and welfare publications.
Reports including National Key Performance Indicators for Aboriginal and Torres Strait Islander primary health care: first national results for June 2012 to June 2013 and National Key Performance Indicators for Aboriginal and Torres Strait Islander health care: results from December2014 available for free download.
References
AIHW (Australian Institute of Health and Welfare) 2011. Access to health services for Aboriginal and Torres Strait Islander people. Cat. no. IHW 46. Canberra: AIHW.
AIHW 2013. Healthy for Life: results for July 2007–June 2011. Cat. no. IHW 84. Canberra: AIHW.
AIHW 2014a. Australia's health 2014. Australia's health series no. 14. Cat. no. AUS 178. Canberra: AIHW.
AIHW 2014b. National Key Performance Indicators for Aboriginal and Torres Strait Islander primary health care: first national results June 2012 to June 2013. National key performance indicators for Aboriginal and Torres Strait Islander primary health care no. 1. Cat. no. IHW 123. Canberra: AIHW.
AIHW 2014c. National Key Performance Indicators for Aboriginal and Torres Strait Islander primary health care: results from December 2013. National key performance indicators for Aboriginal and Torres Strait Islander primary health care. Cat. no. IHW 146. Canberra: AIHW.
AIHW 2015a. Aboriginal and Torres Strait Islander health organisations: Online Services Report—key results 2013–14. Aboriginal and Torres Strait Islander health services report no. 6. IHW 152. Canberra: AIHW.
AIHW 2015b. Australian Institute of Health and Welfare Corporate Plan 2015–16 to 2018–19. Cat. no. AUS 194. Canberra: AIHW.
AIHW 2015c. National Key Performance Indicators for Aboriginal and Torres Strait Islander primary health care: results from December 2014. National key performance indicators for Aboriginal and Torres Strait Islander primary health care no. 3. Cat. no. IHW 161. Canberra: AIHW.
AIHW 2015d. The nKPI data collection: data quality issues working paper 2012–2014. Cat. no. IHW 153. Canberra: AIHW.
Bailie R, Griffin J, Kelaher M, McNeair T, Percival N, Laycock et al. 2013. Sentinel sites evaluation: final report. Report prepared by Menzies School of Health Research for the Australian Government Department of Health. Canberra: Department of Health.
Bailie RS, Si D, O'Donoghue L & Dowden M 2007. Indigenous health: effective and sustainable health services through continuous quality improvement. Medical Journal of Australia 186(10):525–27.
Hansford G 2015. How one AMS is closing the gap—the power of data. Paper presented to the 13th National Rural Health Conference, Darwin 24–27 May 2015.
Lowitja Institute 2014. Recommendations for a national CQI Framework for Aboriginal and Torres Strait Islander Primary Health Care. Carlton, Victoria: Lowitja Institute.
Urbis 2009. Evaluation of the Healthy for Life Program: final report. Prepared for: The Office for Aboriginal and Torres Strait Islander Health Department of Health and Ageing 30 June 2009.
6.6 Indigenous Australians' access to health services
Access to health services is an important contributor to health and wellbeing. It is a particularly important influence on the health status of Aboriginal and Torres Strait Islander people, given their overall poorer health and the greater need for health care compared with the non-Indigenous population.
Measuring access to health care is complex, due to its inherently multidimensional nature. 'Access' incorporates measures of physical proximity to services, such as distance or drive time (availability); financial aspects (affordability); and cultural aspects (acceptability). Ideally, assessment of access also includes consideration of need for care. In practice, however, much of the available data on usage of health services by different populations does not fully account for differences in health care needs. Services may be mainstream or targeted to a specific population group (such as specialist Indigenous services). Access to primary health care services is key because it is usually an individual's first point of contact with the health system.
Although three-quarters of the Indigenous population live in Major cities and regional areas where mainstream health services are typically located, these services are not always accessible, for geographic, social and cultural reasons (AIHW 2014b). Indigenous-specific health services are therefore important providers of comprehensive primary health services for Indigenous Australians.
Medicare data provide information on general practitioner (GP) and specialist services claimed for Indigenous Australians. These services can be delivered through mainstream or Indigenous-specific health services, but not all services delivered by Indigenous primary health care services can be claimed through Medicare.
As there are currently no comprehensive data on Indigenous Australians accessing health services, this chapter reviews four selected aspects related to access: (i) an AIHW-developed small-area-level measure of access to primary health care services relative to the distribution of the Indigenous population (ii) health services provided as Indigenous-specific primary health care services, funded by the Australian Government; (iii) health services for Indigenous Australians claimed through Medicare, including selected specialist services; and (iv) hospital services used by Indigenous Australians.
Access to primary health care services relative to population distribution
Identifying areas where access is poor can help to inform policy decisions and planning of health services. The AIHW has mapped access to primary health care services (Indigenous-specific primary health care services and other GP-based primary health services) relative to the distribution of the Indigenous population (AIHW 2015b). This has revealed areas where critical primary health care service gaps exist for the Indigenous population (Figure 6.6.1).
Figure 6.6.1: Areas where Indigenous Australians have poor access to primary health care services, by SA2, and location of services, 2012–13 and 2013
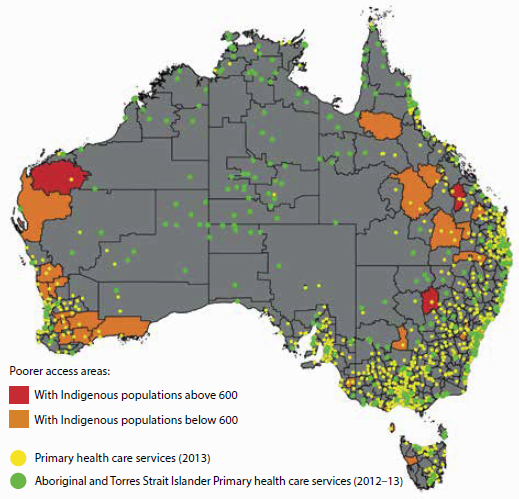
Source: AIHW 2015b.
Access to services was measured in terms of: (a) physical access to Indigenous-specific primary health care services based on drive time to services; and (b) physical access to GP services in general, relative to the per capita need for primary health care. The need for primary health care was estimated using demographic and socioeconomic characteristics of the local population (AIHW 2014a).
This work shows that, overall, Australian Government-funded Indigenous-specific primary health care services appear to be well positioned relative to the geographic distribution of the Indigenous population, and relative to the distribution of other GP services. There are, however, several areas where the Indigenous population has very limited access to both Indigenous-specific services and GP services in general.
In total, 37 Statistical Areas Level 2 (SA2—medium-sized areas) were identified as service-gap areas, with no Indigenous-specific primary health care services within one hour's drive and with poor access to GP services in general. These service-gap areas are highlighted in red and orange in Figure 6.6.1 (with other areas shown in grey).
- Many of these areas are in Remote and Very remote areas of Queensland and Western Australia.
- Ten of these service-gap areas have an Indigenous population of 600 or more, which are areas shaded in red in the map. (Only three of these red areas are large enough to be clearly seen. Of the remaining seven small areas, six are in Queensland and one is in New South Wales. See AIHW 2015b for details of these locations).
See also 'Chapter 6.7 Spatial variation in Indigenous women's access to maternal health services', which presents more detailed analyses of access to that sub-category of health services.
Use of Indigenous-specific primary health care services
A growing network of Indigenous-specific primary health care services is administered and run by a combination of Aboriginal Community Controlled Health Organisations, Primary Health Network services, other non-government organisations, and state/territory local health services. The clients of these services are predominantly, but not exclusively, Aboriginal and Torres Strait Islander people.
In 2014–15, there were 203 Indigenous-specific primary health care organisations that reported data on their total clients, contacts made, and episodes of care. They provided services to 434,600 clients through over 5 million contacts—an average of 12 contacts per client. Over three-quarters (79%) of these clients identified as Aboriginal and Torres Strait Islander people. Over time, the episodes of health care provided to clients of these organisations have almost tripled, from 1.2 million in 1999–2000 to 3.5 million in 2014–15 (AIHW 2016b).
These services provided clinical health care; population health programs; child and maternal health services; screening programs and health checks; access to allied health and specialist services; group activities; health-related community services; and substance-use treatment and assistance.
The national key performance indicators (nKPIs) for Aboriginal and Torres Strait Islander primary health care provide information on the process-of-care and health outcomes for clients attending Indigenous-specific primary health care organisations funded by the Australian and state and territory governments. Altogether 24 nKPIs have received in-principle approval from the Australian Health Ministers' Advisory Council for regular reporting, and data on 22 nKPIs were reported by 233 primary health care organisations for the December 2014 period. These indicators focus on maternal and child health, preventative health and chronic disease management. See also 'Chapter 6.5 Using data to improve the quality of Indigenous health care'.
Use of selected health services claimed through Medicare
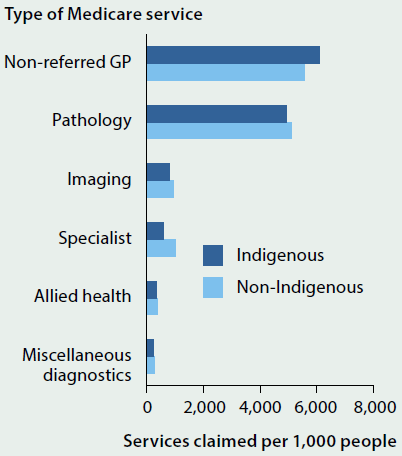
Medicare data for 2013–14 showed that over 3.6 million GP services had been claimed through Medicare for Indigenous Australians in that year, at an average rate of 6,115 GP services per 1,000 population.
The number of GP services claimed per 1,000 Indigenous Australians was 10% higher than that for non-Indigenous Australians, but claim rates for specialist services were 43% lower for Indigenous Australians (Figure 6.6.2). The lower claim rates for specialist services may be explained partly by the differences in the relative population distributions of the Indigenous and non-Indigenous populations across urban, regional and remote areas. Access to specialist services is generally lower in more remote areas, and since a greater proportion of the population of remote areas are Indigenous (compared with other areas) this difference affects their overall access to specialist services.
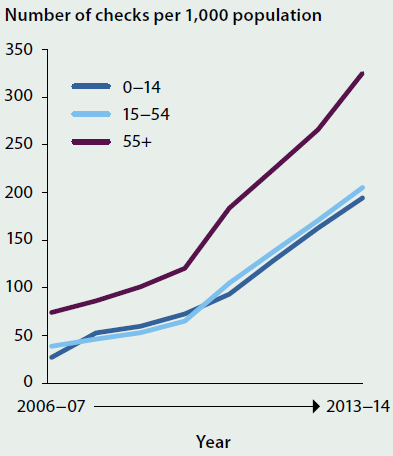
The uptake of the Medicare Benefits Schedule (MBS) item for annual health assessments of Indigenous Australians has increased significantly over time (Figure 6.6.3). In 2013–14, primary health care providers carried out:
- 47,400 Indigenous child health checks—a rate of 194 checks per 1,000 Indigenous children aged 0–14
- 80,600 Indigenous adult health checks—a rate of 205 checks per 1,000 Indigenous Australians aged 15–54
- 22,300 Indigenous older-person health checks—a rate of 325 checks per 1,000 Indigenous Australians aged 55 and over.
Figure 6.6.2: Age-standardised rate of Medicare services claimed per 1,000 people, by Indigenous status, 2013–14
Source: AIHW 2015a.
Figure 6.6.3: MBS health checks, Indigenous Australians, by age, 2006–07 to 2013–14
Source: AIHW 2015a.
Hospital services
Indigenous Australians are relatively high users of hospital services, the majority of which are accessed via public hospitals.
- In 2013–14, there were about 408,000 hospitalisations reported for Indigenous Australians, accounting for 4.2% of all hospitalisations.
- After adjusting for differences in age structure, Indigenous Australians were 2.3 times as likely as other Australians to be hospitalised (rates of 896 and 384 per 1,000 population, respectively). Much of this difference (86%) was due to the substantially higher rate of hospitalisations for dialysis among Indigenous Australians (with individuals typically undergoing dialysis treatment multiple times a week).
- Excluding dialysis, Indigenous Australians were hospitalised at 1.2 times the rate of other Australians.
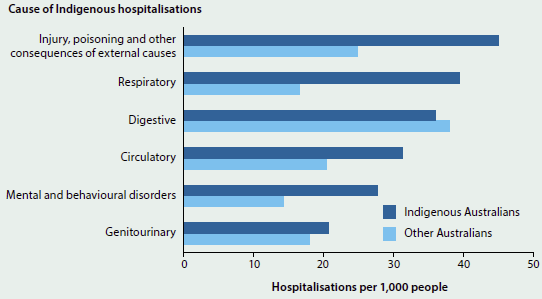
More detailed data on the main causes of hospitalisation for Indigenous Australians in 2013–14, and comparative cause-specific hospitalisation rates (age-standardised) with other Australians, are in Figure 6.6.4.
Figure 6.6.4: Age-standardised rates of the leading causes of Indigenous hospitalisation (excluding dialysis and pregnancy/ childbirth), and comparative rates for other Australians, 2013–14
Source: AIHW 2016a based on analysis of National Hospital Morbidity Database.
- In 2013–14, the leading cause of hospitalisation for Indigenous Australians was injury and poisoning (external causes) (46 hospitalisations per 1,000 people).
- The largest relative difference in hospitalisation rates between Indigenous and other Australians was for respiratory system diseases (2.2 times as high for Indigenous as for other Australians).
- The hospitalisation rate for digestive system diseases was higher for other Australians.
What is missing from the picture?
Comprehensive and complete information on the use of primary health care services or specialist health services by Aboriginal and Torres Strait Islander people is not currently available. For example, primary health care services funded only by the state and territory governments do not report regularly on their activities and on the number of their Indigenous clients (apart from the Northern Territory). There is incomplete information on outreach services (which supplement other primary and specialist health services) operating in some parts of Australia. Complete details on Indigenous Australians' use of mainstream health services are also affected by incomplete identification of Indigenous status in the service records. It is therefore not possible to report reliably on the full range of Indigenous patient journeys through the health system.
Australia's emerging e-health system may provide an additional source of data to improve our understanding of the use of primary health care services by both the Indigenous and total Australian populations—however, the extent of e-health records contributing to secondary analyses of data is not yet clear.
Where do I go for more information?
More information on Indigenous people's access to health services can be found on the AIHW's Indigenous Observatory.
More information on geographical variation in Indigenous peoples access to primary health care services can be found in these two AIHW reports: Spatial variation in Aboriginal and Torres Strait Islander people's access to primary health care, and Access to primary health care relative to need for Indigenous Australians.
References
AIHW (Australian Institute of Health and Welfare) 2014a. Access to primary health care relative to need for Indigenous Australians. Cat. no. IHW 128. Canberra: AIHW.
AIHW 2014b. Australia's health 2014. Australia's health series no. 14. Cat. no. AUS 178. Canberra: AIHW.
AIHW 2015a. Aboriginal and Torres Strait Islander Health Performance Framework 2014 report: detailed analyses. Cat. no. IHW 167. Canberra: AIHW.
AIHW 2015b. Spatial variation in Aboriginal and Torres Strait Islander people's access to primary health care. Cat. no. IHW 155. Canberra: AIHW.
AIHW 2016a. Admitted patient care 2014–15: Australian hospital statistics. Health services series no. 68. Cat. no. HSE 172. Canberra: AIHW.
AIHW 2016b. Aboriginal and Torres Strait Islander health organisations: Online Services Report—key results 2014–15. Aboriginal and Torres Strait Islander health services report No. 7. IHW 168. Canberra: AIHW.
6.7 Spatial variation in Indigenous women's access to maternal health services
Introduction
The gap between the health of Aboriginal and Torres Straits Islander children and non-Indigenous children begins before birth, with Indigenous babies significantly more likely to have been exposed to tobacco smoke in utero, to be born pre-term, and to have a low birthweight (weighing less than 2,500 grams at birth) (AIHW 2015a). Inequalities continue throughout early childhood for Aboriginal and Torres Strait Islander children, with higher mortality rates and higher rates of illness and poor health (see 'Chapter 5.2 Trends and patterns in maternal and perinatal health' and 'Chapter 6.6 Indigenous Australians' access to health services').
The factors that contribute to poor infant and child health are complex. These factors include maternal health (for example, maternal weight, pre-existing health conditions); maternal behaviours (smoking and alcohol consumption during pregnancy, maternal nutrition and breastfeeding); maternal age; social determinants (socioeconomic position and education); and access to health services (such as antenatal care and child health services). Ensuring that Aboriginal and Torres Strait Islander families have access to high quality, evidence-based and culturally competent maternal and child health care services has been the goal of a number of state, territory and Australian Government programs and is an important policy issue.
This article highlights the findings from a series of analyses the AIHW has been undertaking which are aimed at identifying geographic areas with potential gaps in services for Aboriginal and Torres Strait Islander Australians (AIHW 2015b), by focusing on Indigenous women's spatial access to two broad types of maternal health services: birthing units within hospitals and antenatal/postnatal services.
Four types of antenatal/postnatal care services are analysed:
- those available from hospitals with a birthing unit
- those provided by Indigenous-specific primary health care services (ISPHCS)
- those available at Royal Flying Doctor Service (RFDS) clinics
- those provided by general practitioners (GPs).
Box 6.7.1 presents an overview of the methodology used to calculate spatial access to maternal health services.
Box 6.7.1: Measuring the spatial accessibility of services
The spatial accessibility of services in this report is measured as the percentage of the relevant population in an area who are within an hour's drive of a particular type of service. Thus, access is measured in terms of physical access only—although even if services are physically accessible, they may not be culturally appropriate or financially accessible or may not be able to provide services when needed due to capacity issues.
The data are presented at the SA2 level (Statistical Area Level 2), which forms part of the Australian Statistical Geography Standard, developed by the Australian Bureau of Statistics (ABS) for the collection and dissemination of geographic statistics. There are 2,214 SA2 areas, with populations between 3000 and 25,000. SA2s are contiguous and cover the entire landmass of Australia. Wherever possible, the SA2 boundaries were based on officially gazetted suburbs and localities. In urban areas SA2s largely conform to whole suburbs and combinations of whole suburbs, while in rural areas they define functional zones of social and economic links.
The percentage of the SA2 population within a one-hour drive from a particular type of service was calculated using several steps (see AIHW 2015b for detailed information on the methodology). The address for each service location was geocoded to a point location then geospatial software was used to calculate the drive time from the manually adjusted population centroid (the point location in an area that aims to represent where people live) of each SA1 (Statistical Area Level 1, the smaller geographic areas that aggregate to an SA2). These results were then used to calculate the proportions of the population within SA2s who were inside or outside a one-hour drive. Women and children living in migratory zones or unable to be classified into an SA2 were excluded from these analyses.
Where do Indigenous women and children live?
The spatial distribution of Aboriginal and Torres Strait Islander women of child-bearing age and children is a critical issue for the development and delivery of a range of maternal and child health services.
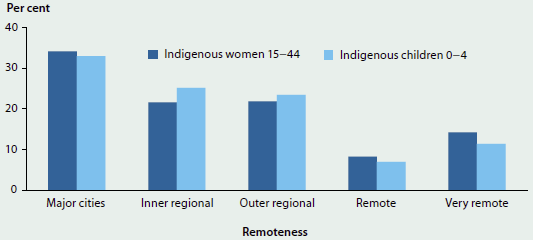
There are an estimated 124,000 Aboriginal and Torres Strait Islander women of child-bearing age in Australia (ages 15–44), and each year approximately 10% give birth (Hilder et al. 2014). There are also just over 67,000 Indigenous children under 5 years of age. Figure 6.7.1 shows that, while the highest proportions of Indigenous women and young children live in Major cities, over one-fifth (22%) of Indigenous women of child-bearing age live in Remote or Very remote areas, as do nearly one-fifth (18%) of Indigenous children under age 5.
This population distribution is important because distance often poses significant challenges for workforce recruitment and health service delivery in areas outside cities, particularly in areas in which populations are widely dispersed or isolated. While service availability is less of an issue in urban areas, ensuring that these services are culturally appropriate and accessible to Aboriginal and Torres Strait Islander women is essential for effective care.
Figure 6.7.1: Distribution of Indigenous women aged 15–44 and Indigenous children aged 0–4, by remoteness, 2011
Spatial distribution of hospitals with a birthing unit
Access to high quality, evidence-based and culturally competent maternity care close to where women live is one of the goals of the National Maternity Services Plan (AHMAC 2011), and is expected to help close the demonstrated gap in infant and child health outcomes between Indigenous and non-Indigenous babies and children.
The geographic supply and accessibility of hospitals offering birthing services is a critical issue for Aboriginal and Torres Strait Islander women and families, and for residents of rural and remote areas in general. In rural and remote areas where no birthing facilities are available, women assessed at normal risk of poor outcomes are often required to relocate to an urban or regional hospital location at 36–38 weeks of pregnancy. Those at higher risk—because of prior pre-term delivery, stillbirth, or baby born of low birthweight; maternal age; obesity; or because of identified medical conditions—may need to spend weeks away from home and family. Available data show that Indigenous mothers are 1.6 times as likely to be obese as non-Indigenous mothers and are also more likely to have higher rates of pre-existing hypertension and pre-existing diabetes (AIHW 2015a).
From a woman's and a family's perspectives, having to travel long distances to give birth can be costly and disruptive to life in general, as well as to continuity of care. For Aboriginal and Torres Strait Islander women, there are also additional stressors such as being separated from land and community, and the cultural impact of not giving birth on country; language barriers; isolation; fear of asking for culturally appropriate birthing options; and the need to negotiate an unfamiliar health system (Williams 2011; Wyndow & Jackiewicz 2014). The impact of these factors is that some women may go back to their communities prior to birth and require emergency medical evacuation (Williams 2011), while others delivering in hospitals far from where they live may be more likely to discharge themselves and their babies prematurely (Henry et al. 2007).
Challenges for the health system include ensuring that there is good communication among providers in the local community and the hospital at which the woman gives birth, and that postnatal follow-up care is available in the community where the mother and baby live.
In order to examine the spatial accessibility of hospitals with birthing units, the AIHW has compiled and geocoded a list of public and private hospitals in Australia with birthing units, based on publicly available information on health websites; information included in state/territory 'Mothers and babies' reports; and communication with state and territory officials. Hospitals were included only if they offered a dedicated birthing unit—they were not included if they only provided emergency delivery services.
In 2015, 27% of hospitals in Australia had dedicated birthing units in:
- 219 public hospitals (out of 746 public hospitals)
- 63 private hospitals (out of 281 private hospitals).
These include hospitals with small birthing units for women at low risk of complications, through to tertiary centres with full services for women at high risk, including neonatal services for the babies. Table 6.7.1 presents the number of hospitals, by remoteness and by whether the birthing unit is in a public or private hospital. This distinction is important, because public birthing units provide services to all women, while private birthing units offer an additional option for those with the resources to access them.
| Area | Public hospitals with birthing units | Private hospitals with birthing units | Total hospitals with birthing units | Percent of birthing units that are public |
|---|---|---|---|---|
| Major cities | 70 | 48 | 118 | 59.3 |
| Inner regional | 74 | 9 | 83 | 89.2 |
| Outer regional | 52 | 6 | 58 | 89.7 |
| Remote | 16 | 0 | 16 | 100.0 |
| Very remote | 7 | 0 | 7 | 100.0 |
| Total | 219 | 63 | 282 | 77.7 |
Nearly all (196 out of 219) public hospitals with birthing units are in Major cities or regional areas, although there are 16 public hospitals in Remote areas with birthing units, and 7 in Very remote areas. Private birthing facilities make up 41% of all birthing units in Major cities, and there are no private hospitals in Remote or Very remote areas with birthing units.
Figure 6.7.2 shows the locations of the hospitals with birthing units, contrasted against the number of Indigenous women of child-bearing age at the SA2 level. This map illustrates the concentration of hospitals with birthing units in metropolitan areas, as well as the overlap in locations of public and private birthing units in metropolitan areas. It also shows that there are a large number of SA2s with at least 100 Indigenous women of child-bearing age who appear to be far from a hospital with a birthing unit, particularly in the Northern Territory, Western Australia and northern Queensland. The next section builds on this map by calculating spatial accessibility to these units.
Figure 6.7.2: Public and private birthing units and number of Indigenous women of child-bearing age, by SA2, 2015
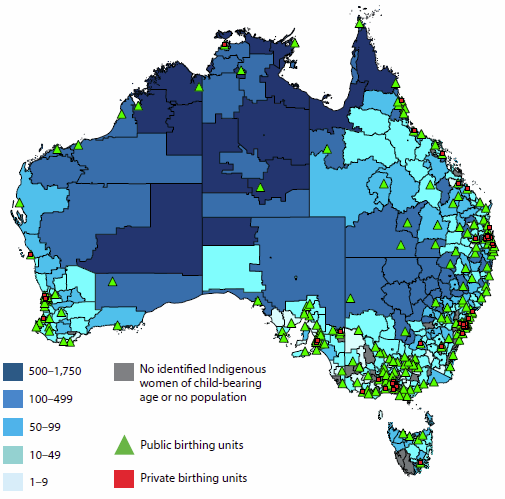
Drive time to hospitals with public birthing units
Figure 6.7.3 shows the percentage of Indigenous women of child-bearing age within each SA2 who live within a one-hour drive from a hospital with a public birthing unit. Only public birthing units are included in this analysis, as they provide services to all pregnant women. The darker colours on the map illustrate the areas with poorer spatial access to public birthing units. There are 126 SA2s where at least 75% of Indigenous women of child-bearing age live more than a one-hour drive from a public hospital with a birthing unit; 18 SA2s where between 50% and 75% of Indigenous women live outside a one-hour drive; and an additional 64 SA2s where up to 50% of Indigenous women live outside a one-hour drive.
Figure 6.7.3: Proportion of Indigenous women of child-bearing age who live within a one-hour drive from a hospital with a public birthing unit, by SA2, 2015
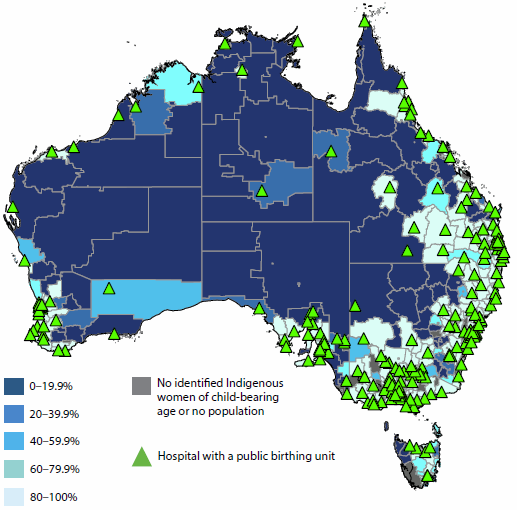
The one-hour travel time was selected as a reasonable upper limit for a pregnant woman to be driven to a hospital after the onset of contractions/spontaneous rupture of amniotic membranes or a medical emergency such as vaginal bleeding, based on a similar study in the United States (Rayburn et al. 2012). Research in rural British Columbia has shown that the incidence of poor birth outcomes is higher for women living outside an hour's drive of a birthing service, even after controlling for maternal characteristics (Grzybowski et al. 2011).
Comparing figures 6.7.2 and 6.7.3 shows that even if there is a hospital with a birthing unit within the SA2, spatial accessibility may be limited due to distance and road conditions. The results show that approximately one-fifth (21%) of Indigenous women of child-bearing age (around 26,600) live more than one hour's drive from the nearest hospital with a public birthing unit. Poorer spatial accessibility is high in areas with large numbers of Indigenous women of child-bearing age: in 11 of the 14 SA2s with more than 500 Indigenous women of child-bearing age, less than 20% of Indigenous women live within a one-hour drive from a hospital with a public birthing unit.
Figure 6.7.4 shows the significant variation in spatial accessibility by remoteness.
Figure 6.7.4: Percentage of Indigenous women of child-bearing age who live outside a one-hour drive from a hospital with a public birthing unit, by remoteness, 2015
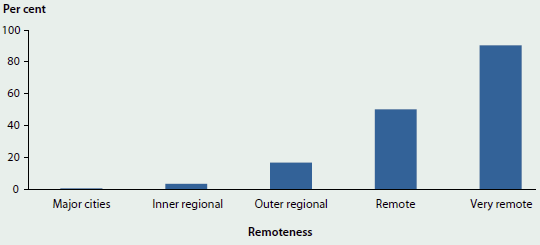
Only 1 in 10 (9.6%) Indigenous women of child-bearing age in Very remote areas live within an hour's drive of a public hospital with a birthing unit, compared with nearly 50% of Indigenous women in Remote areas and almost all women in Major cities.
Spatial accessibility of antenatal and postnatal services
One way to improve outcomes for Indigenous mothers and babies is through better access to antenatal care services, as studies have shown an association between inadequate antenatal care and increased risk of stillbirths, perinatal deaths, low birthweight and pre-term births (AIHW 2014; also see 'Chapter 5.2 Trends and patterns in maternal and perinatal health').
Comprehensive antenatal care services address a number of risk factors—not only maternal health issues, but also maternal behaviours such as smoking and alcohol use during pregnancy and maternal nutrition. For example, identifying women who smoke during pregnancy and offering them effective services for reduction or cessation during antenatal care has the potential to reduce low birthweight, particularly as smoking rates for Indigenous mothers are much higher than those for non-Indigenous mothers. The most recent age-standardised data shows that 48% of Indigenous mothers smoked during pregnancy, compared with 13% of non-Indigenous mothers (AIHW 2015a). Programs such as the Australian Nurse Family Partnership Program (ANFPP) have helped to reduce rates of smoking during pregnancy from 39% at commencement in the program to 23% at 36 weeks (ANFPP 2015).
Culturally competent antenatal care services are those in which woman-centred care is provided in ways that are respectful, understanding of local culture, and meet the emotional, cultural, practical and clinical needs of the women. There are a number of aspects which characterise culturally competent maternal care services, some of which include having specific Indigenous programs, having Aboriginal and Torres Strait Islander staff members, providing continuity of care, viewing women as partners in their care, having a welcoming physical environment and ensuring that cultural awareness and safety is the responsibility of all staff members in the service (Kruske 2011).
Currently, rates of antenatal care use early in pregnancy are lower for Indigenous mothers than they are for non-Indigenous mothers (51% of Indigenous mothers attend an antenatal visit in the first trimester, compared with 62% of non-Indigenous mothers).
Pregnant women can access antenatal care from three main types of health professionals, depending on their needs, preferences, resources, and location: midwives/nurse-midwives, GPs, and specialist obstetricians. Aboriginal health workers also provide support to Indigenous women. Antenatal care may be offered through a number of different sites and programs, such as hospitals, community health services, Indigenous specific health services, outreach clinics, private GPs' surgeries, and specialist obstetric practices.
Table 6.7.2 shows the numbers and distributions by remoteness of the four services offering antenatal/postnatal care that were included in this analysis. It illustrates the importance of RFDS and ISPHCS as primary health care providers in regional and remote areas.
| Area | Hospitals with public birthing units(a) |
GP practice locations(b) | ISPHCS(c) | RFDS(d) |
|---|---|---|---|---|
| Major cities | 70 | 5,372 | 24 | 0 |
| Inner regional | 74 | 1,336 | 46 | 4 |
| Outer regional | 53 | 791 | 50 | 53 |
| Remote | 16 | 189 | 31 | 55 |
| Very remote | 7 | 318 | 100 | 183 |
| Total | 220 | 8,006 | 251 | 296 |
- Only hospitals with public birthing units in 2015 were included in the analysis. This includes one private hospital in Tasmania which services public patients. The effect of not including other private hospitals in the spatial access measure is negligible, as the private birthing units are generally located in close proximity to public birthing units within the metropolitan and regional areas.
- GP practice locations were sourced from AMPCo 2013. One of the roles of GPs is to provide antenatal and postnatal care for low-risk women and to refer to more specialised services where appropriate (see AIHW 2015b for further detail on the GP data).
- The ISPHCS data represent Australian Government-funded services which report to the OSR collection (Online Services Report). We have not included any services that are only funded by the Northern Territory or other states/territories.
- These data were provided by the RFDS and include RFDS clinic locations which provided maternal and child health services at some point over the period 2013–2015.
Each of the four types of services has an important role in antenatal and postnatal care. Hospitals with public birthing units may provide the advantage of continuity of care throughout pregnancy, childbirth, and postnatal care/discharge and may offer specific programs for Aboriginal and Torres Strait Islander women. They also generally provide access to specialist obstetric care when required.
GP-led or GP-shared care is able to incorporate pregnancy-related care within the context of the broader primary health system, with referrals made to specialist obstetric services as needed.
Although well known for its medical extraction services, the RFDS is less well known for the primary care clinics it delivers to Australians in remote and isolated communities, where many of its patients are Aboriginal and Torres Strait Islander people. The clinics include GP and nurse-midwife services, and there is a GP helpline for RFDS clients that delivers telephone-based consultations.
Indigenous specific primary health care services embed their antenatal/postnatal care within a broader framework of culturally safe services and protocols, and a number of initiatives run by ISPHCS have led to higher rates of antenatal care attendance and improved birth outcomes for Indigenous mothers and babies (see AIHW 2014, Chapter 3).
Figures 6.7.5 and 6.7.6 present the physical locations of the maternal health services included in this analysis, for western and eastern Australia, by the number of Indigenous women of child-bearing age, followed by maps for Sydney, Darwin and Perth (figures 6.7.7, 6.7.8 and 6.7.9).
The maps highlight several key points:
- While there is overlap between the service types in urban and some regional areas, outlying areas may be covered by only one type of service.
- There are a number of ISPHCS and the RFDS clinics in the large, remote SA2s with larger numbers of Aboriginal and Torres Strait Islander women of child-bearing age (the darker blue areas on the maps).
- Regional areas in eastern Australia appear to have more services than similar areas in western and central Australia.
- The maps for the included cities (Sydney, Perth and Darwin) show that many of the SA2s with more than 100 Indigenous women of child-bearing age have multiple services.
Figure 6.7.5: Locations of maternal health services and number of Indigenous women aged 15–44, by SA2, western and central Australia
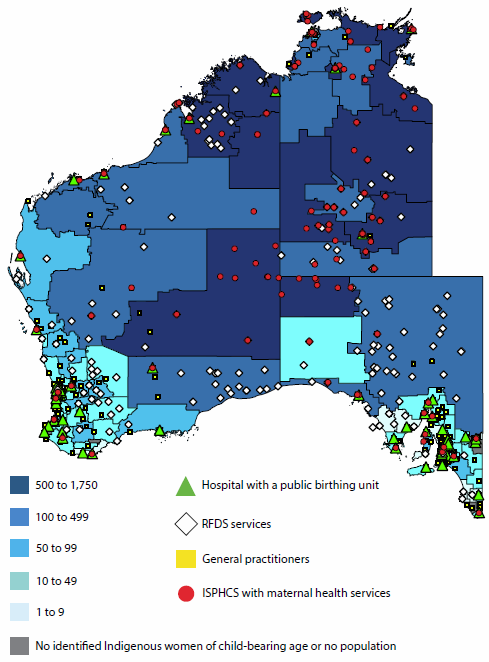
Figure 6.7.6: Locations of maternal health services and number of Indigenous women aged 15–44, by SA2, eastern Australia, 2015
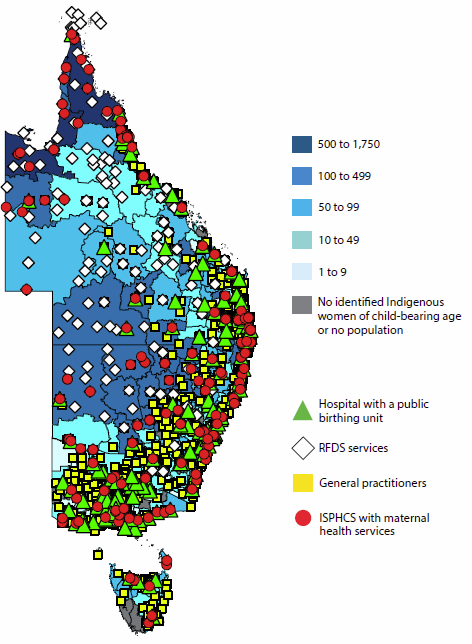
Figure 6.7.7: Locations of maternal health services and number of Indigenous women aged 15–44, by SA2, Sydney, 2015
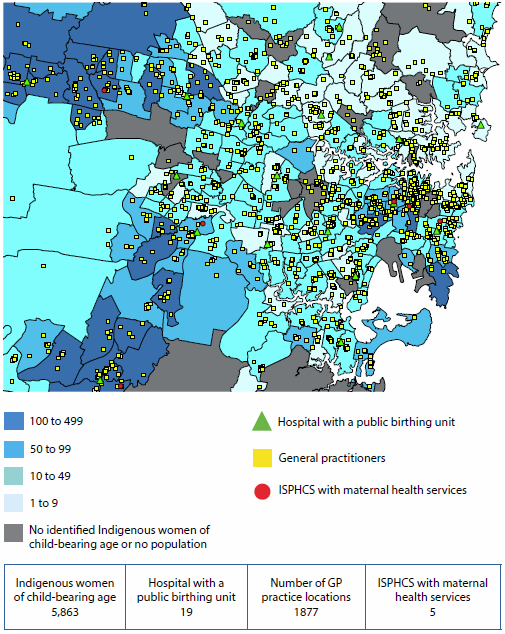
Figure 6.7.8: Locations of maternal health services and number of Indigenous women aged 15–44, by SA2, Darwin, 2015
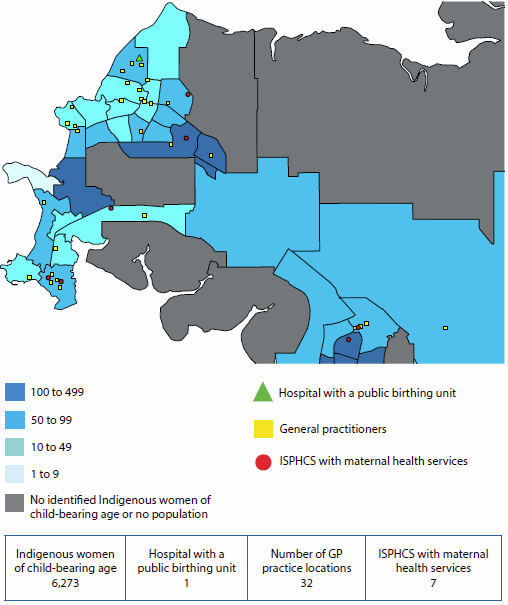
Figure 6.7.9: Locations of maternal health services and number of Indigenous women aged 15–44, by SA2, Perth, 2015
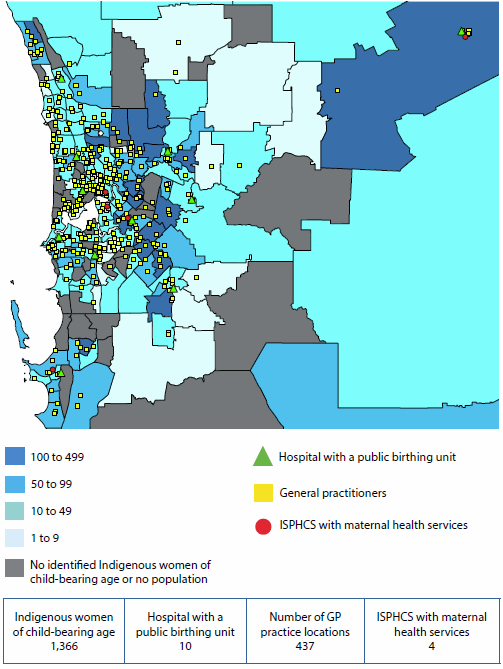
Table 6.7.3 presents the percentage of Indigenous women of child-bearing age in each SA2 who are within a one-hour drive to each type of service as well as a measure of how many women are within a one-hour drive to at least one type of service. It is important to acknowledge that the results measure the availability of any type of service—they are not able to take into account individual women's preference for a particular type of service.
| Area | Hospital with a public birthing unit | GP | ISPHCS | RFDS(a) | Any of the services | Number of Indigenous women |
|---|---|---|---|---|---|---|
| Major cities | 99.7 | 99.9 | 99.3 | 1.2 | 100.0 | 42,439 |
| Inner regional | 96.7 | 99.8 | 88.8 | 23.6 | 100.0 | 26,765 |
| Outer regional | 83.3 | 99.8 | 84.4 | 28.0 | 99.9 | 27,140 |
| Remote | 49.8 | 85.1 | 76.6 | 26.8 | 93.2 | 10,209 |
| Very remote | 9.6 | 64.8 | 49.4 | 60.2 | 84.2 | 17,605 |
| Total | 78.6 | 93.6 | 86.6 | 28.0 | 97.0 | 124,158 |
- The RFDS clinics are conducted at specific locations (such as schools, roadhouses, a shed) to which patients from surrounding areas must travel in order to access the service. Thus, travel times are still applicable for RFDS clinics.
The table highlights several patterns:
- Nearly all Indigenous women of child-bearing age (97%) have access to at least one type of maternal health service within a one-hour drive. The lowest percentages of women are in Very remote and Remote areas, where 84% and 93%, respectively, have access to at least one type of service, although the lack of spatial access to birthing units needs to be acknowledged.
- Indigenous women of child-bearing age in Major cities and regional areas have more types of services available to them within a one-hour drive than do women in more remote areas. Thus, they have more choice in which service they use.
- From a service planning perspective, the locations of the ISPHCS and RFDS in Remote and Very remote areas are complementing, not duplicating, each other. However, it is important to remember that the RFDS services are planned clinics—they are not 'on the ground' all the time.
What is the AIHW doing?
The AIHW is undertaking similar spatial analyses of access to child health services. The next step in this work is examining the extent to which access to birthing services and maternal and child health services has an effect on infant and child health.
What is missing from the picture?
The data do not include information on services which are wholly funded by states and territories and do not report to the Online Services Report data collection. This analysis has focused on spatial accessibility of services only. Other aspects of accessibility (such as cultural competence, financial accessibility, and the capacity of services) are important, but are not able to be assessed given the scope of this analysis.
Where do I go for more information?
For related reports on Indigenous Australians' access to services, see Spatial variation in Aboriginal and Torres Strait Islander people's access to primary health care and Access to primary health care relative to need for Indigenous Australians.
References
ABS (Australian Bureau of Statistics) 2013. Estimates of Aboriginal and Torres Strait Islander Australians, June 2011. ABS cat. no. 3238.0.55.00. ABS: Canberra.
AIHW (Australian Institute of Health and Welfare) 2014. Timing impact assessment for COAG Closing the Gap targets: child mortality. Cat. no. IHW 124. Canberra: AIHW.
AIHW 2015a. Australia's mothers and babies 2013—in brief. Perinatal statistics series no. 31. Cat. no. PER 72. Canberra: AIHW.
AIHW 2015b. Spatial variation in Aboriginal and Torres Strait Islander people's access to primary health care. Cat. no. IHW 155. Canberra: AIHW.
AHMC (Australian Health Ministers' Conference) 2011. National Maternity Services Plan. Canberra: Department of Health.
AMPCo (Australasian Medical Publishing Company) 2013. Medical directory of Australia. Published online.
ANFPP (Australian Nurse Family Partnership Program) 2015. ANFPP national annual data report 2013–2014. Milton, Queensland: ANFPP.
Grzybowski S, Stoll K & Kornelson J 2011. Distance matters: a population based study examining access to maternity services for rural women. BMC Health Services Research 11:147–54.
Henry B, Dunbar T, Barclay L & Thompson R. 2007. Self-discharge against medical advice from Northern Territory hospitals: prevalence rates, experiences and suggestions, economic implications and recommended strategies for improvement. Darwin: Graduate School for Health Practice and the School for Social and Policy Research, Charles Darwin University and the Cooperative Research Centre for Aboriginal Health.
Hilder L, Zhichao Z, Parker M, Jahan S & Chambers GM 2014. Australia's mothers and babies 2012. Perinatal statistics series no. 30. Cat. no. PER 69. Canberra: AIHW.
Kruske S 2011. The characteristics of culturally competent maternity care for Aboriginal and Torres Strait Islander women. Prepared for the Maternity Services Inter-jurisdictional Committee for the Australian Health Ministers' Advisory Council. Canberra: Standing Council on Health.
Rayburn WF, Richards ME & Elwell EC 2012. Drive times to hospitals with perinatal care in the United States. Obstetrics and Gynecology 119(3):611–16.
Williams D 2011. A smoother pathway to birth. O & G Magazine 13(3):26–27.
Wyndow P & Jackiewicz T 2014. Identifying and supporting pregnant Aboriginal women and their families during their patient journey through services and across geographical areas: A feasibility study. Subiaco, Western Australia: Telethon Kids Institute and the University of Western Australia.
6.8 Overview of hospitals
Australia's hospital services are provided by public and private hospitals. Public hospitals are owned and managed by state and territory governments, and private hospitals are owned and managed by private for-profit and not-for-profit organisations. Private hospitals that are contracted by state or territory governments to provide public hospital services are included here under public hospitals.
This snapshot provides an overview of Australia's hospitals and the services they provide. For information on hospital funding and spending, see 'Chapter 2.2 How much does Australia spend on health care?' For information on changes over time in the type of care received in both the private and public sector, see 'Chapter 6.9 Changes in the provision of hospital care'.
Public hospitals vary from large principal referral hospitals (see Glossary), mainly in Major cities, that provide a broad range of services, to small hospitals that provide a narrower range of services and are typically located in regional and remote areas. Private hospitals similarly range from large hospitals in Major cities that provide a wide range of services, to smaller hospitals that provide a limited range of procedures on a day-only basis. Table 6.8.1 presents the main characteristics of Australia's hospitals.
 Hospitals |
Public hospitals 747 |
Private hospitals 612 |
|---|---|---|
 Beds Beds per 1,000 population |
58,568 (up by an annual average of 0.7% since 2009–10) 2.5 (similar to the rate of 2.6 in 2009–10) |
30,920 (up by an annual average of 2.7% since 2009–10) 1.3 (the same as in 2009–10) |
 Number of hospitalisations |
5.7 million (up by an annual average of 3.0% since 2009–10) | 4.0 million (up by annual average of 3.6% since 2009–10) |
 Days of patient care provided |
18.8 million (up by an annual average of 1.0% since 2009–10) | 9.1 million (up by an annual average of 2.3% since 2009–10) |
Types of hospitalisations and care
Admitted patient services, or 'hospitalisations, are provided either on the same day or involve an overnight stay of one or more nights in hospital. Non-admitted patient services include emergency departments and outpatient clinics. Public hospitals provide the majority of these services (94% of emergency department services and 96% of outpatient care) (see also 'Chapter 6.11 Emergency department care').
In 2013–14, the majority of hospitalisations in both public and private hospitals (97% and 93%, respectively) were for acute care, that is, care focused on curing a condition, alleviating symptoms, or managing childbirth. See Table 6.8.2 for the main features of hospitalisations.
| Hospitalisations feature | Public hospitals | Private hospitals |
|---|---|---|
| Same-day acute care hospitalisations | 2.9 million (up by an annual average of 3.3% since 2009–10) | 2.6 million (up by annual average of 3.7% since 2009–10) |
| Most common reason for same-day acute care | Care involving dialysis 1.1 million hospitalisations | Chemotherapy about 254,800 hospitalisations |
| Overnight acute care hospitalisations | 2.6 million (up by an annual average of 2.6% since 2009–10) | 1.1 million (up by and annual average of 2.0% since 2009–10) |
| Subacute and non-acute care hospitalisations | 192,000 (up by an annual average of 5.8% since 2009–10) | 271,000 (up by an annual average of 10.1% since 2009–10) |
| Most common reason for subacute and non-acute care | Rehabilitation about 99,000 hospitalisations | Rehabilitation about 255,500 hospitalisations |
| Average length of overnight stay | 5.7 days (down from 6.2 in 2009–10) | 5.1 days (down from 5.3 in 2009–10) |
The services provided in hospital can be described in terms of the broad categories of care. Acute care includes Medical (care not involving a procedure), Surgical (involving an operating room procedure), Childbirth, Specialist mental health and Acute other (non-surgical procedures, such as endoscopy). Subacute and non-acute care includes Rehabilitation, Palliative care, Geriatric evaluation and management, Psychogeriatric care and Maintenance care.
More than two-thirds (67%) of hospitalisations in public hospitals were for Medical care and around one-third (30%) in private hospitals. Surgical care comprised the highest proportion of care in private hospitals (36%), compared with 17% in public hospitals.
About 3% of hospitalisations in public hospitals and 7% in private hospitals were for Subacute and non-acute care (Figure 6.8.1).
Figure 6.8.1: Proportion of hospitalisations by type of care, 2013–14
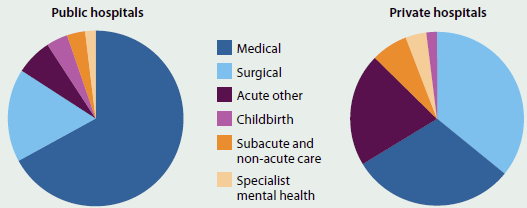
What is missing from the picture?
Although well-developed hospitalisation data are available, there are variations between jurisdictions in how hospital services are defined and counted. The data are based on each hospitalisation, rather than each patient, and current national data cannot easily be used to analyse care patterns for patients hospitalised several times, or to monitor outcomes of care. Similarly, it is difficult to analyse patterns of care across admitted and non-admitted patient settings (including non-hospital settings such as primary care).
Private hospital data are collected, analysed, and disseminated through different reporting pathways. As a result, private hospital data may not be consistent across the various collections or with data for public hospitals.
Where do I go for more information?
More information on hospitals in Australia is available in the reports Admitted patient care 2013–14: Australian hospital statistics; Non-admitted patient care 2013-14: Australian hospital statistics; Hospital resources 2013-14: Australian hospital statistics; and Australia's hospitals 2013-14: at a glance, available for free download.
More information on private hospital activity is also available on the Australian Bureau of Statistics website.
6.9 Changes in the provision of hospital care
Hospitals are an important part of Australia's health landscape, providing services to millions of Australians each year and accounting for around 40% of Australia's health expenditure (AIHW 2015b).
This article explores the changing nature of the services provided for patients admitted to Australia's public and private hospitals over the last 10 years. It presents data from the AIHW's National Hospital Morbidity Database (NHMD), comparing activity for 2004-05 and 2013-14 and trends over this period.
The main measure of admitted patient activity in hospitals is the number of episodes of admitted patient care (referred to as hospitalisations in this article). Because episodes can vary in length from 'same-day' to many days or weeks, another useful measure of activity is days of patient care, or the total number of days of care provided to patients.
Information on hospital use can also be found in 'Chapter 6.8 Overview of hospitals' and 'Chapter 6.17 Health care use by older Australians'.
More hospital care, particularly for older people
In 2013-14, there were around 9.7 million hospitalisations, an increase from around 7.0 million in 2004-05—an increase of 3.7% on average each year.
Hospitalisations increased faster than population growth between 2004-05 and 2013-14. The numbers of hospitalisations per 1,000 population increased from 347 per 1,000 in 2004-05 to 395 per 1,000 in 2013-14, or 1.5% on average each year.
The numbers of hospitalisations per 1,000 population were higher at every age group in 2013-14 than in 2004-05. The highest annual average increase was for people aged 85 and over, followed by people aged 65-84 and 45-64 (Figure 6.9.1). Hospitalisation rates for infants (children aged under 1, excluding healthy newborns) increased from 532 hospitalisations per 1,000 population to 570. However, changes in reporting practices over this period are likely to be partly responsible for this increase.
In 2013-14, around 27.9 million days of patient care were recorded, an increase from around 23.9 million in 2004-05—a 1.8% increase on average each year. However, the number of days of patient care per 1,000 population decreased from 1,186 per 1,000 in 2004-05 to 1,117 per 1,000 in 2013-14—a decrease of 0.7% on average each year.
Between 2004-05 and 2013-14, the number of days of patient care per 1,000 population decreased for every age group with the exception of people aged 45-64, where there was an increase of less than 0.6% on average each year.
Increasingly, people are admitted to and discharged from hospital in a single day, that is, they are not staying overnight. The proportion of all hospitalisations that were same-day increased from 55% in 2004-05 to 59% in 2013-14.
In 2013-14, the average length of stay (including same-day hospitalisations) was 2.9 days, a decrease from 3.4 days in 2004-05. The average length of hospital stay decreased for all age groups; the largest decrease was for people aged 85 and over, for whom it fell from 8.0 days in 2004-05 to 5.5 days in 2013-14 (Figure 6.9.2).
Figure 6.9.1: Hospitalisations and annual average change, by age, 2004-05 and 2013-14
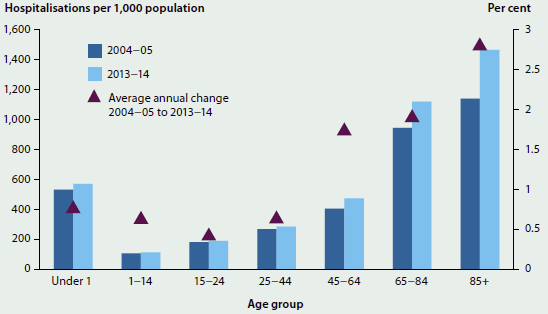
Note: For infants (aged under 1 year), changes in reporting practices are likely to be partly responsible for the increase in hospitalisations between 2004-05 and 2013-14.
Figure 6.9.2: Average length of stay, by age, 2004-05 and 2013-14
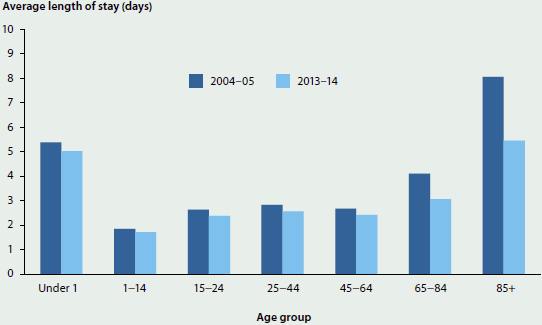
Acute and subacute and non-acute care
Acute care
Acute care for patients admitted to hospital is intended to cure illness, alleviate symptoms of illness or manage childbirth. It includes Childbirth, Specialist mental health, Surgical (involving an operating room procedure such as surgery for appendicitis), Medical (for treatment that does not involve surgery or non-operating room procedure, for example dialysis) and Acute other (treatment that includes a non-operating room procedure, for example endoscopy).
Medical was the most common type of care provided in hospitals, at 180 hospitalisations per 1,000 population in 2004-05 (around 3.7 million hospitalisations) and 206 per 1,000 in 2013-14 (around 5.0 million hospitalisations). Surgical was the next most common type of care, with 92 hospitalisations per 1,000 in 2004-05 (around 1.9 million hospitalisations) and 100 per 1,000 in 2013-14 (around 2.4 million hospitalisations) (Figure 6.9.3).
Figure 6.9.3: Hospitalisations for acute care, 2004-05 to 2013-14
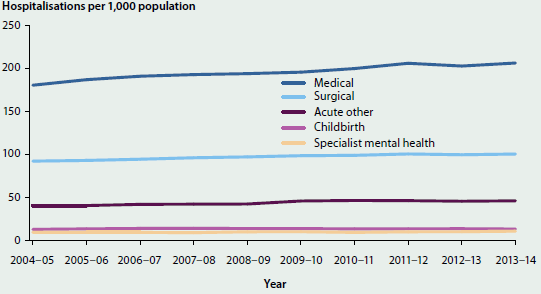
Overall, acute hospitalisations per 1,000 population increased at an annual average of 1.3% between 2004-05 and 2013-14. Medical care grew by an annual average of 1.5% and Specialist mental health and Acute other both had annual average increases of 1.4%. On average each year, Surgical care increased by 1.0% and Childbirth by 0.3% (Figure 6.9.4).
Figure 6.9.4: Annual average change in hospitalisations per 1,000 population, acute care, 2004-05 to 2013-14
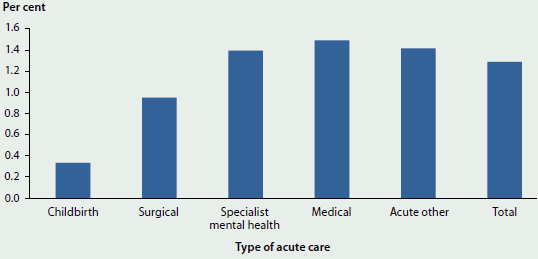
Subacute and non-acute care
Subacute and non-acute hospital care includes Rehabilitation, Palliative care, Geriatric evaluation and management, Maintenance care, and Psychogeriatric care.
Subacute and non-acute care accounted for about 10 hospitalisations per 1,000 population in 2004-05 and about 18 per 1,000 in 2013-14, an increase of 6.7% on average each year (Figure 6.9.5). Due to the low numbers of hospitalisations for subacute and non-acute care other than Rehabilitation in 2004-05, the annual average changes for them should be interpreted with caution.
Figure 6.9.5: Hospitalisations for subacute and non-acute care, 2004-15 to 2013-14
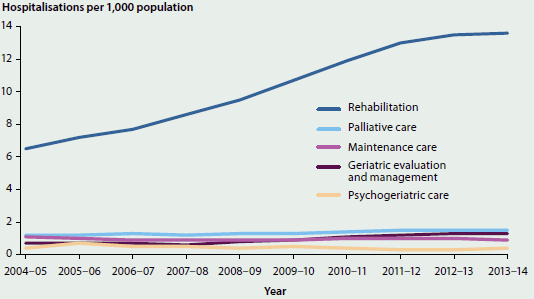
Rehabilitation had an annual average increase in hospitalisations per 1,000 population of 9.0% between 2004-05 and 2013-14 (Figure 6.9.6) and the number of patient days per 1,000 population increased by an annual average of 3.2%. The lower increase in patient days per 1,000 compared with hospitalisations per 1,000 indicates that the average length of stay for Rehabilitation hospitalisations decreased between 2004-05 and 2013-14. The proportion of hospitalisations that were on a same-day basis for Rehabilitation increased from 39% in 2004-05 to 62% in 2013-14 and contributed to the fall in average length of stay.
Figure 6.9.6: Annual average change in hospitalisations per 1,000 population, subacute and non-acute care, 2004-05 to 2013-14
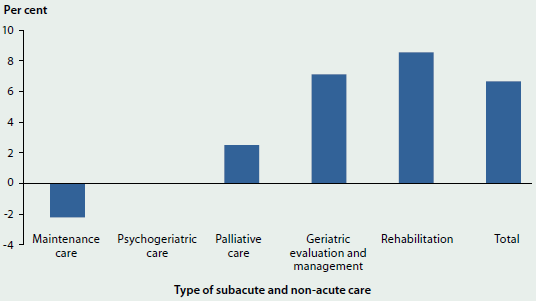
Note: There was no change in Psychogeriatric care.
Changes in care provided by public and private hospitals
Between 2004-05 and 2013-14, hospitalisations grew more in private hospitals than in public hospitals, with annual average increases of 4.2% and 3.3%, respectively. The proportion of all hospitalisations that were in public hospitals decreased from 61% in 2004-05 to 59% in 2013-14.
In 2004-05, there were around 4.3 million hospitalisations in public hospitals and this increased to 5.7 million in 2013-14. For private hospitals, there were around 2.7 million in 2004-05 and 4.0 million in 2013-14.
Same-day hospitalisations in private hospitals increased from 86 to 111 hospitalisations per 1,000 population (an increase of 2.9% on average per year). Same-day hospitalisations in public hospitals increased at a lower rate (from 104 to 120, an increase of 1.6% on average per year).
For both public and private hospitals, the largest increase in hospitalisations per 1,000 population was for acute Medical care. For public hospitals, Medical hospitalisations rose from 138 per 1,000 in 2004-05 to 157 per 1,000 in 2013-14 (an increase of 1.5% on average each year). For private hospitals, Medical hospitalisations rose from 43 per 1,000 in 2004-05 to 49 per 1,000 in 2013-14 (an increase of 1.6% on average each year). Surgical care hospitalisations in public hospitals increased from 40 to 41 per 1,000 population (an increase of 0.3% on average each year) and in private hospitals from 52 to 59 per 1,000 (an increase of 1.4% on average each year) over the same period (Figure 6.9.7).
Figure 6.9.7: Hospitalisations for acute care, public and private hospitals, 2004-05 and 2013-14
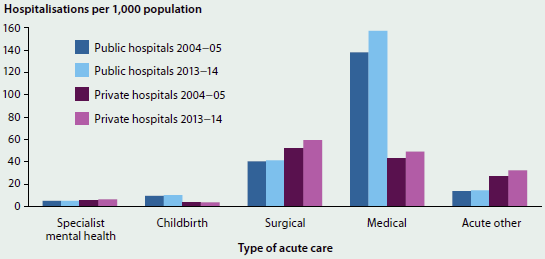
Between 2004-05 and 2013-14, Rehabilitation increased from 3.3 to 9.7 hospitalisations per 1,000 in private hospitals (an increase of 13% on average each year) (Figure 6.9.8). Most of this increase was for rehabilitation for musculoskeletal conditions including osteoarthritis of the knee and hip (including after replacement surgery), other joint disorders and back pain.
Figure 6.9.8: Hospitalisations for subacute and non-acute care in public and private hospitals, 2004-05 and 2013-14
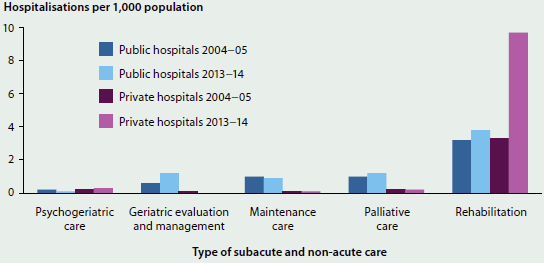
Geriatric evaluation and management in public hospitals increased from 0.6 to 1.2 hospitalisations per 1,000 between 2004-05 and 2013-14 (an increase of 8.0% on average each year) (Figure 6.9.8). As previously noted, due to the low numbers of hospitalisations for Geriatric evaluation and management in 2004-05, the relatively high annual average change should be interpreted with caution.
Increases in some procedures, decreases in others
This section presents information on changes in selected hospital procedures between 2004-05 and 2013-14. Procedures presented are those in the National Health Performance Framework performance indicator 'differential access to hospital procedures' (for further information, see 'Chapter 7.1 Indicators of Australia's health'). The procedures were selected because of the frequency with which they are undertaken, because they are often elective and/or discretionary, and because alternative treatments are sometimes available (AIHW 2015a).
Per 1,000 population, Cataract extraction was the most common of the selected procedures undertaken in hospitals between 2004-05 and 2013-14. This was followed by Cystoscopy, a procedure to examine the bladder. Coronary angioplasty (a procedure to widen the arteries), Coronary artery bypass graft and Varicose veins stripping and ligation had the lowest numbers of hospitalisations per 1,000 population (Table 6.9.1).
| Procedure | 2004-05 | 2013-14 | Average annual change between 2004-05 and 2013-14 (per cent) |
|---|---|---|---|
| Coronary artery bypass graft | 0.7 | 0.5 | -3.7 |
| Varicose veins stripping & ligation | 0.7 | 0.6 | -2.3 |
| Hysterectomy | 2.8 | 2.4 | -1.8 |
| Inguinal herniorrhaphy | 2.4 | 2.1 | -1.6 |
| Prostatectomy | 2.9 | 2.6 | -1.3 |
| Coronary angioplasty | 1.6 | 1.5 | -1.2 |
| Cholecystectomy | 2.3 | 2.2 | -0.3 |
| Myringotomy | 1.7 | 1.6 | -0.2 |
| Cataract extraction | 8.3 | 8.9 | 0.8 |
| Septoplasty | 1.0 | 1.1 | 1.3 |
| Hip replacement | 1.4 | 1.6 | 1.3 |
| Cystoscopy | 4.4 | 5.4 | 2.2 |
| Haemorrhoidectomy | 1.6 | 1.9 | 2.4 |
| Knee replacement | 1.5 | 1.9 | 2.9 |
| Tonsillectomy | 1.7 | 2.5 | 4.1 |
Notes
-
For Hysterectomy, the rate per 1,000 population was calculated for females aged 15 to 69 years.
-
For Prostatectomy, the rate per 1,000 population was calculated for males.
-
The selected procedures are presented in order from those with the largest decrease to those with the largest increase in the number of hospitalisations per 1,000 population.
Of the selected procedures, between 2004-05 and 2013-14, hospitalisations per 1,000 population increased the most for Tonsillectomy, with an average annual increase of 4.1%, followed by Knee replacement, increasing by 2.9% on average each year. Hospitalisation rates decreased most for Coronary artery bypass graft (a decrease of 3.7% on average each year) and Varicose veins stripping and ligation (a decrease of 2.3% on average each year). These changes should be considered in the context of the number of hospitalisations for these procedures. For example, while there was a large annual average increase in the rate for Tonsillectomy, there were fewer of these procedures performed than, for example, Cystoscopy or Cataract extraction.
More same-day procedures
Same-day hospitalisations increased from 190 to 231 per 1,000 population, while overnight hospitalisations increased from 157 to 164 per 1,000 (Figure 6.9.9). This was an annual average increase of 2.2% for same-day hospitalisations and 0.5% for overnight hospitalisations.
Almost two-thirds of the increase in same-day hospitalisations was due to five specific reasons for admission. Dialysis accounted for about 31% of the increase in same-day hospitalisations (increasing from 40.3 hospitalisations per 1,000 to 53.2) (Figure 6.9.10). Same-day hospitalisations for Rehabilitation accounted for about 17% of the increase (rising from 6.8 hospitalisations per 1,000 to 13.7). A further 16% of the increase in same-day hospitalisations was related to increases in Investigation related to the digestive system (for example, by endoscopy or colonoscopy, which rose from 7.7 hospitalisations per 1,000 population to 11.3); in Chemotherapy (14.1 hospitalisations per 1,000 to 16.6); and in Cataract extraction (8.3 hospitalisations per 1,000 to 8.9).
Figure 6.9.9: Same-day and overnight hospitalisations, public and private hospitals, 2004-05 and 2013-14
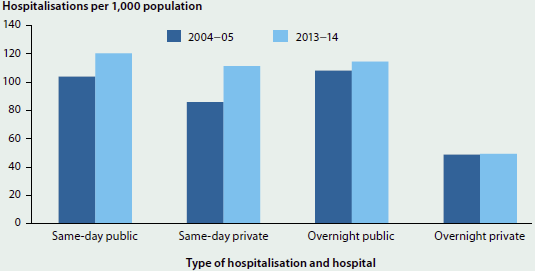
Figure 6.9.10: Same-day hospitalisations, by selected reasons for admission, 2004–05 and 2013–14
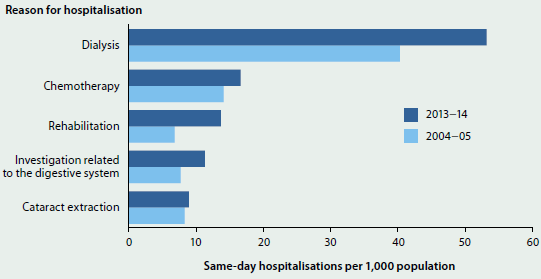
Note: The comparability of the 2004-05 and 2013-14 data for same-day hospitalisations may be affected by changes in admission practices over time.
What is the AIHW doing?
The AIHW, through the Australian Health Ministers' Advisory Council National Health Information Standards and Statistics Committee, is examining variation in admission policies and practices across hospitals in Australia. For example, a condition treated through an admission to hospital in one state or territory might be treated as a non-admitted service in another. Better documentation of the variations in admission practices and policies in hospitals—and potentially more consistency in the way admissions are recorded—may improve the national information on hospitalisation.
What is missing from the picture?
The NHMD does not currently include information on the length of stay (in hours) for short-stay hospitalisations (for example, same-day or one night). This further level of detail would provide better national information on hospital care as same-day hospitalisations increase.
The data are based on each admission, and it is not possible to count the number of individual patients or to analyse care patterns in patients hospitalised several times. Similarly, it is not possible to analyse patterns of care across admitted and non-admitted patient settings (including non-hospital settings such as primary care).
Where do I go for more information?
AIHW's Australian hospital statistics series of publications and web products are available for free download at Hospitals. In addition, the website Learn about your local hospital provides performance information for public and private hospitals.
References
AIHW (Australian Institute of Health and Welfare) 2015a. Admitted patient care 2013-14: Australian hospital statistics. Health services series no. 60. Cat. no. HSE 156. Canberra: AIHW.
AIHW 2015b. Health expenditure Australia 2013-14: analysis by sector. Health and welfare expenditure series no. 55. Cat. no. HWE 65. Canberra: AIHW.
6.10 Elective surgery
Elective surgery is planned surgery that can be booked in advance, as a result of a specialist clinical assessment, resulting in placement on an elective surgery waiting list. Prioritising and scheduling patients for elective surgery is an important consideration for Australian hospitals. Waiting time for elective surgery is calculated from the time a patient is placed on a waiting list until they are admitted for their surgery.
Private hospitals perform about two-thirds of elective surgery in Australia (1.4 million hospitalisations compared with about 695,000 for public hospitals in 2013-14). Waiting time information is available for patients having elective surgery in public hospitals.
How much and what type of elective surgery was performed in public hospitals?
In 2014-15, Australia's public hospitals admitted almost 700,000 patients from elective surgery waiting lists. For these patients:
- around 23% were admitted for General surgery (surgery on organs of the abdomen) and about 15% were admitted for Orthopaedic surgery (surgery on bones, joints, ligaments and tendons, including knee and hip replacements)
- the most common surgical procedure was Cataract extraction (65,000 admissions).
Between 2011-12 and 2014-15:
- elective surgery admissions increased by an average of 1.8% each year, while admissions per 1,000 population remained stable at around 30
- there were relatively large increases in admissions for Total hip replacement (4.5% per year) and Total knee replacement (4.0% per year).
How long did people wait for elective surgery in public hospitals?
In 2014-15:
- the median waiting time was 35 days, meaning that 50% of patients were admitted within 35 days of being placed on the waiting list. Overall, 90% were admitted within 253 days, while 1.8% waited more than 1 year
- the shortest median waiting time was in Queensland (27 days) and the longest was in Tasmania (55 days)
- the median waiting time for Indigenous Australians (42 days) was higher than for other Australians (35 days), and a higher proportion of Indigenous Australians waited more than a year for elective surgery than other Australians (2.3% and 1.8%, respectively).
Between 2010-11 and 2013-14, the median waiting time was stable at 36 days, although in 2014-15 the median waiting time decreased to 35 days. Between 2010-11 and 2014-15, the proportion of patients who waited more than a year to be admitted for their procedure decreased from 2.8% to 1.8%.
How did waiting times vary by surgical specialty?
In 2014-15:
- the longest median waiting times were for the surgical specialties Ear, nose and throat surgery; Ophthalmology; and Orthopaedic surgery (73, 70, and 64 days, respectively). Cardio-thoracicsurgery had the shortest median waiting time (18 days) (Figure 6.10.1)
- Ear, nose and throat surgery had the highest proportion of patients who waited more than a year to be admitted (4.8%).
Comparing 2010-11 and 2014-15:
- median waiting times decreased for Urology; Neurosurgery; General surgery; and Plastic surgery and increased for Ear, nose and throat surgery; Cardio-thoracic surgery; Gynaecology; and Orthopaedic surgery
- there was no change for Vascular surgery or Ophthalmology. The largest decrease was for Urology, from 28 days in 2010-11 to 24 days in 2014-15. The largest increase was for Ear, nose and throat surgery, from 64 days in 2010-11 to 73 days in 2014-15.
Figure 6.10.1: Median elective surgery waiting times, by surgical specialty, public hospitals, 2014-15
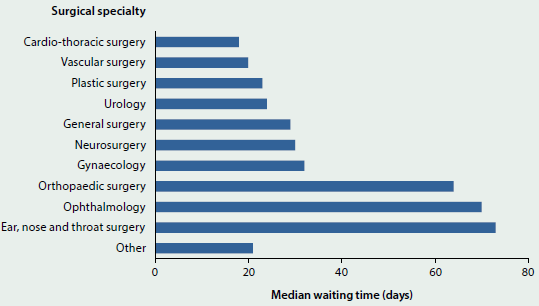
What is missing from the picture?
Data on the urgency of the need for elective surgery has not been reported here. In 2011, an expert panel established by the Council of Australian Governments noted inconsistencies in clinical urgency categorisation for elective surgery among the states and territories. In response, the AIHW, in collaboration with the Royal Australasian College of Surgeons, developed revised definitions for urgency categories that were implemented from 1 July 2015, so it is expected that urgency category information will be more nationally comparable from the 2015-16 collection period.
Private hospitals do not report to the National Elective Surgery Waiting Times Data Collection and therefore there is no information available about waiting times in this sector. Neither is there nationally consistent information available on the amount of time waited before the patient's first appointment with the surgeon (for example after referral from a general practitioner).
Where do I go for more information?
The reports Elective surgery waiting times 2014-15: Australian hospital statistics; Admitted patient care 2013-14: Australian hospital statistics and National definitions for elective surgery urgency categories: proposal for the Standing Council on Health are available for free download.
6.11 Emergency department care
Emergency departments are a critical component of Australia's health care system, providing care for patients who require urgent medical attention.
Most larger public hospitals have an emergency department. Smaller public hospitals may not, but can provide emergency services through informal arrangements. The information presented here is about the 290 Australian public hospitals that have purpose-built emergency departments staffed 24 hours a day, which reported to the AIHW's National Non-Admitted Patient Emergency Department Care Database (NNAPEDCD).
How busy are emergency departments?
- In 2014-15, there were about 7.4 million presentations to emergency departments across Australia, equivalent to just over 20,000 presentations each day.
- Between 2010-11 and 2014-15, after adjusting for hospital coverage changes, the number of emergency department presentations increased by an average of 3.4% each year.
- In 2014-15, 51% of emergency department presentations were for men and boys.
- Children aged 0 to 4 years accounted for about 11% of presentations, despite comprising around 6.5% of the population. People aged 65 and over accounted for about 20% of all presentations, higher than the proportion of the population that this age group comprises (15%) (Figure 6.11.1).
- People aged 35 to 64 accounted for 30% of presentations, despite comprising around 38% of the population.
Figure 6.11.1: Proportion of emergency department presentations (2014-15) and Australian population (30 June 2015), by age
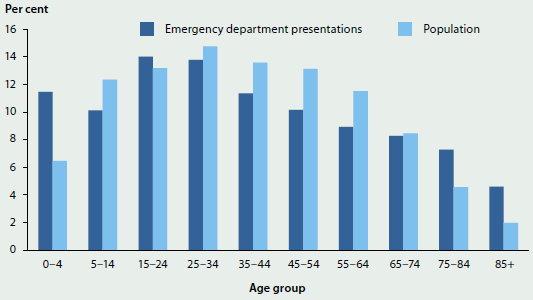
How and why were services accessed?
- In 2014-15, about 24% of all patients arrived by Ambulance, air ambulance or helicopter rescue service. About 84% of Resuscitation patients (who need to be treated immediately) arrived in this manner, compared with fewer than 4% of Non-urgent patients (who need to be treated within 2 hours).
- About 69% of patients presented to the emergency department between 8:00 am and 8:00 pm, and there were more presentations on the weekends and on Mondays than on other days of the week.
- About 27% of all emergency department presentations had a principal diagnosis (or main reason for care) of an injury or poisoning (over 1.8 million).
- About 30% of emergency department presentations ended in admission to the hospital.
- For patients who were subsequently admitted to hospital, the three most common principal diagnoses were Abdominal and pelvic pain; Pain in throat and chest; and Pneumonia.
Were patients seen on time?
Patients who present to the emergency department are 'triaged' on presentation, according to the urgency of their need for care. A patient is said to be 'seen on time' if the time between presentation at the emergency department and the commencement of their clinical care is within a specified time that is appropriate for their triage category.
In 2014-15, about 74% of patients were seen on time, including almost 100% of Resuscitation patients (who must be seen immediately, or within seconds) and 79% of Emergency patients (who must be seen within 10 minutes). For Non-urgent patients, the proportion seen on time (within 2 hours) was 92% (Figure 6.11.2)—higher than that for patients assessed as Urgent (to be seen within 30 minutes) and Semi-urgent (within 60 minutes).
Figure 6.11.2: Proportion of patients seen on time by triage category, 2014-15
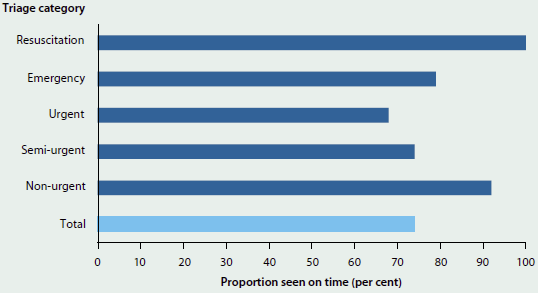
- The proportion of patients seen on time ranged from 59% in the Australian Capital Territory to 81% in New South Wales.
- The proportion of all Emergency presentations that were seen on time increased from 70% in 2010-11 to 75% in 2013-14, and was 74% in 2014-15.
How long did people stay?
The length of stay in the emergency department is measured from the time the patient arrives to the time they physically leave to go home, are admitted to hospital or are transferred to another hospital. Between 2011-12 and 2014-15, the proportion of emergency department visits completed in 4 hours or less increased from 64% to 73%.
- In 2014-15, Western Australia had the highest proportion of visits completed in 4 hours or less (79%) and the Northern Territory had the lowest (62%).
- For the 30% of patients who were subsequently admitted to hospital in 2014-15, about 47% were admitted in 4 hours or less.
- Queensland had the highest proportion (57%) of emergency department patients admitted to hospital in 4 hours or less and the Northern Territory had the lowest (23%).
What is missing from the picture?
Because the scope of the Non-Admitted Patient Emergency Department Care National Minimum Data Set is limited to emergency departments that meet nationally agreed criteria, most of the information here relates to hospitals in Major cities. It therefore may not be representative of the emergency services provided by hospitals that do not have formal emergency departments (for example, those in more remote areas). For 2014-15, it is estimated that the proportion of emergency services reported to the NNAPEDCD was 88%.
It is not possible to determine whether the patient had been referred to the emergency department by another doctor or health service. It is also not possible to identify the admitted patient episode for those patients who are subsequently admitted. Linked data would enable the patient journey to be mapped on an individual level to understand how patients interact with the different components of the health system, and to monitor outcomes of care.
In 2014-15, principal diagnosis information was not reported uniformly, with a variety of classifications used, and it was only reported for about 94% of presentations. There was no information on the procedures or on other treatments provided in the emergency department.
Where do I go for more information?
More information on emergency department care in Australia is available at AIHW website Hospitals. The report Emergency department care 2014-15: Australian hospital statistics is also available for free download.
6.12 Radiotherapy
Radiotherapy is an important type of treatment which can be given with the intention to cure or control cancer, or to relieve symptoms such as pain. A pilot collection of data from radiotherapy service providers (including most public and some private service providers) has contributed information on radiotherapy in Australia in 2013-14. The focus of this collection is on waiting times for megavoltage external beam radiotherapy (that is, radiotherapy provided by a linear accelerator), which is the most common form of radiotherapy in Australia. It is estimated that about one-half of all patients with cancer would benefit from external beam radiotherapy (RANZCR 2015).
Activity and patients
In 2013-14, radiotherapy was delivered at 72 locations across Australia—37 out of 38 public sites and 16 out of 34 private provider sites contributed activity data to the pilot collection. The 53 participating service-provider locations supplied data for about 47,700 courses of radiotherapy (a series of one or more treatments, see Glossary) that started in 2013-14:
- About 37,700 courses were delivered in public settings, and 10,000 in private settings.
- The most common types of cancer treated were breast, prostate and lung cancers.
- More than half (53%) of treatments had an intention of treatment that was curative, 40% were palliative and 1.9% were prophylactic (see Glossary). The remaining 4.4% did not report intent.
- Where emergency status data were provided, 2.9% were clinically assessed as emergency cases (that is, radiation treatment should begin within 24 hours). The majority of these emergency cases were palliative (92%), and 6.9% were curative.
- For non-emergency radiotherapy, 38% was palliative, 59% was curative and 2.7% was prophylactic in intent.
- About half (51%) of all courses were delivered to males (Figure 6.12.1), and 68% of all radiotherapy courses were delivered to patients aged 60 and over. Only 0.8% of courses were delivered to patients aged under 20.
Figure 6.12.1: Radiotherapy courses, by age and sex, 2013-14
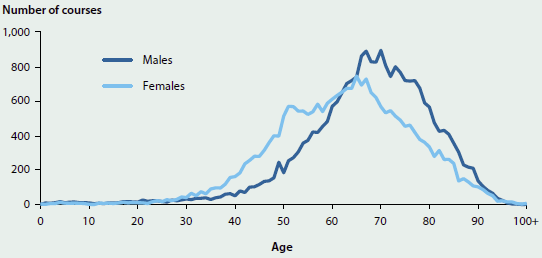
Source: AIHW 2015.
Waiting times
Delays in treatment can lead to poorer clinical outcomes. In this collection, the waiting time is the number of days from when the patient is ready for care (ready to be treated with radiotherapy in the opinion of the treating radiation oncologist, and with the agreement of the patient) until the day the patient first receives radiotherapy treatment. Reported waiting times include 'non-working days' (such as weekends or public holidays) and would also include days on which a service could not be provided (such as when key staff are unavailable or where equipment had failed).
Waiting times were reported for 38,700 courses. For public and private providers combined:
- 90% of treatment for emergency cases, which should start within 24 hours, was started on the same or next day
- 50% of treatment for non-emergency cases started within 13 days of the patient being ready for care and 90% within 33 days. There is currently no agreed benchmark for non-emergency waiting times in Australia.
Waiting-times data were provided by 36 of the 38 public treatment sites nationally, but only 5 out of 34 private provider sites, so may not be representative of the waiting times overall.
What is missing from the picture?
Other waiting periods—such as the times between contacts with a general practitioner, medical oncologist, and radiation oncologist, and the time between the first consultation with a radiation oncologist and the patient becoming ready for care—are not collected in this data set.
This collection does not count numbers of people receiving radiotherapy treatment, as a patient may receive multiple courses of radiotherapy in the reporting period.
Agreement about appropriate benchmark waiting periods for non-emergency patients (for example, benchmarks based on relevant clinical characteristics) would allow better reporting of the appropriateness of waiting times for radiotherapy. Better information on the time of day that a patient becomes ready for care, and then receives treatment, could allow better measurement of whether emergency patients are treated on time (that is, within 24 hours).
Where do I go for more information?
More information on radiotherapy in Australia is available in the report Radiotherapy in Australia: report on a pilot data collection, 2013-14, which can be downloaded for free.
References
AIHW (Australian Institute of Health and Welfare) 2015. Radiotherapy in Australia: report on a pilot data collection 2013-14. Cat. no. HSE 167. Canberra: AIHW.
RANZCR (The Royal Australian and New Zealand College of Radiologists) 2015. What is radiation therapy? Sydney: RANZCR.
6.13 Organ and tissue donation
Organ and tissue donation is the process of collecting organs and tissues from suitable donors for the purpose of transplanting into a recipient. There are two types of donation: deceased (after brain or cardiac death) and living. Organs that can be donated include the heart, lungs, liver, kidneys and pancreas. Tissues that can be donated include heart tissue, bone, tendons, ligaments, skin and parts of the eye.
In Australia, organ and tissue donation is an altruistic act. Few people die in a way that allows them to donate organs—in fact, only about 1% of people who die in hospital each year are suitable to become organ donors. Many more people can donate tissue because live donation is possible.
Where a person has died and donation is a possibility, the family's permission is sought. People over the age of 16 who wish to become donors in this way can sign on to the Australian Organ Donor Register (AODR), which is also checked when families are asked about donation. Around 1,600 people are on Australian organ transplant waiting lists at any time (AOTDTA 2015).
Organ donation
In 2015, there were 435 deceased organ donors (Figure 6.13.1)—a 76% increase from 247 in 2009 and 15% more than the 378 donors in 2014. There were also organ donations from living donors, whereby a person donates one of their kidneys for transplantation to another person (see 'Transplants' later in this snapshot).
Figure 6.13.1: National deceased organ donations and transplants, 2009 to 2015
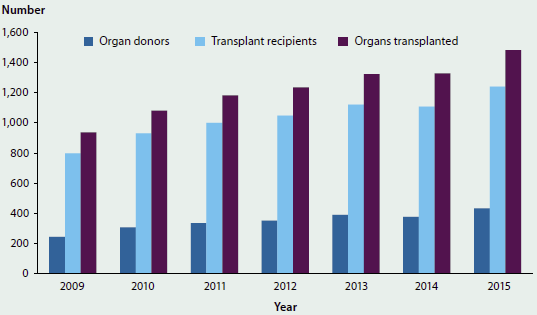
Source: AOTDTA 2016.
Tissue donation
In 2015, there were 4,027 donors of tissue including musculoskeletal, cardiovascular and skin, but excluding eyes. Of these, 368 were deceased donors, who gave 569 tissue donations, a 9.0% increase from the 522 donated in 2014 and a 74% increase from the 327 donated in 2012. The 3,659 living tissue donors (91%) were mainly patients undergoing joint replacement surgery. (Joint replacement surgery makes someone a candidate for live tissue donation because their hip joint is being removed and replaced with a prosthetic, and bone from the damaged hip joint can then be donated.) There were 3,687 living tissue donors in 2014 and 3,652 in 2012.
There were 1,266 deceased eye donors in 2015—a 37% increase from 922 donors in 2009 and a 9% increase from 1,162 donors in 2014 (AOTDTA 2015).
Transplants
The numbers of organs transplanted and of transplant recipients increased by 58% and 55%, respectively, between 2009 and 2015. In 2015, 1,483 organs were transplanted from deceased donors, compared with 938 in 2009, and 1,241 people received transplants compared with 799 in 2009.
The number of organs transplanted and the number of transplant recipients in 2015 were both 12% higher than in 2014 (1,328 organs transplanted and 1,108 transplant recipients) (Figure 6.13.1).
In 2015, kidneys were the organ most frequently transplanted from deceased donors (718), followed by lungs (375) (AOTDTA 2016). In 2014, there were 267 living donor kidney transplants (ANZDATA 2016).
Organs transplanted from deceased donors, 2015
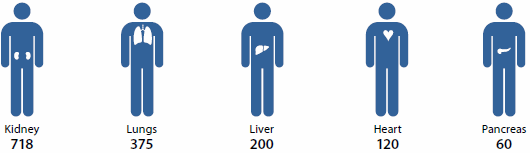
Note: One intestinal transplant is not included.
In 2015, there were 2,124 corneal transplants from deceased donors, with all requests for eye tissue for transplantation being met. This was a 45% increase from the 1,467 corneal transplants in 2009 and a 12% increase from the 1,897 in 2014 (AOTDTA 2016).
What is missing from the picture?
The AIHW's National Hospital Morbidity Database has the potential to complement the Australian Organ and Tissue Donation and Transplantation Authority's (AOTDTA) reported data, with information available on procedures, patient diagnoses and other information for most deceased donations, all live donations and all transplants.
Where do I go for more information?
More information is available from the AOTDTA, the Australian and New Zealand Dialysis and Transplant Registry and the AODR.
References
ANZDATA (Australia and New Zealand Dialysis and Transplant Registry) 2016. Chapter 9: kidney donors. In: 38th Annual ANZDATA Report. Adelaide: ANZDATA.
AOTDTA (Australian Organ and Tissue Donation and Transplantation Authority) 2015. Facts and statistics. Canberra: AOTDTA.
AOTDTA 2016. Australian donation and transplantation activity report 2015. Canberra: AOTDTA.
6.14 Safety and quality in Australian hospitals
The safety and quality of care provided to patients in Australia's hospitals is of utmost importance to all patients, and it is a key focus for Australian governments and service providers.
The definition of safety and quality can vary slightly, depending on source. Australia's National Health Performance Framework (NHPF), defines safety as 'the avoidance, or reduction to acceptable limits, of actual or potential harm from health care management or the environment in which health care is delivered' (NHISSC 2009). The Australian Commission on Safety and Quality in Health Care (the Commission) defines safety as 'reducing the risk of unnecessary harm associated with health care to an acceptable minimum' (ACSQHC 2015).
In the NHPF there is no specific 'quality' domain, as quality is described as relating to a number of domains including 'Effectiveness, 'Continuity of care, 'Accessibility' and 'Responsiveness' (see 'Chapter 7.1 Indicators of Australia's health'). The Commission defines quality as 'the degree to which health services for individuals and populations increase the likelihood of desired health outcomes, and are consistent with current professional knowledge' (ACSQHC 2015).
The Commission is Australia's key agency providing national leadership for improving health care safety and quality for both hospitals and other health care providers (see Box 6.14.1). There are also many other organisations integral to efforts to improve safety and quality at the state or territory level, or for particular components of the health sector. The efforts to improve safety and quality include public reporting of information on health care safety and quality, including that undertaken by the AIHW. These efforts are also accompanied by activities undertaken by health service providers to measure and monitor performance within their organisations to improve clinical outcomes and the appropriateness of services.
This article summarises how information on the safety and quality of care in Australia's hospitals is publicly reported. It presents information on the safety and quality measures that are routinely reported, including international comparisons. It also reports on the recent work of the Commission on variation in health care across Australia as it relates to the safety and quality of hospital care.
Box 6.14.1: The Australian Commission on Safety and Quality in Health Care
The Commission is a national agency that leads and coordinates improvements in safety and quality in health care across Australia. The Commission engages in collaborative work in patient safety and health care quality that benefits service providers and receivers using the Australian health system including through:
- provision of strategic advice to health ministers on best practices to improve the safety and quality of health care
- developing and supporting national clinical care standards
- developing national health care safety and quality related indicators
- working to reduce unwarranted variation in practice and outcomes for individuals and populations
- coordinating national action to address health care-associated infections and antimicrobial resistance (ACSQHC 2015).
A key area of work for the Commission is the development and implementation of the first National Safety and Quality Health Service (NSQHS) Standards. The 10 NSQHS Standards provide a nationally consistent statement about the level of care consumers can expect from health services. All public and private hospitals in Australia are required to be accredited against these standards through an accreditation scheme developed by the Commission. The work of the Commission supports the implementation of these standards to drive ongoing safety and quality improvement in Australian hospitals.
The first NSQHS standard, 'Governance for safety and quality in health service organisations', requires that regular reports on safety and quality indicators and other safety and quality performance data are monitored by health service organisation leaders.
To support such local efforts to monitor and improve hospital safety and quality the Commission develops and maintains a number of indicators, and produces tools to support their use (ACSQHC 2016). These include 'Core hospital-based outcome indicators'; 'Hospital-acquired complications'; 'Classification of hospital-acquired diagnosis'; and indicators to support the implementation of clinical care standards. The Commission is also developing 'core common questions' for patient experience surveys in hospitals and 'staff experience and organisational culture measurement.
In addition, the Commission disseminates information relating to health care safety and quality in its annual report The state of safety and quality in Australian health care and in reports such as the Australian atlas of healthcare variation (see 'Health care variation and hospitals' later in this article).
National reporting on hospital safety and quality
National reporting on safety and quality (across jurisdictions and over time) supports accountability and transparency in service provision and also has the potential to create incentives for improved safety and quality.
There are a number of national agreements and frameworks that support national monitoring and reporting of the safety and quality of patient care in hospitals. For example, performance indicators are included in the National Healthcare Agreement (NHA), the NHPF, and the Performance and Accountability Framework of the National Health Reform Agreement. (See 'Chapter 7.1 Indicators of Australia's health' for more information on these indicator frameworks and Table 6.14.1 in this article).
Selected indicators of hospital safety and quality
This section presents information on national indicators of safety and quality of the care for admitted patients in Australian hospitals that are routinely nationally reported. The indicators are:
- health care-associated infections: Staphylococcus aureus bacteraemia (SAB) cases in public hospitals
- adverse events treated in hospital
- falls resulting in patient harm in hospitals
- unplanned hospital readmission rates
- patient satisfaction/experience.
Information on adverse events, falls and unplanned readmissions is derived from the AIHW's National Hospital Morbidity Database (NHMD). It should be noted that the data in the NHMD are collected primarily for the purposes of recording care provided to admitted patients and that their use for purposes such as reporting adverse events has not been validated for accuracy in Australia. The results should therefore be treated with caution (AIHW 2015a).
Note too, that the available information does not provide a complete picture. For example, there is no routinely available information on some aspects of quality, such as continuity or responsiveness of hospital services.
Health care-associated infections: Staphylococcus aureus bacteraemia cases in public hospitals
SAB is a type of infection often associated with health care. It occurs when Staphylococcus aureus bacteria ('Golden staph') cause an infection of the bloodstream (bacteraemia). When associated with health care procedures, these infections are considered to be potentially preventable.
Patients who develop SAB are more likely to suffer complications that result in longer stays in hospital, and the most serious infections can result in death.
The bacteria that cause SAB are frequently found on the skin or in the nose and are commonly spread from person to person in the community. In this form, they are usually harmless and most people are unaware that they are carrying them.
Table 6.14.1: National reporting frameworks and safety and quality indicators for hospitals
| Framework | Purpose | Indicators of safety and quality in hospitals | Reported in |
|---|---|---|---|
| The National Health Performance Fra mework 2009 (revised) | To provide a structure for reporting on Australia's health status and the performance of the Australian health system at the national level | Adverse events treated in hospitals Falls resulting in patient harm in care setting |
AIHW's Australian hospital statistics series annually and in Australia's health every two years |
| Performance and Accountability Framework 2011 | To support a safe, high quality Australian health system, through improved transparency and accountability | Staphylococcus aureus bacteraemia cases in hospitals Patient experience Unplanned readmissions(a) Hospital standardised mortality ratio(a) Death in low-mortality diagnosic related groups(a) In hospital mortality rates(a) Health care-associated Clostridium difficile infections(a) Rate of community follow-up within the first seven days of discharge from a psychiatric admission(a) |
Individual hospitals on the MyHospitals website (managed by AIHW from July 2016and formerly by the National Health Performance Authority) Primary Health Networks on the MyHealthyCommunities website (managed by AIHW from July 2016 and formerly by the National Health Performance Authority) |
| The National Healthcare Agreement 2012 | To clarify the roles and responsibilities that guide the Commonwealth and states and territories in delivery of services across the health sector and to define shared objectives, outcomes, and performance indicators | Staphylococcus aureus bacteraemia cases in hospitals Unplanned readmissions Patient experience |
AIHW's Australian hospital statistics series The Steering Committee for the Review of Government Service Provision's Review of government services reports Australian Bureau of Statistics (ABS) Patient experiences in Australia |
- Not yet reported.
In hospitals, transmission is most commonly via the hands of health care workers. Bacteria can gain direct entry into the patient's bloodstream if they have open wounds or when devices that pierce the skin are used, such as for giving intravenous fluids or for taking blood samples. Hospitals aim to have as few SAB cases as possible.
Patients who have a greater risk of infection than the general public are those with open wounds; invasive devices such as catheters; weakened immune systems (associated with cancer, or with transplant receipt, or with being very young or elderly); chronic disease such as diabetes or severe underlying illness; or prolonged or recurrent exposure to antibiotics (AIHW 2015b).
The rate of SAB is a performance indicator for the NHA outcome area of Australians receive appropriate high quality and affordable hospital and hospital-related care. A performance benchmark for public hospital-associated SAB is included for that outcome area: the rate of SAB (including methicillin-resistant Staphylococcus aureus, or MRSA) is no more than 2.0 per 10,000 days of patient care for acute care public hospitals in each state and territory.
In 2014-15:
- the national rate of SAB in public hospitals was 0.8 cases per 10,000 days of patient care
- all jurisdictions had rates below the national benchmark
- most cases of SAB (78%) were treatable with commonly used antibiotics. These cases are termed methicillin-sensitive Staphylococcus aureus (MSSA) cases, while 22% of cases were MRSA (antibiotic resistant) cases (AIHW 2015b).
Between 2010-11 and 2014-15:
- rates of SAB decreased from 1.1 cases to 0.8 cases per 10,000 days of patient care
- the overall number of SAB cases decreased from 1,876 to 1,490. The number of MRSA cases decreased from 505 to 331 (Figure 6.14.1).
Figure 6.14.1: Cases of Staphylococcus aureus bacteraemia (SAB) in public hospitals, by antibiotic sensitivity status (MSSA or MRSA), 2010-11 to 2014-15
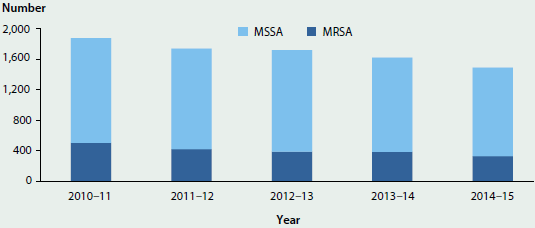
Source: AIHW 2015b.
Improvement in the hand hygiene of health care workers is the highest priority for reducing the risk of health care-associated infections. Between July 2009 and June 2015, hand hygiene compliance in public hospitals increased from about 64% to 82% (HHA 2015).
Adverse events treated in hospitals
'Adverse events treated in hospitals' is an NHPF performance indicator under the dimension of 'Safety' (see 'Chapter 7.1 Indicators of Australia's health'). It is a measure of the safety and quality of the care provided to admitted patients, and encompasses a range of events, rather than focusing on one type, such as readmissions or falls.
Adverse events are defined as incidents in which harm resulted to a person receiving health care. They include adverse effects of drugs, injuries that occur during care, and conditions that occur following procedures such as infections and bleeding. Some of these adverse events may be preventable.
Adverse events such as these can lead to increased length of stay and poorer patient outcomes, along with increased costs of treatment. 'Adverse events treated in hospitals' is based on events that have been identified by the treating doctor in the clinical record, indicating that an adverse event has resulted in, or affected, hospital admission.
This indicator is limited to adverse events that can be identified by specific codes and therefore may not include all adverse events.
In 2013-14:
- almost 547,000 hospitalisation reports indicated that one or more adverse events had resulted in, or affected the hospitalisation. These reports accounted for about 6.7 per 100 hospitalisations in public hospitals and 4.1 per 100 hospitalisations in private hospitals (Figure 6.14.2). The data for public hospitals are not comparable with the data for private hospitals because their casemixes differ and recording practices may be different
- the most common adverse event groups reported for public hospitals were Procedures causing abnormal reactions/complications (52%) and Adverse effects of drugs, medicaments and biological substances (37%)
- the most common adverse event group reported for private hospitals was Procedures causing abnormal reactions/complications (70%)
- overnight hospitalisations had higher rates of adverse events (11 per 100) than same-day hospitalisations (1.7 per 100)
- hospitalisations for subacute and non-acute care had higher rates of adverse events (10.5 per 100) than acute care hospitalisations (5.4 per 100)
- emergency hospitalisations had higher rates of adverse events (9.9 per 100) than non-emergency hospitalisations (4.1 per 100).
Other ways to assess the safety and quality of care provided to admitted patients cover a wider range of issues reported as either arising (or being acquired) during the hospital episode; these measures are not recognised as performance indicators and information on them is presented in Box 6.14.2.
Figure 6.14.2: Adverse events per 100 hospitalisations, all hospitals, 2013–14
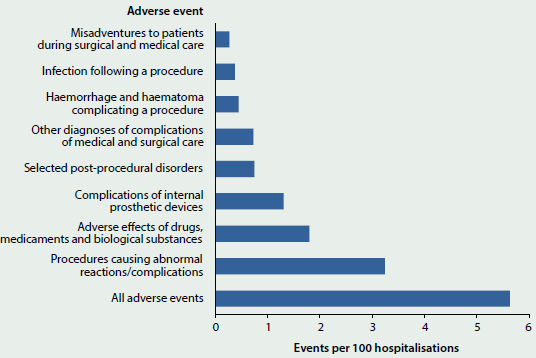
Note: The adverse events presented are not mutually exclusive. For example, a hospitalisation may have both a diagnosis for 'Selected post-procedural disorders' and an external cause of 'Procedures causing abnormal reactions/ complications. In addition, a hospitalisation may include more than one adverse event.
Box 6.14.2: Other measures relating to the overall safety and quality of care in hospitals
Information presented in this box relates to other measures of the overall safety and quality of care provided to admitted patients that are not performance indicators. These measures overlap with each other and with the safety and quality performance indicators presented in this article. These measures and the performance indicators should not be added together due to the overlap.
Conditions that arose during the hospital stay
This measure includes all conditions which arose during the episode of admitted patient care and were not present on admission. Not all conditions that arise during a hospitalisation are classified as adverse events. Conditions that arise during a hospital stay are identified using a 'condition onset flag' (this is a means of differentiating between conditions that were present on admission, or arose during the episode of care).
These condition onset flag data are available for about 91% of hospitalisations in public hospitals and about 72% of hospitalisations in private hospitals.
In 2013-14:
- about 717,000 hospitalisations were affected by a condition that arose during the hospital stay. These accounted for about 10% of hospitalisations in public hospitals and 6% of hospitalisations in private hospitals
- hospitalisations for childbirth had the highest proportion recording a condition that arose during the hospital stay, in both public and private hospitals and for same-day and overnight hospitalisations. This was 58% and 54% for overnight hospitalisations in public and private hospitals respectively and 33% and 36% for same-day, public and private hospitalisations respectively
- approximately 31% of conditions that arose during the hospital stay were also classified as adverse events and 91% were classified as a hospital-acquired diagnosis.
Hospital-acquired conditions (diagnoses)
The 'Classification of hospital-acquired diagnoses' is a classification system that allows hospitals to identify, count and monitor adverse events, as markers of patient safety. For the most part, the occurrence of a hospital-acquired condition is identified using the condition onset flag along with diagnosis information. These condition onset flag data are available for about 91% of hospitalisations in public hospitals and about 72% of hospitalisations in private hospitals.
In 2013-14:
- more than 709,000 hospitalisations reported a hospital-acquired condition. These accounted for about 9.9% of hospitalisations in public hospitals and 6.0% in private hospitals
- for public hospitals, the most common hospital-acquired conditions were Labour, delivery and postpartum complications and Cardiovascular complications (accounting for 20% and 16% of hospitalisations that included a hospital-acquired condition, respectively)
- for private hospitals, the most common hospital-acquired conditions were Gastrointestinal complications accounting for 18% of hospitalisations that included a hospital-acquired condition
- Post-procedural complications accounted for about 14% of hospital-acquired conditions in public hospitals and 16% in private hospitals
- about 31% of hospital-acquired conditions were also classified as 'Adverse events treated in hospital' and 97% were classified as 'Conditions that arose during the hospital stay'.
Falls resulting in patient harm in hospitals
'Falls resulting in patient harm in hospitals' is a performance indicator under the NHPF domain of 'Safety' (see 'Chapter 7.1 Indicators of Australia's health'). This indicator is intended to report where a fall occurred in hospital during the episode of care, resulting in patient harm. 'Falls resulting in patient harm in hospitals' is a subset of 'Adverse events treated in hospital'.
The indicator identifies falls occurring in any health service area as it is not currently possible to identify falls as occurring specifically in hospitals. Therefore, these rates may overestimate falls in hospitals. However, patients with an injury as the primary reason for hospitalisation are excluded to minimise the inclusion of falls that occurred before admission. These rates may also be underestimated as the place of occurrence was not reported for about 26% of hospitalisations with a fall recorded.
In 2013-14, more than 30,000 hospitalisations, or 3.1 per 1,000 hospitalisations, reported a fall. More falls were reported for public hospitals (4.2 per 1,000 hospitalisations) than for private hospitals (1.6 per 1,000). The difference between the rates in public and private hospitals may reflect differences in casemix and recording practices.
These data should be treated with caution. A study by the Commission showed that the rate of recording falls in the medical records varied between hospitals, with some hospitals recording falls better in incident reporting systems (ACSQHC 2012).
Unplanned readmissions
'Unplanned or unexpected readmissions after surgery' is an NHA performance indicator for the outcome Australians receive appropriate high quality and affordable hospital and hospital-related care. It is regarded as an indicator of the safety and quality of admitted patient care in hospitals.
This indicator includes hospitalisations for which an unplanned readmission to the same public hospital occurred within 28 days following surgery (for selected surgical procedures) (Figure 6.14.3), and the cause of the hospitalisation was an adverse event. The diagnosis codes used to identify adverse events for unplanned readmissions are a subset of those used in 'Adverse events treated in hospitals', and 'Unplanned readmissions' account for 0.4% of hospitalisations with 'Adverse events'.
In 2013-14, rates of readmission to the same public hospital were 33 per 1,000 hospitalisations for Tonsillectomy and adenoidectomy and 3.1 per 1,000 for Cataract extractions (Figure 6.14.3). The rate for Tonsillectomy and adenoidectomy readmissions was higher than in 2011-12, when it was 28 per 1,000, but similar to 2012-13 (33). Cataract extraction readmission rates were similar for all 3 years (3.2 per 1,000 in 2011-12 and 3.4 in 2012-13) (AIHW 2013, 2014).
Patient experience
'Patient experience' is an NHA performance indicator in the outcome area of 'Australians have positive health and aged care experiences which take account of individual circumstances and care needs'. A patient experience survey is one tool that health services can use to assess whether they are meeting the needs of the patient.
Figure 6.14.3: Readmissions within 28 days to the same public hospital after selected types of surgery, 2013–14
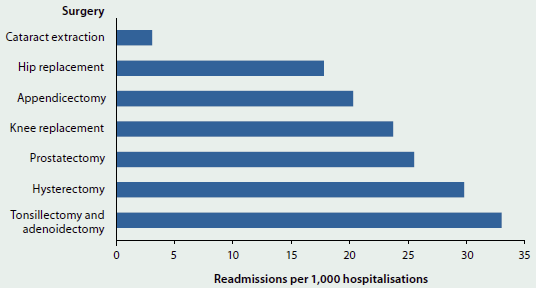
Note: Excludes data for WA.
Source: AIHW 2015a.
The ABS Patient Experience Survey included about 19,000 people aged 15 and over in 2014-15. Of these, more than 2,500 people (14%) had attended a hospital in the past 12 months, either as an admitted patient or as an emergency department patient. The survey asked patients whether doctors or nurses:
- listened carefully to them
- showed respect to them
- spent enough time with them.
The survey found that at least 86% of patients responded 'always' or 'often' to each of these questions for both doctors and nurses. More than 90% of patients responded 'always' or 'often' to the questions about whether the doctors or nurses showed respect to them (ABS 2015).
Health care variation and hospitals
In 2015 the Commission published the Australian atlas of healthcare variation (ACSQHC and NHPA 2015). Understanding variation across geographic areas is important to improving the appropriateness of health care, including hospital care, and increasing the value obtained from resources allocated to health.
The Australian atlas of healthcare variation reported substantial variation in health care use in six clinical areas, including prescribing and diagnostic, medical and surgical interventions. Some of these differences would reflect variation in the provision of hospital care, although many would also reflect variation in the provision of non-hospital care. Some variation in health care use is expected if associated with differences in patients' health, or personal preferences. However, the Commission found that much of the variation was likely to be unwarranted. This may mean that some people are receiving inappropriate or unnecessary care, while others may be missing out on care that might be beneficial.
Hospital-related examples from the Australian atlas of healthcare variation include Knee arthroscopy and Hysterectomy and endometrial ablation.
Variation in knee arthroscopy rates
In 2012-13, more than 33,000 knee arthroscopy operations were performed for patients aged 55 and over. This was the case despite evidence that knee arthroscopy is of limited value for people with osteoarthritis and may cause harm.
The rates of knee arthroscopy varied across states and territories, from 264 per 100,000 people aged 55 and over in the Australian Capital Territory, to 980 in South Australia. Hospitalisations for patients aged 55 and over were seven times as high in some local areas than other areas, ranging from 1,319 hospitalisations per 100,000 population to 185 per 100,000 (Figure 6.14.4). After excluding the highest and lowest results, the knee arthroscopy hospitalisation rates were up to 4.2 times higher in some areas compared with others.
Hospitalisation rates for knee arthroscopy tended to be higher in Inner and Outer regional areas than in Major cities (ACSQHC and NHPA 2015).
Figure 6.14.4: Age-standardised rate of knee arthroscopy hospitalisations per 100,000 people aged 55 and over, by local area, 2012-13
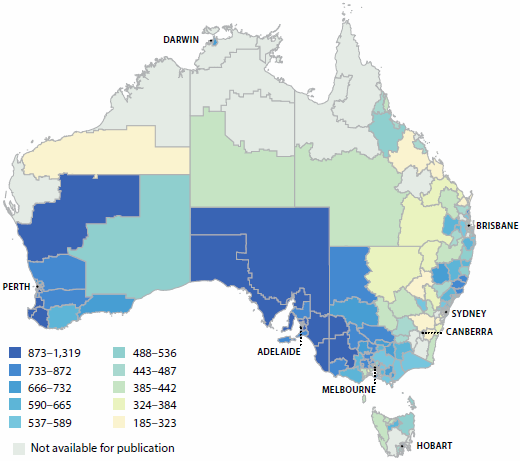
Note: For this item, 'local area' refers to an ABS standard geographic region known as a Statistical Area Level 3 (SA3).
Source: ACSQHC and NHPA 2015.
Variation in hysterectomy and endometrial ablation rates
The average number of hospitalisations for hysterectomy and endometrial ablation varied across states and territories, from 225 per 100,000 women in the Northern Territory, to 349 in Western Australia. The number of hospitalisations ranged from 131 per 100,000 women in a local area to 687 (Figure 6.14.5). After excluding the highest and lowest results, the hysterectomy and endometrial ablation hospitalisation rates were up to 3.3 times higher in some areas compared with others.
Hospitalisation rates for hysterectomy and endometrial ablation were markedly higher in Inner and Outer regional areas than in Major cities or in Remote areas. There was no clear link between rates and high or low socioeconomic areas (ACSQHC & NHPA 2015).
Figure 6.14.5: Age-standardised rate of hysterectomy and endometrial ablation hospitalisations per 100,000 women, by local area, 2012-13
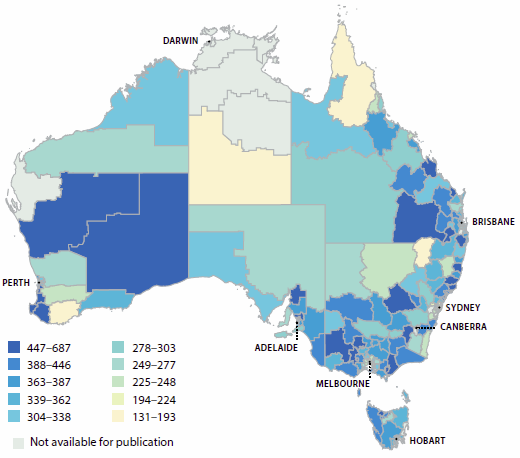
Note: For this item, 'local area' refers to an ABS standard geographic region known as a Statistical Area Level 3 (SA3).
Source: ACSQHC and NHPA 2015.
International comparisons
Australia also monitors the safety and quality of Australia's health services through participation in the Organisation for Economic Co-operation and Development (OECD) Health Care Quality Indicators (HCQI) project. The HCQI project defines a common set of indicators for use across OECD member countries, which are reported at the national level and enable international comparison. The OECD publishes selected data in the OECD's Health at a glance series (OECD 2015).
The OECD acknowledges the challenge in collating data of this type in a comparable manner, and suggests that some caution should be taken in interpreting the results. Differences in hospital admission practices/criteria, data coding practices, and sources of data (for example, whether based on hospital administrative data or registry-based data) can result in large variations in rates reported.
Table 6.14.2 lists the patient safety-related indicators that were reported to the most recent OECD collection, and indicates how Australia compares against the OECD averages.
In Australia the Post-operative wound dehiscence rate per 100,000 (75) was lower than the OECD average (220), as was the rate for Post-operative pulmonary embolism (363 per 100,000 compared with 531). Other patient safety indicator rates were higher than the OECD average.
| HCQI indicator | Australia | OECD average |
|---|---|---|
| Rate per 100,000 hospitalisations | - | - |
| Foreign body left in during procedure | 8.6 | 5.7 |
| Post-operative deep vein thrombosis | 787 | 336 |
| Post-operative pulmonary embolism | 363 | 531 |
| Post-operative sepsis | 1,445 | 967 |
| Post-operative wound dehiscence (wound rupture) | 75 | 220 |
| Rate per 100 vaginal deliveries | - | - |
| Obstetric trauma—vaginal delivery with instrument | 7.3 | 6.0 |
| Obstetric trauma—vaginal delivery without instrument | 2.4 | 1.6 |
Notes
-
Caution should be taken in interpreting these findings due to differences in data capture and reporting that may influence the reported rates.
-
OECD rate is for 2013 (or nearest year).
Source: AIHW 2016.
In addition to variation in recording practices, Health at a glance 2015 notes that in 'some cases, higher adverse event rates may signal more developed patient safety monitoring systems and a stronger patient safety culture rather than worse care' (OECD 2015:144). A number of features of Australian patient safety monitoring would support the claim that Australia is one of those countries that has a more developed patient safety monitoring system (AIHW forthcoming).
What is the AIHW doing?
The AIHW is currently undertaking work to improve the NHA unplanned hospital readmission rates performance indicator.
The AIHW's work involves the refinement of the list of principal diagnoses that can be used to indicate an unplanned readmission as specifically relevant to each of the seven types of surgical procedures. The work is also incorporating different lengths of time (between 7 and 60 days) for a principal diagnosis to signal an unplanned readmission for each type of surgery. Work is also being undertaken towards identification of readmissions to hospitals other than the one in which the surgery was performed.
What is missing from the picture?
Current public reporting on safety and quality using admitted patient care data is only a small component of what could potentially be reported. There is ongoing effort to enhance the information value of this data collection through the improvement of consistent data collection across states and territories and through the development of indicators and other data analysis methods.
Routine national data linkage to inform safety and quality improvement is also an area for future work. The ability to link data across hospitals or across different health services would enhance our understanding of the patient's journey through the health system and outcomes of care.
Although most jurisdictions and many hospitals already collect and analyse patient experience information, there is a lack of consistency in the information collected that prevents meaningful comparisons between jurisdictions. However, work is being conducted by the Commission to develop standard patient experience measures. These will comprise two short sets of core common questions to assess patients' experiences of overnight hospital care and same-day care. Unlike in the existing ABS Patient Experience Survey, which is population-based, the questions will be administered to recently discharged patients. The resulting information will be a resource for use by public and private services across Australia to pinpoint areas for local service improvement, as well as offering the opportunity for national-level comparisons.
Where do I go for more information?
More information is available at the Commission's website Australian Commission in Safety and Quality in Health Care.
Selected safety and quality information for individual hospitals is available at My Hospitals.
References
ABS (Australian Bureau of Statistics) 2015. Patient experiences in Australia: summary of findings, 2014-15. ABS cat. no. 4839.0. Canberra: ABS.
ACSQHC (Australian Commission on Safety and Quality in Health Care) 2012. An evaluation of the preventing falls and harm from falls in older people best practice guidelines for Australian hospitals. Sydney: ACSQHC.
ACSQHC 2015. Australian Commission on Safety and Quality in Health Care annual report 2014/15. Sydney: ACSQHC.
ACSQHC 2016. Australian Commission on Safety and Quality in Health Care annual report 2015/16. Sydney: ACSQHC.
ACSQHC & NHPA (Australian Commission on Safety and Quality in Health Care and National Health Performance Authority) 2015. Australian atlas of healthcare variation. Sydney: ACSQHC.
AIHW (Australian Institute of Health and Welfare) 2013. Australian hospital statistics 2011-12. Health services series no. 50. Cat. no. HSE 134. Canberra: AIHW.
AIHW 2014. Australian hospital statistics 2012-13. Health services series no. 54. Cat. no. HSE 145. Canberra: AIHW.
AIHW 2015a. Admitted patient care 2013-14: Australian hospital statistics. Health series no. 60. Cat. no. HSE 156. Canberra: AIHW.
AIHW 2015b. Staphylococcus aureus bacteraemia in Australian public hospitals 2014-15: Australian hospital statistics. Health services series no. 67. Cat. no. HSE 171. Canberra: AIHW.
AIHW, forthcoming. OECD health-care quality indicators for Australia 2015. Canberra: AIHW.
HHA (Hand Hygiene Australia) 2015. National data period 1, 2015. Melbourne: HHA.
NHISSC (National Health Information Standards and Statistics Committee) 2009. The National Health Performance Framework (2nd edn). Canberra: AIHW.
OECD (Organisation for Economic Cooperation and Development) 2015. Health at a glance 2015: OECD indicators. Paris: OECD.
6.15 Specialised alcohol and other drug treatment services
Alcohol and other drug (AOD) treatment services assist people to address their drug use through a range of treatments. Treatment objectives can include reduction or cessation of drug use as well as improving social and personal functioning. Assistance may also be provided to support the family and friends of people using drugs. Treatment services include detoxification and rehabilitation, counselling, and pharmacotherapy, and are delivered in residential and non-residential settings. Opioid pharmacotherapy is one treatment option for dependence on opioid drugs, such as heroin and morphine.
In 2011, the cost of treatment (excluding pharmacotherapy treatment alone) for illicit drug use, including amphetamines, cannabis, cocaine, ecstasy and opioids, was estimated at $298 million (Smith et al. 2014). In addition to this, the cost of opioid pharmacotherapy treatment was estimated at $185 million.
Information on publicly funded AOD treatment services in Australia, and the people and drugs treated, are collected through the Alcohol and Other Drug Treatment Services National Minimum Data Set (AODTS NMDS). The National Opioid Pharmacotherapy Statistics Annual Data (NOPSAD) collection contains information on treatment services provided to people dependent on opioid drugs.
Who uses treatment services?
Key characteristics of clients in 2014-15:
| AOD publicly funded agencies (2014-15) | Opioid pharmacotherapy (June 2015 snapshot day) | Recent trends |
|---|---|---|
| Around 115,000 clients (or about 1 in 200 people in the general population) received treatment (around 170,000 episodes). | Over 48,000 clients (or about 1 in 700 people) were on a course of pharmacotherapy treatment for dependence on opioid drugs. | There have been small but steady increases in client numbers in recent years. |
| Just over 2 in 3 clients (67%) were male. | Nearly 2 in 3 clients (65%) were male. | This profile has remained consistent over time across both client groups. |
| Over half of clients (54%) were aged 20-39. | Clients were slightly older on average than those in AOD agencies—more than 2 in 3 (68%) were aged 30-49. | In recent years the age profile of people receiving treatment suggests an ageing cohort across both client groups. |
| Nearly 1 in 7 (15%) clients were Indigenous Australians. | One in 10 clients (10%) were Indigenous Australians. | Indigenous Australians continue to be over-represented. |
| Most clients (86%) received treatment at one agency. | Nearly three-quarters (72%) of clients received their pharmacotherapy drug from a pharmacy. | This profile has remained consistent over time. |
| Just over three-quarters (76%) of agencies provided treatment for up to 200 clients. | Two in 5 (40%) of prescribers treated between 1 and 5 clients. | Treatment services have continued to expand: since 2010-11 the number of AOD agencies has risen by 27% and the number of prescribers of opioid pharmacotherapy by 60%. |
Which drugs do people seek treatment for?
From the AODTS NMDS:
- Alcohol (38%), cannabis (24%), amphetamines (20%) and heroin (6%) were the top four drugs leading clients to seek treatment in 2014-15.
- The proportion of clients receiving treatment for alcohol increased substantially with age—whereas the opposite was true for cannabis (Figure 6.15.1).
- In more than half (53%) of treatment episodes in 2014-15, the client reported additional drugs of concern—most commonly nicotine and cannabis (AIHW 2016a).
Figure 6.15.1: Principal drug of concern for clients, by age, 2014-15
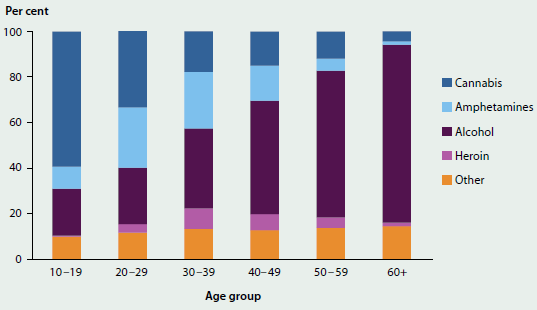
Source: AODTS NMDS.
From NOPSAD:
-
Heroin was the most common opioid drug of dependence for clients on a course of pharmacotherapy treatment for their opioid drug of dependence, and 2 in 3 clients were treated with methadone on a snapshot day in June 2015 (AIHW 2016b).
What is missing from the picture?
It is difficult to fully quantify the scope of AOD services in Australia. There are a variety of settings in which people receive treatment for alcohol and other drug-related issues that are not in scope for the AODTS NMDS. These include services provided by not-for-profit organisations and private treatment agencies that do not receive public funding; for example, hospitals, prisons, correctional facilities and detention centres, primary health care services, and accommodation services (Figure 6.15.2).
Figure 6.15.2: AOD treatment and support services in Australia
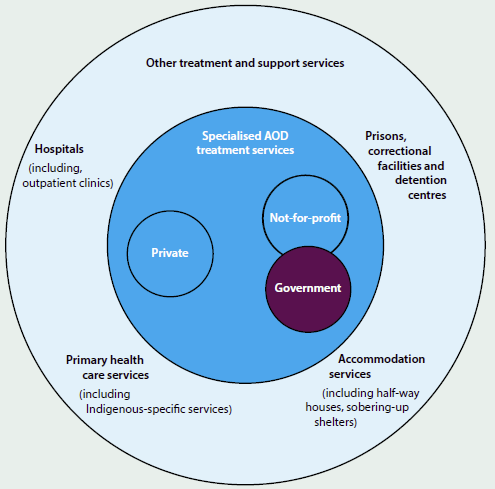
Note: Those in scope for the AODTS NMDS are shaded darker.
Because of the specifications for each collection and the complexities of the sectors, it is not possible to identify people who receive a course of pharmacotherapy treatment via a dosing point site as well as treatment from a publicly funded AOD service. In addition, the AODTS NMDS and the NOPSAD collection do not cover all agencies providing substance-use services to Indigenous Australians. These agencies provide data to the Online Services Report collection.
Where do I go for more information?
More information on specialised AOD treatment services in Australia is available at AIHW website Alcohol and other drugs. The reports Alcohol and other drug treatment services in Australia 2013-14 and National opioid pharmacotherapy statistics 2014 can be downloaded for free.
For more information on issues related to AOD treatment services, see 'Chapter 4.5 Illicit drug use' and 'Chapter 4.6 Alcohol risk and harm'.
References
AIHW (Australian Institute of Health and Welfare), forthcoming 2016a. Alcohol and other drug treatment services in Australia 2014-15. Canberra: AIHW.
AIHW 2016b. National opioid pharmacotherapy statistics 2015. Canberra: AIHW.
Smith RG, Jorna P, Sweeney J & Fuller G 2014. Counting the costs of crime in Australia: a 2011 estimate. Research and Public Policy Series 129. Canberra: Australian Institute of Criminology.
6.16 Mental health services
Mental illness contributes substantially to the burden of disease in the community (see 'Chapter 3.11 Mental health' and 'Chapter 5.5 Mental health of Australia's young people and adolescents'). In Australia, people with mental illness have access to a variety of support services provided by a range of health care professionals in a number of care settings (Figure 6.16.1).
Figure 6.16.1: Overview of mental health services and workforce
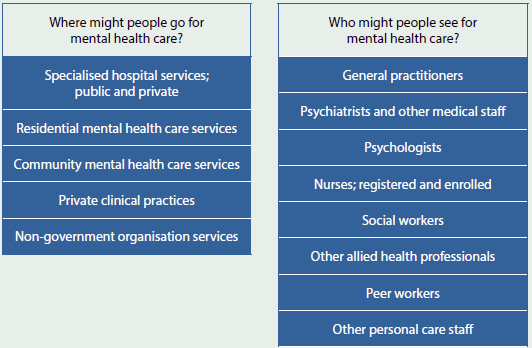
Service use
A substantial number of support services are provided to people with a mental illness each year. For example, state and territory community mental health care services provided more than 8.7 million contacts in 2013-14 (Table 6.16.1).
Medicare-subsidised mental health-related services
Medicare-subsidised services are provided by psychiatrists, general practitioners (GPs), psychologists and other allied health professionals (social workers, mental health nurses and occupational therapists). The services are provided in a range of settings— hospitals, consulting rooms, home visits and over the phone.
There was an average annual increase of 6.7% in the number of Medicare-subsidised mental health-related services over the 5-year period to 2013-14 (Figure 6.16.2). This can be mainly attributed to increasing uptake of the Better Access initiative (implemented in November 2006), which gives patients Medicare-subsidised access to psychologists and other allied health providers after the preparation of a Mental Health Treatment Plan by a GP.
| Service type | Volume | Selected findings |
|---|---|---|
| Medicare-subsidised mental health-related services(a) | 9 million services | General practitioners (29%) were the largest providers of these services. |
| People accessing Medicare-subsidised mental health-related services(a) | 1.9 million people | More females (1,200,000) than males (750,000) used these services. |
| PBS/RPBS subsidised prescriptions | 34 million prescriptions | Antidepressant medication accounted for over 67% of all subsidised mental health-related prescriptions. |
| Community mental health care service contacts | 8.7 million contacts | About one-quarter of all contacts were provided to patients with a principal diagnosis of schizophrenia. |
| Emergency department services | 280,000 services | Almost one-quarter of people accessing these services were aged 15-34. |
| Admitted patient hospitalisations | 240,000 hospitalisations | Admitted patient hospitalisations with specialised mental health care made up 61% of all mental health-related hospitalisations. |
-
Includes psychiatrists, general practitioners, clinical psychiatrists, other psychologists and other allied health services. These services are billed as mental health-related items; which underestimates the total mental health-related activity, especially for services provided by general practitioners.
Note: PBS refers to Pharmaceutical Benefits Scheme; RPBS refers to Repatriation Pharmaceutical Benefits Scheme.
Source: AIHW 2015.
Figure 6.16.2: Medicare-subsidised mental health-related services, by provider type, 2009-10 to 2013-14
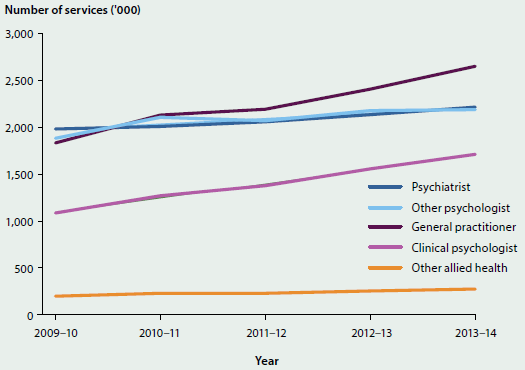
Source: Mental health services in Australia, Medicare-subsidised mental health-related services (AIHW 2015).
Mental health-related prescriptions
There were an estimated 34 million prescriptions for mental health-related medications dispensed in 2013-14, of which 73% (25 million) were subsidised by the Australian Government under the Pharmaceutical Benefits Scheme (PBS) or Repatriation Pharmaceutical Benefits Scheme (RPBS). Of the subsidised prescriptions, the majority (86%) were prescribed by GPs, with another 8.0% prescribed by psychiatrists and 6.5% by non-psychiatrist specialists.
Most mental health-related subsidised prescriptions were for antidepressants (62%, or 15 million), followed by antipsychotics (14%), anxiolytics (12%), and hypnotics and sedatives (8.6%) (Figure 6.16.3).
Figure 6.16.3: Mental health-related subsidised prescriptions dispensed, by group of medication prescribed and prescribing medical practitioner, 2013-14
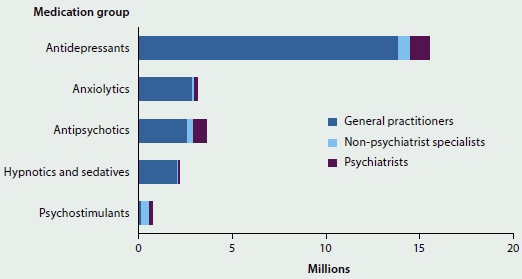
Note: Prescription categories are defined by the Anatomical Therapeutic Chemical classification system (WHO 2011).
Source: Pharmaceutical Benefits Scheme and Repatriation Pharmaceutical Benefits Scheme data (Department of Health 2015).
Workforce
It is not possible to definitively count the total number of people delivering care and support to people with a mental illness. However, we do know that in 2013:
- there were about 23,000 registered psychologists, 20,000 mental health nurses, and 3,000 psychiatrists in Australia
- about one-third (32%) of mental health nurses were male, compared with 1 in 10 (10%) of the general nursing workforce. About two-thirds (63%) of psychiatrists were male compared with 7 in 10 (72%) of all medical specialists. About one-quarter (23%) of psychologists were male
- about one-third (30%) of mental health nurses and 43% of psychiatrists were aged 55 and older. The age profile of registered psychologists was younger, with 73% under 55.
In 2013-14, there were over 30,500 full-time equivalent (FTE) staff employed in state and territory specialised mental health care services. Nationally, this equates to 131 FTE staff per 100,000 population. In the same period, there were about 2,500 FTE staff employed in private hospitals in specialised mental health services, equating to 11 FTE staff employed per 100,000 population. (See 'Chapter 2.3 Who is in the health workforce?' for more information).
Spending
- An estimated $7.6 billion, or $332 per capita, was spent on mental health-related services in 2012-13. This increased by an annual average of almost 6.4% per capita in the 5 years to 2012-13.
- In 2012-13, $4.6 billion, or $201 per capita, was spent on state and territory specialised mental health services, including $2.0 billion on public hospital services and $1.8 billion on community mental health care.
- In 2013-14, $971 million, or $42 per capita, was spent on Medicare-subsidised services. This spending increased by 2.5% per capita over the 5 years to 2013-14.
- In 2013-14, $753 million, or $32 per capita was spent on mental health-related PBS/RPBS-subsidised prescriptions, mostly for subsidy of antipsychotic (57%) and antidepressant (36%) drugs.
What is missing from the picture?
In response to the National Mental Health Commission's 2014 review of existing mental health services and programs, the Australian Government has outlined nine interconnected areas of proposed reforms to its funding and reform role based around six platforms: person-centred funding; a regional approach to service planning and integration; stepped care; early intervention; optimal use of digital technology; and strengthening national leadership. The development of a Fifth National Mental Health Plan (2016-2021), in cooperation with the states and territories, has also been proposed.
Given the systematic reform being proposed, it is anticipated that there will be fundamental changes to the way in which mental health programs and services are integrated and delivered in Australia in the future, and that these will create new and different information needs. The AIHW is currently working with the Australian Government and states and territories to put in place the requisite national mental health data collection infrastructure and the associated reporting mechanisms to be able to monitor and report on relevant data for the mental health system in this changing environment. For example, it is anticipated that data development work will be undertaken to improve the availability and quality of data on coercive practices (such as seclusion and restraint) and on consumer-related measures, including experiences of care.
Where do I go for more information?
More information on mental health and mental health services is available at Mental health services in Australia website.
More information on national outcome measures is available at the Australian Mental Health Outcomes and Classification Network website.
References
AIHW (Australian Institute of Health and Welfare) 2015. Mental health services in Australia. Canberra: AIHW.
Department of Health 2015. Australian Government Response to Contributing Lives, Thriving Communities—Review of Mental Health Programmes and Services. Canberra: Department of Health.
NMHC (National Mental Health Commission) 2014. Report on the National Review of Mental Health Programmes and Services. Sydney: National Mental Health Commission.
WHO (World Health Organization) 2011. ATC: structure and principles. Oslo: WHO Collaborating Centre for Drug Statistics Methodology.
6.17 Health care use by older Australians
Australia's population is ageing, with an increase in both the number of older Australians and the proportion of the total population that is 65 and over. For example, in 2016 there is an estimated 3.7 million people aged 65 and over, up from 2.6 million in 2004 (ABS 2015a). This is expected to double to 7.5 million over the next 30 years (ABS 2013b). However, the change in proportion of older people is less dramatic, growing from 15% of the total population in 2016 to 20% in 2046, as Australia's total population will also grow.
Improved health and changing social attitudes are reshaping the circumstances of our older population, redefining what it means to be 'old' (see Box 6.17.1). Around 7 in 10 Australians aged 65 and over considered themselves to be in good health in 2014-15 (ABS 2015c) and many manage to live independently—with or without community-based supports—until their final days (AIHW 2015c). And good health is itself a resource, enabling older people to contribute socially, culturally and economically to the community.
Box 6.17.1: What do we mean by older Australians?
For many purposes, 'older' is defined as aged 65 and over, based on the original qualifying age for the Age Pension. While this article also uses this convention, a person does not necessarily become frail or dependent at age 65 (or at any other nominated age).
Like the broader Australian population, the group of older people is far from uniform. This diversity, combined with ongoing changes in the health, economic and social circumstances faced by all Australians, results in a very complex range of differing circumstances and needs as we grow older.
Ageing will present challenges to the health care system, given the larger number of older people; the fact that many health conditions and associated disability become more common with age; and that older people are generally higher users of health services than younger Australians. For example, the 2015 Intergenerational report (Treasury 2015) showed that Australian Government expenditure on the Pharmaceutical Benefits Scheme (PBS) in 2012-13, for a person aged 85 or older, was more than four times the average expenditure per person. More generally, the report showed that the ageing of the population is expected to contribute around 10% of the projected increase in Australian Government health spending per person over the next 40 years. The bulk of the remaining projected increase is attributed to non-demographic factors, such as increased consumption, higher wages for health workers, changes in disease patterns, and technological changes.
This article describes major types of health service use for those aged over 65; change over time; and differences in use for the age groups 65-74, 75-84 and 85 and over. It presents results from population surveys and collections on services provided to people aged 65 and over. For more information on data sources, see Box 6.17.2.
Other topics within this publication present information on the health of Australians aged 65 and over (see 'Chapter 3.5 Coronary heart disease', 'Chapter 3.8 Kidney disease', 'Chapter 3.12 Dementia', 'Chapter 3.16 Incontinence' and 'Chapter 5.6 Health and risks of the very old').
Population growth of older Australians
From 30 June 2004 to 30 June 2013, the population aged 65 and over grew by an annual average of 3.0%, compared with an annual average growth of 1.7% for the whole population. While the population aged 65-74 grew by the largest number, the population aged 85 and over grew at a quicker rate (Table 6.17.1).
| Gender | Age group | Population ('000) 30 June 2004 |
Population ('000) 30 June 2013 |
Growth Number ('000) |
Growth Per cent |
Growth Annual average |
|---|---|---|---|---|---|---|
| Males | 65-74 | 658.9 | 919.9 | 261.0 | 39.6 | 3.8 |
| Males | 75-84 | 395.2 | 471.9 | 76.7 | 19.4 | 2.0 |
| Males | 85 and over | 89.8 | 155.2 | 65.4 | 72.8 | 6.3 |
| Males | 65 and over | 1,143.8 | 1,547.0 | 403.1 | 35.2 | 3.4 |
| Females | 65-74 | 694.5 | 943.2 | 248.6 | 35.8 | 3.5 |
| Females | 75-84 | 524.0 | 565.3 | 41.3 | 7.9 | 0.8 |
| Females | 85 and over | 196.5 | 282.1 | 85.6 | 43.6 | 4.1 |
| Females | 65 and over | 1,415.0 | 1,790.5 | 375.5 | 26.5 | 2.6 |
| Persons | 65-74 | 1,353.4 | 1,863.0 | 509.6 | 37.7 | 3.6 |
| Persons | 75-84 | 919.2 | 1,037.2 | 118.0 | 12.8 | 1.4 |
| Persons | 85 and over | 286.3 | 437.3 | 151.0 | 52.8 | 4.8 |
| Persons | 65 and over | 2,558.9 | 3,337.5 | 778.6 | 30.4 | 3.0 |
Source: AIHW analysis of ABS (2015c).
Box 6.17.2: Data used in this feature article
This article presents results from:
- information on medical practitioner consultations from the Medicare Benefits Schedule (MBS) (DHS 2015)
- data on the use of hospitals from the AIHW's National Hospital Morbidity Database (NHMD) and the National Non-admitted Patient Emergency Department Care Database (NNAPEDCD) (AIHW 2015a, 2014)
- the Survey of Disability, Ageing and Carers (SDAC) (ABS 2013a)
- information on specialised public sector mental health services from the AIHW's National Community Mental Health Care Database (NCMHCD) and National Residential Mental Health Care Database (NRMHCD) (AIHW 2015b).
The MBS is an itemised schedule of fees for all medical services that are subsidised by the Australian Government as part of the Medicare Benefits Scheme (DHS 2015). These benefits are based on fees determined for each item (service) provided and, when benefits are paid, statistics are collected on each item.
The NHMD is a compilation of episode-level records from admitted patient data collection systems in Australian hospitals (AIHW 2015a). The episodes of admitted patient care collected in the NHMD are called 'hospitalisations' in this article. The data supplied are based on the NMDS for admitted patient care and include demographic and length of stay information, as well as data on diagnoses of the patients, the procedures they underwent in hospital, and external causes of injury and poisoning. The scope of the NMDS includes all public and private acute and psychiatric hospitals, free-standing day hospitals, and alcohol and drug treatment centres in Australia.
The NNAPEDCD is a compilation of episode-level data for presentations to selected emergency departments (EDs) in Australian public hospitals (AIHW 2014). The data supplied are based on National Minimum Data Set (NMDS) standards and include demographics, triage (urgency) category, waiting times for treatment, and length of time spent in the ED.
The SDAC was most recently conducted by the ABS in 2012 (ABS 2013a). Survey data are created from responses given by a sample of the Australian population. The SDAC data used here focus on the experience of health care use by Australians aged 65 and over who responded in the survey, and exclude people living in cared accommodation and other institutions, or experiencing long-term hospitalisations.
Information in this article on mental health services is taken from the NCMHCD and the NRMHCD (AIHW 2015b). The NCMHCD contains data on community mental health service contacts provided by government-funded community mental health care services, as specified by the Community Mental Health Care NMDS.
The NRMHCD contains data on episodes of residential care provided by government-funded residential mental health services, as specified by the Residential Mental Health Care NMDS.
Care should be taken when comparing different information from data sources on a given topic, particularly where there is information on the SDAC and other data sources. For instance, the SDAC provides information on the number of people, whereas the NHMD provides information on the number of hospitalisations. As well, information on hospitalisations relates to different time periods compared with the SDAC. Data from health services tell a different story (for example, services provided or numbers of hospitalisations) compared with the story that can be told from the SDAC (for example, people's experience of being admitted to hospital during the survey period).
General practitioner consultations
In 2014-15, there were almost 35 million general practitioner (GP) attendances claimed through Medicare by people aged 65 and over (28% of the total 123.1 million). Nearly three-quarters (24.5 million) of all GP consultations for older people were brief or standard consultations of less than 20 minutes in duration and took place during normal hours at the GP's consulting rooms. However, for the oldest age group, a large proportion of consultations took place either at home or within an institutional setting (with residential aged care accounting for the majority).
Attendance rates per 1,000 population showed little variation between the age groups for consultations at a GP's surgery, but rates for institutional or home consultations and after-hours consultations both increased with age (Figure 6.17.1).
Figure 6.17.1: General practitioner consultations, by setting, age-specific usage rates, people aged 65 and over, 2014-15
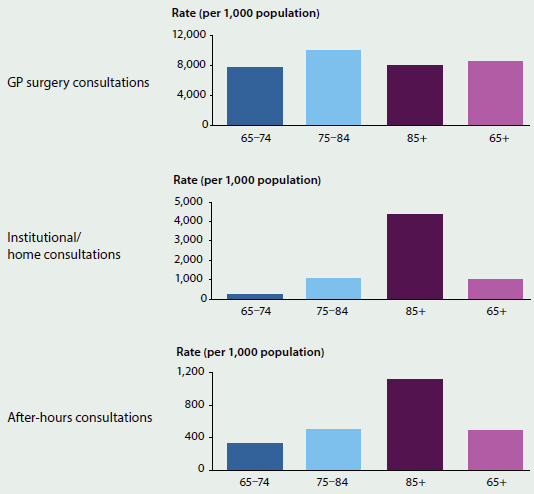
Source: AIHW analysis of Department of Human Services MBS items (DHS 2015).
Experience of GP use
According to the SDAC, in 2012 most people aged 65 and over had visited a GP in the last 12 months. The likelihood of visiting a GP at all, or for urgent medical care, increased slightly with age (Figure 6.17.2).
People aged 65-74 were more likely to report not being able to get a timely appointment as a reason for not visiting a GP. This age group also reported waiting longer than they felt was acceptable for a GP appointment, in all remoteness areas.
There were few differences between the proportions of men and women who had visited a GP in the last 12 months in 2012. Overall, 95% of men, and 98% of women aged 65 and over, had visited a GP.
Figure 6.17.2: Experience of general practitioner consultations, people aged 65 and over, 2012
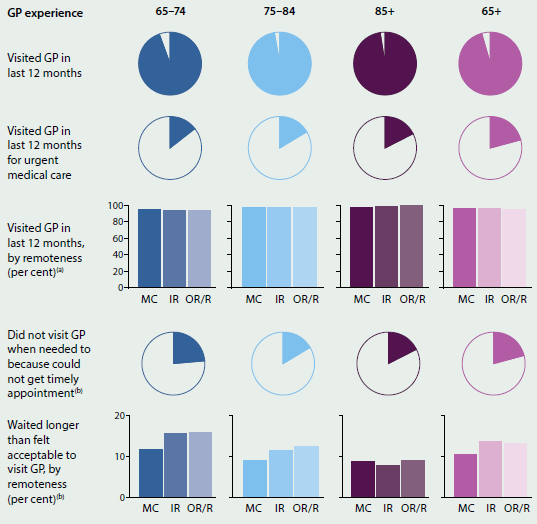
-
MC: Major cities; IR: Inner regional; OR/R: Outer regional and Remote.
-
For most recent visit.
Source: AIHW analysis of 2012 ABS Survey of Disability, Ageing and Carers.
Medical specialist consultations
Older people accounted for 12.4 million specialist attendances claimed through Medicare in 2014-15—43% of all such attendances in that year (of which there were 29 million). Age-specific usage rates increased with age among men, but among women, usage rates were slightly higher for those aged 75-84 than for those aged 85 and over (Figure 6.17.3).
Figure 6.17.3: Medical specialist attendances claimed through Medicare, age-specific usage rates by sex, people aged 65 and over, 2014-15(a)
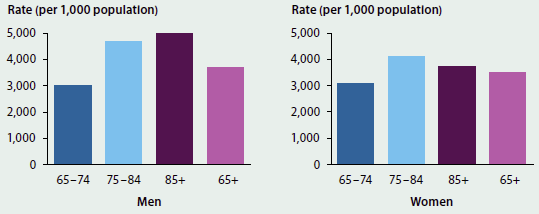
-
Medical specialists as defined by the Medical Benefit Schedule Broad Type of Service for Specialist attendances, 'medical specialists'.
Source: AIHW analysis of Department of Human Services MBS items (DHS 2015).
Experience of medical specialist use
The proportion of people in 2012 who had visited a medical specialist in the last 12 months increased with age, according to the SDAC (Figure 6.17.4). Across all age groups, people living in Major cities were most likely to have visited a specialist in the last 12 months, with the likelihood of visits declining as remoteness increased.
Men aged 65 and over were somewhat more likely to have visited medical specialists in the last 12 months in 2012 (58%, compared with 52% of women in the same age group). Similar differences were also evident between men and women within each age group—for instance, 64% of men and 52% of women aged 75-84 had visited a medical specialist.
Figure 6.17.4: Experience of medical specialist use, people aged 65 and over, 2012
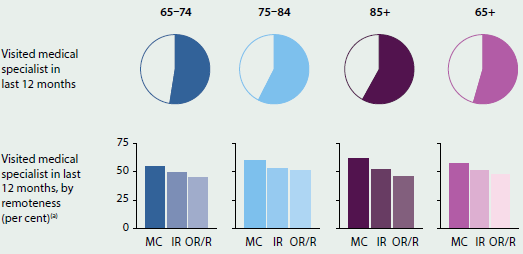
-
MC: Major cities; IR: Inner regional; OR/R: Outer regional and Remote.
Source: AIHW analysis of 2012 ABS Survey of Disability, Ageing and Carers.
Experience of dentist use
The proportion of people in 2012 who had visited a dentist in the last 12 months declined with age, according to the SDAC (Figure 6.17.5). Within each age group, this also declined as remoteness increased: people aged 85 and over living in Outer regional and Remote areas were the least likely of any of these age groups and regions to have visited a dentist in the past 12 months. For those who had not visited a dentist, cost was more likely to be the main reason among the youngest age group.
Among those people who had visited a dentist, in all age groups, the majority had last visited a private dentist. For the small proportion of people who had visited a public dental clinic, wait time varied greatly by age: people aged 75-84 were the least likely to have waited 6 or more months to visit a public dental clinic, while those aged 85 and older were the most likely.
Approximately 51% of men and women aged 65 and over had visited a dentist in the last 12 months in 2012. There were differences between men and women within each age group, but overall, the proportions decreased with age for both genders: 54% of men and 58% of women aged 65-74 had visited a dentist, compared with 44% and 38% for people aged 85 and over.
Figure 6.17.5: Experience of dentist use, people aged 65 and over, 2012
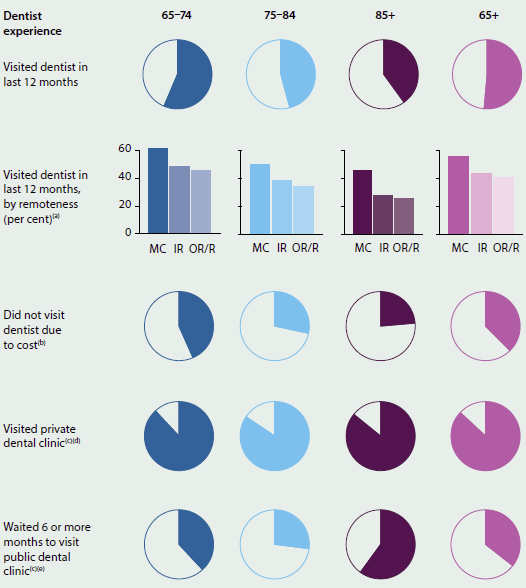
-
MC: Major cities; IR: Inner regional; OR/R: Outer regional and Remote.
-
Excludes people who visited a dentist, or did not state main reason for not visiting a dentist.
-
For most recent visit.
-
Excludes people who did not visit a dentist.
-
Excludes people who did not visit a public dental clinic.
Source: AIHW analysis of 2012 ABS Survey of Disability, Ageing and Carers.
Hospitals
Emergency department presentations
As with all Australians, visits by Australians aged 65 and over to EDs are often the initial step on a pathway to care as an admitted patient or for other specialised care. Most large public hospitals have an ED, whereas smaller hospitals are less likely to have an ED.
Information from the NNAPEDCD demonstrates that there were 1.4 million presentations of Australians aged 65 and over to EDs in 2013-14, representing 19.6% of all ED presentations that year. Of presentations by older Australians, 576,900 were for people aged 65-74, 516,400 for 75-84 year olds and 317,500 for people aged 85 and over.
From 2004-05 to 2013-14, there was an average increase of 6.5% per year in ED usage by Australians aged 65 and over. ED presentations by people aged 85 and over grew the fastest, by 8.3% per year, resulting in ED presentations for this older group more than doubling over the 10 years, from 155,000 to 317,500 (compared with the annual average growth of 6.9% for 65-74 year olds and 5.2% for 75-84 year olds).
In all the years between 2004-05 and 2013-14, there were more presentations to EDs by females aged 65 and over than males. For those aged 65-74, there were more male than female presentations to EDs. In contrast, there were more presentations of females aged 75-84 and 85 and over to EDs than of males.
In 2013-14, the top three diagnoses recorded for Australians aged 65 and over presenting to EDs were Pain in throat and chest, followed by Abdominal and pelvic pain and Syncope and collapse (fainting). Pain in throat and chest was the most common diagnosis for patients aged 65-74, followed by Abdominal and pelvic pain, and Cellulitis. Pain in throat and chest was also the most common diagnosis for patients aged 75-84, followed by Syncope and collapse and Abdominal and pelvic pain. The top three diagnoses for patients aged 85 and over were Other symptoms and signs involving the nervous and musculoskeletal systems (mostly for tendency to fall), Syncope and collapse, and Pain in throat and chest.
EDs in hospitals use 'triage categories' to indicate the urgency of a patient's need for medical and nursing care (see Glossary). The overall distribution of triage categories assigned to Australians aged 65 and over on presentation to EDs was similar in 2004-05 and 2013-14:
- Resuscitation (immediate, within seconds)—represented 1.2% (16,500), of presentations in this age group in 2013-14 and 1.5% in 2004-05. The number of presentations grew, on average, by 3.9% per year, with the largest average growth (6.5% per year) being those aged 85 and over.
- Emergency (within 10 minutes) care—represented 16.9% (237,700) of presentations in this age group in 2013-14 and 13.8% in 2004-05. The number of presentations grew, on average, by 8.9% per year, with the largest average growth (11.3% per year) being for those aged 85 and over.
- Urgent (within 30 minutes) care—represented the largest proportion (41.0%, or 577,600 presentations) of presentations in this age group in 2013-14 and 38.3% in 2004-05. The number of presentations grew, on average, by 7.3% per year, with the largest average growth (9.5% per year) being for those aged 85 and over.
- Semi-urgent (within 60 minutes)—represented 32.9% (462,900) of presentations in this age group in 2013-14 and 37.1% in 2004-05. The number of presentations grew, on average, by 5.1% per year, with the largest average growth (6.2% per year) being for those aged 85 and over.
- Non-urgent (within 120 minutes)—represented 8.1% (114,400) of presentations in this age group in 2013-14 and 9.2% in 2004-05. The number of presentations grew on average at 5.0% per year, with the largest average growth (6.7% per year), being for those aged 85 and over.
Experience of emergency department use
According to the SDAC, the proportion of people in 2012 who reported they had attended an ED in the last 12 months increased for each older age group (Figure 6.17.6). People aged 65-74 were less likely to have attended an ED in the last 12 months, compared with their older counterparts, regardless of geographical region. People aged 85 and over living in Major cities were the most likely to have attended an ED. The likelihood of attending the ED three or more times, or of attending for a serious or life-threatening situation, also increased with age.
A similar proportion (18%) of men and women aged 65 and over had attended an ED in the last 12 months. However, 28% of men aged 85 and over reported attending an ED, compared with 22% of women in the same age group. Among people who had attended an ED, approximately 60% of both men and women aged 65 and over reported the seriousness of their condition as the reason. The likelihood of this was highest among men aged 85 and over (69%).
Figure 6.17.6: Experience of emergency department use, people aged 65 and over, 2012
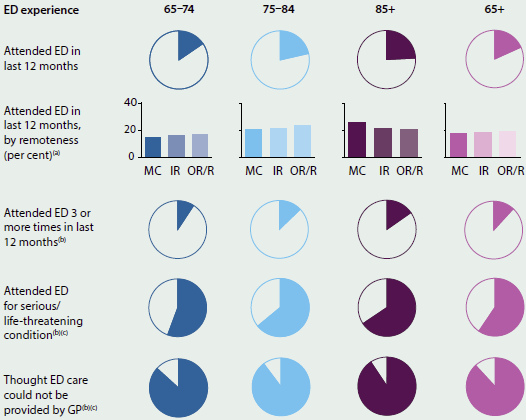
-
MC: Major cities; IR: Inner regional; OR/R: Outer regional and Remote.
-
Excludes people who did not attend emergency department.
-
For most recent visit.
Source: AIHW analysis of 2012 ABS Survey of Disability, Ageing and Carers.
Hospitalisations
The AIHW's NHMD shows that, compared with 10 years ago, Australians aged 65 and over accounted for a greater proportion of all hospitalisations—increasing from 35% of all hospitalisations in 2004-05 to 40% in 2013-14. Hospitalisations for older Australians increased on average by 5.2% per year, from 2.5 million hospitalisations in 2004-05 to 3.9 million in 2013-14. The younger two age groups increased by 3.9% each, while hospitalisations for people aged 85 and over increased on average by 7.0% per year (Figure 6.17.7).
Figure 6.17.7: Hospitalisations, selected measures, 2004-05 to 2013-14
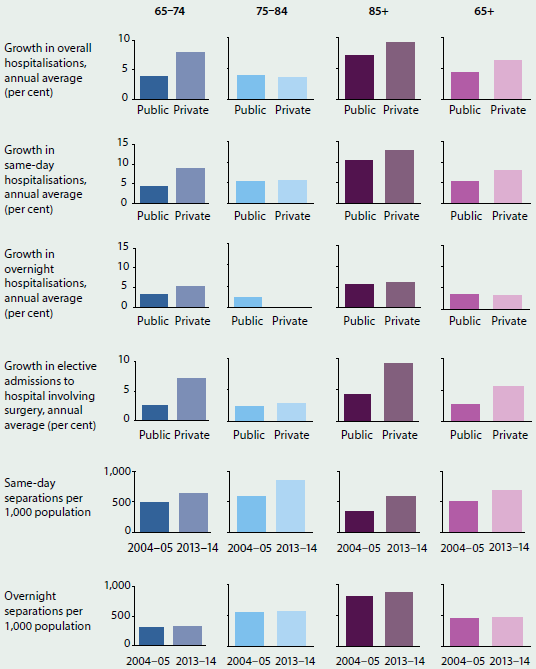
Source: AIHW NHMD.
The yearly increase in hospitalisations of people aged 65 and over in private hospitals was greater, at 6.3%, increasing from nearly 1 million hospitalisations in 2004-05 to 1.7 million in 2013-14. The increase was greatest for people aged 85 and over (9.1%) (Figure 6.17.7).
Patients admitted to hospitals can be discharged on the same day as admission, or go on to stay overnight. For Australians aged 65 and over, same-day and overnight hospitalisations increased, on average, by 6.6% and 3.4% a year, respectively, between 2004-05 and 2013-14. Same-day separations from private hospitals increased by 8.0% per year, compared with 5.3% for public hospitals.
The increases in hospitalisations in the 10 years to 2013-14 were only partly explained by an increased population of Australians aged 65 and over (Figure 6.17.7). Rates of same-day hospitalisations for older Australians increased over the 10 years for each age group, whereas overnight hospitalisation rates in all age groups were about the same in 2004-05 and 2013-14.
In 2004-05 and 2005-06 there were more female than male same-day hospitalisations, but from 2006-07 to 2013-14, there were more male than female same-day hospitalisations.
From 2004-05 to 2013-14 there were more female than male overnight hospitalisations for all Australians aged 65 and over. There were more male overnight hospitalisations for Australians aged 65-74 than female hospitalisations.
Most Australians aged 65 and over are discharged to their place of usual residence after their hospitalisation. However, hospitalisations for older Australians may also end with a transfer to residential aged care. Excluding people for whom residential aged care is already their usual place of residence, these transfers increased by 2.4% per year (and therefore at a lower rate than growth in hospitalisations overall for this age group), from 55,500 in 2004-05 to 68,700 in 2013-14. In 2004-05, 85% of these transfers were from public hospitals, increasing to 89% in 2013-14.
For Australians aged 65 and over, there was a slight increase (0.6% per year on average) in the number of deaths in hospital, from around 56,200 in 2004-05 to 59,200 in 2013-14. This compares with average annual growth in deaths of 1.4% from 2004 to 2013.
Between 2004-05 and 2013-14, the average length of stay in hospital for people aged 65 and over declined for both public hospitals (from 5.3 to 4.0 days) and private hospitals (from 3.6 to 2.8 days) (including same-day and overnight hospitalisations). The average length of stay for overnight separations for all Australians aged 65 and over also declined, from 9.4 to 7.3 days in public hospitals, and from 7.4 days to 6.6 days in private hospitals. The largest decline in the average length of stay was for those aged 85 and over in public hospitals, from 11.5 days in 2004-05 to 8.1 days in 2013-14.
Type of care received in hospital
For Australians aged 65 and over, acute care (medical, surgical and other) was the most common broad type of care provided in 2013-14, accounting for 92% of hospitalisations for this age group (65-74, 93%; 75-84, 91%; 85 and over, 86%) (Figure 6.17.8). After acute care, rehabilitation was the next most common form of hospital admitted patient care received by older Australians, especially for the 85-and-over group.
Figure 6.17.8: Hospitalisations for Australians aged 65 and over, by top five ranked broad types of care, 2013–14
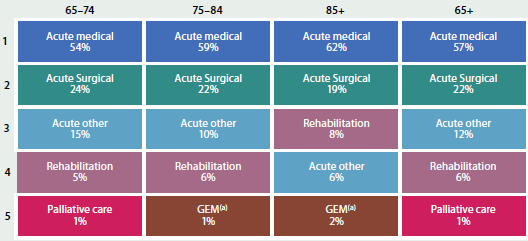
-
Geriatric evaluation and management.
Source: NHMD.
In 2013-14, the main reasons older Australians of each age group (65-74, 75-84 and 85 and over) experienced same-day hospitalisation were for procedures such as care involving dialysis; use of rehabilitation services; radiotherapy; chemotherapy; and palliative care (1.2 million of the total 2.3 million same-day hospitalisations).
Overnight hospitalisations presented a different pattern of care for Australians aged 65 and over in 2013-14. The main reason for hospitalisation of older Australians of each age group (65-74, 75-84 and 85 and over) was Diseases of the circulatory system, representing 14.7% (88,800 hospitalisations), 16.5% (96,700) and 16.6% (63,500) respectively. Injury, poisoning and certain other consequences of external causes represented an increasing proportion of care as older Australians' age increased: 8.0% (48,600) for those aged 65-74 years, 9.5% (55,600) for 75-84 years and 13.6% (52,000) for 85 and over.
Elective surgery
Elective hospitalisations for surgery among Australians aged 65 and over also increased between 2004-05 and 2013-14, by 4.6% per year on average (from 512,500 in 2004-05 to 768,500 in 2013-14), which was faster than the growth of this population (3.0%). Most of this increase occurred in private hospitals, growing on average by 5.6% per year (from 322,000 in 2004-05 to 527,600 in 2013-14). Elective surgery hospitalisations in public hospitals also increased, by 2.6% per year. All three age groups' rates of elective hospitalisation for surgery grew faster in private hospitals than in public hospitals (Figure 6.17.7). For both public and private hospitals, this growth was fastest for people aged 85 and over (9.3% for private hospitals, and 4.2% for public hospitals).
From 2004-05 to 2013-14, for Australians aged 65 and over, the average annual growth of male elective hospitalisations for surgery was 4.8% (from 254,500 in 2004-05 to 389,600 in 2013-14), while females grew at 4.4% (from 258,000 in 2004-05 to 378,800 in 2013-14). In particular, hospitalisations for males aged 85 and over grew at 8.5% per year, while those for females grew at 7.2% per year.
For Australians aged 65 and over, the three most common procedures in 2004-05 and 2013-14 were Cataract extraction, followed by Cystoscopy and Total knee replacement. This was also the pattern for the 65-74 and 75-84 age groups, although, for Australians aged 85 and over, the top three procedures were Cataract extraction, Cystoscopy, and then Total hip replacement.
Experience of hospitalisations
In 2012, the likelihood of being admitted to hospital in the last 12 months increased with age (Figure 6.17.9).
The hospital admission rates were similar across all remoteness areas for all people aged 65 and over. However, for Outer regional and Remote areas, people aged 75-84 were most likely to have been admitted to hospital in the last 12 months, and people aged 85 and older least likely.
A slightly higher proportion of men aged 65 and over had been admitted to hospital in the last 12 months (25%, compared with 22% of women). This was also the case within each age group: 21% of men aged 65-74 had been admitted to hospital (compared with 20% of women in the same age group), rising to 36% of men aged 85 and over (compared with 26% of women).
Figure 6.17.9: Experience of hospital admissions, people aged 65 and over, 2012
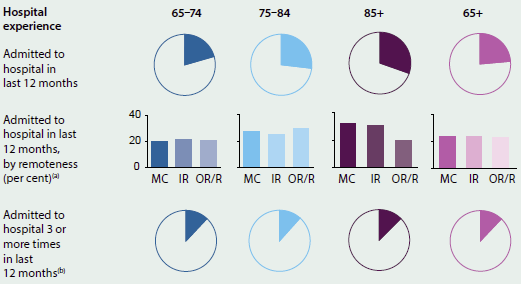
-
MC: Major cities; IR: Inner regional; OR/R: Outer regional and Remote.
-
Excludes people who were not admitted to hospital.
Source: AIHW analysis of 2012 ABS Survey of Disability, Ageing and Carers.
Specialist mental health services
Mental health care services can be delivered in a variety of settings, from hospitals and residential facilities to community-based care and general and specialist practice. The AIHW collates data on state and territory specialised community mental health and on state and territory specialised residential mental health services. Generally, people aged 65 and over use mental health-related services at a lower rate than the total population.
Overall, older Australians accounted for around 8.7% of community mental health service contacts in 2013-14, and these service contacts have increased by 4.3% per year on average since 2006-07. More than half of all older people's service contacts in 2013-14 were among people aged 65-74 (54%, or 412,000), with people aged 75-84 accounting for 33% (248,000 contacts) and people aged 85 and over 13% (99,000 contacts).
Between 2006-07 and 2013-14, the rate of community mental health care service contacts for people aged 65 and over increased by an average of 0.9% per year—to 224 per 1,000 population, compared with 374 per 1,000 for the total population. For men aged 65-74, the rate of service contacts increased by 2.7% per year, and by 1.0% for women. The rates changed less for people aged 75-84 (0.1% for men and 0.7% for women), and those for 85 and over increased 0.5% for men and declined 0.1% for women.
Residential mental health care services offer specialist mental health care on an overnight basis in a domestic-like environment. Australians aged 65 and over comprised a small proportion of all episodes of residential mental health care, representing 2.9% (201 episodes, or 5.9 per 100,000 population) in 2013-14, compared with 29.9 per 100,000 of the total population.
There were around 163,000 people aged 65 and over who received Medicare-subsidised mental health-related services in 2013-14, representing 8.7% of all people who received such services. On average, older people received 4.3 services across all provider types (psychiatrists, GPs, psychologists and other allied health professionals—note that people were counted only once in the total, but may have received a service from more than one provider type during the year), compared with 4.7 services for the total population.
In 2012-13, people aged 65 and over accounted for over 22,000 mental health-related ED occasions of service. This represented 11% of all mental health-related occasions, while overall, older people accounted for 20% of all ED occasions of service.
There were 1.1 million people aged 65 and over for whom a mental health-related prescription was dispensed in 2013-14, accounting for 29% of all people. Concerns have been expressed about the higher observed prescription rates of mental health-related medications for older Australians, particularly for antipsychotic medications, which may be being over-prescribed to control challenging behaviours (NPS MedicineWise 2013).
The effect of income levels on health care use
For Australians aged 65 and over, income generally decreases with age: according to the ABS 2013-14 Survey of Income and Housing, median gross weekly income declined by age for each age group from age 35-44 onwards (ABS 2015b).
Detailed analysis of health care use, by age group and income group, is hampered by the small numbers in the SDAC, particularly among people aged 85 and over. However, analysis for the broader group of people aged 65 and over showed that hospital and ED use decreased as household income levels increased, but the likelihood of visiting a medical specialist or dentist, or of consulting multiple health professionals for one condition, was higher among people living in higher-income households (Figure 6.17.10).
The proportion of people with private health insurance also decreased as age increased. Almost two-thirds (59%) of people aged 65-74 had private health insurance, compared with 51% of people aged 75-84, and 42% of people aged 85 and over.
Figure 6.17.10: Health care use by income quintile, people aged 65 and over, 2012
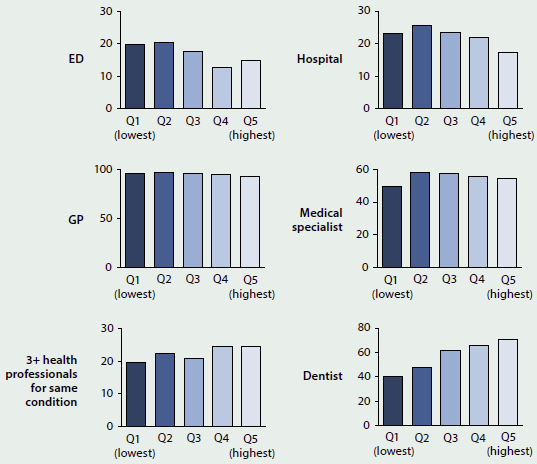
Source: AIHW analysis of 2012 ABS Survey of Disability, Ageing and Carers.
What is missing from the picture?
Most administrative data sources on health care use are based on individual episodes of care and are maintained separately, so it is not possible to identify multiple episodes for individuals in any data set, or across data sets. Linked data would enable patient pathways to be mapped on an individual level to understand how patients interact with the components of the health and aged care systems. This would provide more accurate information on the effectiveness and appropriateness of the care older Australians receive through the health and aged-care systems. In addition, it would allow diverse populations with specific characteristics to be examined in more depth—such as the health care use of people from non-English speaking backgrounds or people with particular health conditions.
Some research—even large-scale surveys such as the SDAC—excludes older people on certain grounds. Frail older people, older people with comorbid conditions, or older people not living in the community are frequently excluded. This limits the data available, and the extent to which the findings can be generalised.
Where do I go for more information?
Where appropriate, the AIHW's work reports on older age groups, highlighting age-related patterns in health care use. More information about older Australians is available at AIHW website Ageing. The report Older Australia at a glance (AIHW forthcoming) and other publications are available for free download.
Information about hospital use among Australians aged 65 and over is available at AIHW website Hospitals. The reports Australian hospital statistics 2013-14: emergency department care and Admitted patient care 2013-14: Australian hospital statistics are available for free download.
The report Mental Health Services—in brief 2014 provides an overview of mental health services delivered in Australia, and it is accompanied by a comprehensive online portal of information at Mental health services in Australia.
References
ABS (Australian Bureau of Statistics) 2013a. Disability, ageing and carers, Australia: summary of findings, 2012. ABS. cat. no. 4430.0. Canberra: ABS.
ABS 2013b. Population projections, Australia, 2012 (base) to 2101. ABS cat. no. 3222.0. Canberra: ABS.
ABS 2015a. Australian demographic statistics, Mar 2015: Table 59. Estimated resident population by single year of age, Australia. ABS cat. no. 3101.0. Canberra: ABS.
ABS 2015b. Household income and wealth, Australia, 2013-14. ABS cat. no. 6523.0. Canberra: ABS.
ABS 2015c. National Health Survey: first results, 2014-15. ABS cat. no. 4364.0.55.001. Canberra: ABS.
AIHW (Australian Institute of Health and Welfare) 2014. Australian hospital statistics 2013-14: emergency department care. Health services series no. 58. Cat. no. HSE 153. Canberra: AIHW.
AIHW 2015a. Admitted patient care 2013-14: Australian hospital statistics. Health services series no. 60. Cat. no. HSE 156. Canberra: AIHW.
AIHW 2015b. Mental health: information sources. Canberra: AIHW.
AIHW 2015c. Use of aged care services before death. Data linkage series no. 19. Cat. no. CSI 121. Canberra: AIHW.
AIHW, forthcoming. Older Australia at a glance (fourth edition)—Use of health and aged care services. Cat. no. AGE 52. Canberra: AIHW.
DHS (Department of Human Services) 2015. Medicare statistics. Canberra: DHS.
NPS MedicineWise 2013. Antipsychotic overuse in dementia—is there a problem? Strawberry Hills, NSW: NPS MedicineWise.
Treasury 2015. Intergenerational report: Australia in 2055. Canberra: Treasury.
6.18 End-of-life care
The inevitable human experience of dying has changed substantially in Australia over the last century. In the early 1900s, dying at home was common. While advances in medical interventions throughout the 20th century have substantially contributed to increased life expectancy for all Australians, these interventions have also had an impact on the dying experience, shifting a large proportion of end-of-life care into institutions such as hospitals and residential aged care facilities. Whether this institutional approach to dying can deliver what people want at the end of their life is a conversation gaining importance in Australia.
Emeritus Professor Ian Maddocks, Senior Australian of the Year 2013 and eminent palliative care specialist, has observed that 'Sometimes I think it's better to step back and say you don't need all that procedural stuff, what you need is good care now. You are going to die. Let's do it well.' This concept of 'dying well' (Jones et al. 2013)—that is, that the end-of-life care experience is positive and meets the needs and expectations of the person dying and of their loved ones—is the focus of this feature article.
The terms 'end-of-life care' and 'palliative care' tend to be used interchangeably. However, they are different concepts. The Australian Commission on Safety and Quality in Health Care (the ACSQHC) recently released a national consensus statement titled Essential elements for safe and high-quality end-of-life care (ACSQHC 2015), which defines the broader end-of-life care and palliative care concepts (Box 6.18.1). Importantly, end-of-life care typically refers to the 12 months prior to death, in contrast to palliative care which is typically care specifically tailored to assist with the effects of life-limiting illnesses. The ACSQHC makes note of two different components of the end-of-life definition: likely to die in the next 12 months (involving periods of exacerbated illness that may be reversible); and likely to die in the short term (within days to weeks), where clinical deterioration is likely to be irreversible. In contrast, palliative care may not be limited to the last 12 months of life—the need for palliative care may be episodic over an extended period, depending on the illness.
Both end-of-life care and palliative care have been the subject of a number of state and territory and Australian government consultations and inquiries in recent years. The most recent of these consultations occurred in 2015, when the Victorian Parliament's Legal and Social Issues Committee invited Victorians to have their say on end-of-life care and the services that they want to support them at their end of life (Parliament of Victoria 2015).
Box 6.18.1: Definitions of end-of-life care and palliative care
End-of-life care: includes physical, spiritual and psychosocial assessment, care and treatment delivered by health professionals and ancillary staff. It also includes the support of families and carers, and care of the patient's body after their death. People are 'approaching the end of life' when they are likely to die within the next 12 months. This includes people whose death is imminent (expected within a few hours or days) and those with:
- advanced, progressive, incurable conditions
- general frailty and co-existing conditions that mean that they are expected to die within 12 months
- existing conditions, if they are at risk of dying from a sudden acute crisis in their condition
- life-threatening acute conditions caused by sudden catastrophic events.
Palliative care: an approach to treatment that improves the quality of life of patients and their families facing life-limiting illness, through the prevention and relief of suffering. It involves early identification and impeccable assessment and treatment of pain and other problems (physical, psychosocial and spiritual).
Source: ACSQHC 2015.
The need for appropriate end-of-life care and palliative care is important given that Australia's population is both growing and ageing. The proportion of the population aged 65 and over is forecast to increase from 12% (2.1 million people) in 1996 (ABS 1998) to around 15% (or 3.7 million people) in 2016 (ABS 2015a). By 2031, the proportion of people aged over 65 is forecast to be around 19% (or 5.7 million), and could be as high as 25% (between 9 and 12 million) by 2066 (ABS 2013). The vast majority of Australians who died in 2013 were people aged 65 and older (81%, or 119,000 people), with a further 8.9% and 4.6% aged 55-64 and 45-54 respectively (ABS 2014). Therefore, the number of people who will die each year will rise substantially over the next 50 years, and more people will die due to chronic progressive diseases, increasing the need for an end-of-life care system that meets the needs and expectations of individuals and their families.
Pathways to death
Death can either be caused by sudden, unexpected events or be the result of longer term chronic health conditions. Sudden death events include accidents, infections, assault, anaphylactic shock, poisoning, suicide and unintended adverse consequences or mishaps from medical interventions. Ischaemic heart disease was the leading underlying cause of death in Australia in 2013, followed by Dementia and Alzheimer disease, and Cerebrovascular diseases (which includes stroke) (ABS 2015b). Trachea, bronchus and lung cancer and Chronic lower respiratory diseases made up the other top five leading underlying causes of death in Australia in 2013. While it is important to recognise that these sudden, unexpected circumstances are a type of pathway to death, end-of-life discussions are commonly associated with Australians experiencing a chronic and progressive decline in health and function associated with older age.
End-of-life experiences that involve chronic conditions and deterioration of body and/or cognitive function are unique to each individual, but typically follow three broad patterns, often characterised by the type of illness or condition encountered at the end of life (Table 6.18.1).
| Pattern of illness leading to death | Image pattern | Functional capacity | Time period |
|---|---|---|---|
| Short period of evident decline (e.g. Cancer). | 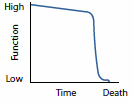 |
Body function declines rapidly and shows no sign of recovery. | Relatively short time period between onset of functional decline and death. |
| Long-term limitations with intermittent serious episodes (e.g. heart and lung failure). | 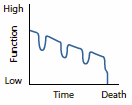 |
Body function slowly declines with intermittent sudden decline but some recovery after each episode. | Longer time period between onset of condition and death. |
| Prolonged decline (e.g. frailty and dementia). | 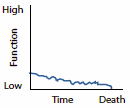 |
Body function low with further decline progressing slowly over time. | Longest time period of all chronic conditions. |
Source: Adapted from Lynne et al. 2003.
The pathway or trajectory that defines a person's end of life is integral to understanding the concept of 'dying well. For example, those experiencing a sudden death will have a vastly different end-of-life care experience to a person who gradually approaches old age and eventually dies from a chronic illness. The resultant diversity in individual needs and expectations poses challenges for the design of efficient and effective health and welfare services that deliver quality end-of-life care.
End-of-life care services in Australia
Australia's health system is well regarded internationally, ranking fourth overall behind the United Kingdom, Switzerland and Sweden in a recent Commonwealth Fund comparison (Davis et al. 2014). A recent international study ranked quality of death for Australians second out of 80 comparison countries, judged across a range of palliative care measures, including palliative care and health care environment; human resources; affordability; quality of care; and community engagement (The Economist 2015). However, there is also a perception that Australian end-of-life care services are fragmented and difficult to navigate for patients, their carers and families during an end-of-life journey that can be emotionally confronting and stressful (ACSQHC 2015).
Australian end-of-life care services are delivered across various government portfolios at both the federal and state and territory levels, with a range of government-subsidised and regulated services provided to people as they near their end of life. While many services are directly funded by the Australian Government, such as aged-care and Medicare-subsidised services, states and territories all have different approaches to planning, investment and delivery of their publicly funded services, employ different local service delivery practices, and therefore have differently structured health care systems. The private and not-for-profit sectors are engaged differently in each state and territory to provide a range of health-related services. States and territories also have varying demographic and geographical remoteness profiles and, consequently, varying demands for particular types of services.
End-of-life care is provided in many health care settings in Australia, including neonatal units, paediatric services, public and private acute hospitals, general practices, and residential and community aged care services. Support services are also delivered to people in their own homes. Services targeted towards older Australians provide the majority of end-of-life care, and tend to be the focus of discussion about system-wide improvements; however, around 20% of deaths each year are for people aged under 65. Depending on the illness trajectory, this 20% may require acute medical care (for example, admitted patient care in hospital care, which adds the full spectrum of health services to the end-of-life care discussion). Specialist palliative care services, a component of end-of-life care services, also operate from a variety of settings, including specialist admitted patient consulting services; specialist admitted patient settings; hospices; and community-based specialist services.
A range of health professionals, other workers, carers and volunteers provide end-of-life and palliative care services. These include:
- nurses, both registered and non-registered, with and without specialised palliative care qualifications
- medical practitioners, including specialist palliative care physicians, hospital-based specialist palliative care trainees, other medical specialists, hospital-based non-specialists and general practitioners
- other health professionals, including psychologists, physiotherapists, occupational therapists, pharmacists
- social workers, spiritual and pastoral carers
- other occupations, including personal care assistants, chaplains, massage therapists and music therapists
- informal carers (such as relatives, friends and neighbours who provide care on an unpaid basis)
- volunteers.
End-of-life care service activity in Australia
The end-of-life experience for Australians has become increasingly institutionalised over the last century, with only around 20% of Australians dying outside of hospital or residential aged care in the first decade of the 21st century (Broad et al. 2013)—one of the lowest rates in the developed world. While the majority of Australians report that they want to die at home if faced with a terminal illness (Foreman et al. 2006), the reality when the time comes can be vastly different. As Australians approach the end of their lives, they often confirm where they want to die, or sometimes make a change to their preferred place of death. However, even when a person has made their preferred place to die known to others, only around half of people have their preferences met. Similar results have been found across the developed world (Aoun et al. 2013; Burge et al. 2015; Hunt et al. 2014).
Information about where Australians die, their preferred place of death and the end-of-life support they received is fragmented, because data are not standardised or collated into a single source. Rather, information is typically collected and published according to the service individuals were receiving at their time of death, with variation among the way service types record this information. While an overall picture of the type, amount, and quality of end-of-life care Australians receive is not currently possible, nonetheless, data are available to describe the broad characteristics of end-of-life care at the time of death across Australia.
Aged care services
For permanent residents of aged care facilities, the most common reason for separation from the facility for their last care episode was due to death, accounting for around 95%, or 54,000 people, in 2013-14 (AIHW 2015c). Less than half of these people had stayed for less than 12 months in the residential care facility. Around 15% of deaths in residential aged care facilities involved patients who were accessing palliative care services in 2013-14 (AIHW 2015b). While data are available on the proportion of services meeting national standards, there are no national level data on the quality of patient-assessed end-of-life care across the aged care service sector.
Admitted patient care
There were over 60,000 public hospital separations that ended in the death of the patient and an additional 13,000 in private hospitals in 2013-14 (AIHW 2015a). This equates to around half of all deaths in Australia occurring in hospitals, with rates relatively unchanged over the last decade (AIHW 2014). While there are detailed data regarding hospital stays in the last year of life (for example, O'Connell et al. 2014), little is known about the patient's perspective of their end-of-life care experience.
Palliative care services
Hospital separations with a palliative care component (about 57,000 separations) account for less than 0.6% of all hospital separations. However, they make up nearly one-third (32%) of all deaths in hospitals (AIHW 2015a). General practitioners provided an estimated 140,000 palliative care-related services in 2012-13, with an additional 63,000 MBS-subsidised services provided by palliative medicine specialists (AIHW 2014).
Cost of end-of-life care
As previously noted, end-of-life care services are provided by all levels of government and cross a number of government portfolios. The national costs of hospital and residential aged care services in the last year of life have been estimated to be in the order of $2.4 billion and $2.3 billion respectively, substantially higher than the estimated $77 million spent on community-based care (Swerissen et al. 2014). Observations about the cost of palliative care services have a similar theme, with estimates of around $7,700 per episode of subacute hospital care compared with $2,500 for community-based care (SCARC 2012).
As with other aspects of the end-of-life care discussion, data on the cost-benefit of providing home- or community-based care are mixed and difficult to interpret. It is known that hospital admissions increase in the last year of life, with an average of nearly eight admissions per person, for an average total of 44 care days, in the final year of life (Rosenwax et al. 2011). Silver Chain, a large Western Australian-based not-for-profit organisation operating in four states, provides some evidence that a well-coordinated community-based palliative care program has the potential to reduce emergency department presentations and hospital use in the last year of life, and increase the rate of dying out of hospital, thereby reducing the cost of hospital-based care and therefore overall palliative care costs (Silver Chain 2015) (see Box 6.18.2).
Unless the observed pattern of primarily dying in hospitals and residential aged-care facilities changes, there will be a substantial rise in the cost of providing end-of-life care to Australians over the next 25 years, simply due to the increasing number of people dying.
Box 6.18.2: Silver Chain—Hospice Care Services
Silver Chain provides community-based Hospice Care Services (HCS), supporting people and families with complex needs to remain at home. As a part of the broader palliative care network of services, Silver Chain works closely with hospital palliative care teams and in-patient palliative care units to meet the unique individual needs and preferences of people with terminal illnesses. Care addresses physical symptoms, psychosocial and spiritual concerns through mixed palliative care teams consisting of nurses, doctors, care aides, social workers, counsellors and chaplains. The care provided is adaptable to the changing needs of the individual and their families/carers and is available 24 hours a day, seven days a week.
Silver Chain has evaluated the impact of their HCS in a 'whole of population' study using person-level linked data comprising those dying of cancer between 2001 and 2011 in Perth, Western Australia. More than half of all cancer patients who died (58%) had used HCS at some stage. The main outcomes of this work to date include:
- Reduced hospital-based care. HCS recipients had, on average, 8.0% fewer emergency department presentations and spent 5 days less in hospital over the last year of life, compared with those who did not access the service. The total effect of the service was a reduction of approximately 90,900 bed days over the 10-year period.
- Increased likelihood of a person dying out of hospital. HCS recipients were three times more likely to die out of hospital, compared with those who did not access the service. Cancer patients aged under 50 years are eight times more likely to die out of hospital. Having a partner also increased the likelihood of death out of hospital by around four times.
- Factors associated with increased likelihood of accessing the service were lower socioeconomic status, being born outside of Australia/New Zealand, being female, younger age, having a partner, and increasing time living with cancer.
Source: Silver Chain unpublished.
Improving end-of-life care—'dying well'
Gregory and Armstrong (2013) observe that, despite medical advances, mortality is 100%, and argue that a 'good death' is an important health outcome. However, exactly what constitutes a 'good death' or 'dying well' is open to conjecture. A 2015 Victorian Government consultation 'Greater say for Victorians: improving end-of-life care' generated a diverse range of views. A recent United Kingdom end-of-life care consultation generated a similar diversity of views which were distilled into seven main themes that mirrored the recent Victorian experience—see Figure 6.18.1.
Figure 6.18.1: Person-centred view of their choice of end-of-life care
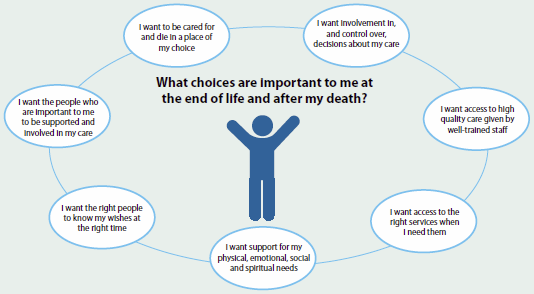
Source: The Choice in End-of-life Care Programme Board 2015.
Swerissen and Duckett (2014) suggest that four changes to the Australian end-of-life care setting would facilitate a 'good death' for more Australians:
- More public discussion about the limits of health care as death approaches, and what Australians want for the end of life.
- Increased planning of individual end-of-life choices to support improved compliance with choices.
- Increased compliance with an individual's expressed choices.
- Reorientation of services providing end-of-life care so that they focus more on people's wishes to die at home and in homelike settings, rather than in institutions.
Notwithstanding the diversity of opinion about what constitutes a 'good death, it is apparent that Australians expect that end-of-life care services should be high quality and meet the needs of the individual and their carers, as advocated by the ACSQHC's national consensus statement (ACSQHC 2015). However, the term 'quality' can be subjective, and can mean different things depending on a person's individual circumstances. For example, 'quality' for a person nearing the end of their life may mean comfort and wellbeing, which may be in contrast to 'quality' of a service which might include aspects such as safety and preventing harm.
Planning for death: Advanced Care Plans
A lack of planning for, and talking about, death is considered to be a substantial barrier to quality end-of-life experiences. Trankle (2014:3) quotes an Australian intensive care specialist as saying:
...a good death...it shouldn't come as a surprise to everyone, that there's actually been some time...just to recognise that, the patient's life is ending, and so there's a plan in place; people know what they're doing and what they're treating.
Faced with illness and possible death, patients, clinicians and loved ones are forced to make decisions under adverse conditions—for example, making choices about medical interventions under stress due to the progression of a long-term illness along an unexpected path. Making choices under such circumstances can impact on the quality of the end-of-life experience.
There are circumstances where individuals and family members may not consider medical interventions aimed at prolonging life to be appropriate for the needs and wishes of the individual. An Advanced Care Plan (ACP) or Advanced Care Directive (ACD) provides a way to document personal expectations about medical intervention well in advance of any critical medical incident.
ACPs or ACDs need not only be made when illnesses begin to impact on a person's life. All Australians are able to develop plans that guide decisions about their care should the need arise. While ACPs/ACDs provide the basis for an individual's wishes to be met, there is evidence that sometimes plans are not followed (Rhee et al. 2012). This can occur for a number of reasons: for example, the presence of an ACP/ACD may not be known to medical staff, or the plan may provide insufficient detail to guide clinical decision making. Evidence on the reasons plans are not followed in Australia is very limited.
While all states and territories in Australia have regulatory and legislative frameworks to support the use of ACDs/ACPs, their use remains relatively low, with an estimated 14% of Australians having an ACP (White et al. 2014). Improvement in the use of ACPs/ACDs would imply that Australians are planning and talking about their individual needs and wishes prior to when the time arises, which may improve the end-of-life journey.
Patient outcome measures—asking patients and their carers about services
Measures of patient experience of care, based on asking patients about their views on their level of care, are difficult to implement and administer, especially when the care provided can span a broad range of health and welfare service providers. Evidence regarding cancer patients suggests that data from patient-centred outcome measures (PCOMs) provide information on unmet need and may improve service providers understanding of patients' needs (Etkind et al. 2015).
Work is ongoing to develop outcome measures specific to end-of-life issues, for example, the End-of-life Patient-reported Outcome Measure, which assesses whether a patient has finalised their affairs at the end of life (McCaffrey et al. 2014). However, at present, standardised PCOMs tend to be highly specialised (for example, the recent publication of an international standardised measure for advanced prostate cancer) (Morgans et al. 2015).
Patient outcome measures are used by some Australian end-of-life care services, primarily palliative care services. At the national level, the Palliative Care Outcomes Collaboration (PCOC), established in 2005, uses a range of measures, collected from 106 Australian specialist palliative care service providers, to assess patient outcomes, including how long it takes for people to access palliative care, the amount of time a patient is in an unstable phase, and changes in pain experienced by patients. The most recent data (AIHW 2014) indicate that:
- The majority of patients (94%) requiring palliative care services started their episode of palliative care on the day of, or the day following, the day that they were ready for care.
- One-fifth (20%) of palliative care patient episodes involved an unstable phase of more than 3 days—that is, when a change in the plan of care or emergency treatment was required due to a new problem; there was a sudden deterioration of an existing condition; or a sudden change in family/carer circumstances had an impact on care.
- Pain management is meeting most benchmarks for the majority of patient episodes.
It is also important to understand the end-of-life journey from the perspective of carers of people who are dying. Research indicates that around half of caregivers report an experience of caregiving that was worse, or much worse, than expected (Burns et al. 2015). The reasons for this are unclear—however, there is evidence suggesting that the realities of caring 24 hours a day for a loved one who is dying can be vastly different to the imagined scenario (SCARC 2012).
Service integration
Given the wide range of services providing end-of-life care, service fragmentation has been acknowledged as a major barrier to achieving quality outcomes for those at their end of life (SCARC 2012). Trankle 2014 comments that the 'intensive care unit can be an inappropriate place to die and education and planning to allow death to occur elsewhere is crucial. Person-centred, integrated services that enable effective communication between the services about a person's changing needs are paramount to ensuring overall effectiveness of end-of-life care (ACSQHC 2015). The service integration challenge is not unique to end-of-life care, but there are examples of successfully integrated models of care which could guide reform.
Palliative care service integration has made inroads into integration of care. The Victorian Palliative Care Resource Allocation Model acknowledges the importance of integrated care to ensure people at the end of their life receive integrated care that responds in a timely manner to an individual's changing needs (Department of Health 2011). Medicare-subsidised palliative medicine specialist services for case conferencing activities made up 7.9% of all services in 2012-13 (AIHW 2014), an increase from 6.1% in 2010-11 (AIHW 2012). However, there is no additional qualitative information about the utility or effectiveness of case conferencing. Also, system-wide approaches to care coordination must be based on strong evidence that the investment in coordination is of clear benefit to the patient (Yates 2015).
What is the AIHW doing?
The AIHW will continue its discussions with Australian, state and territory governments and other state and territory stakeholders to expand the range of available national end-of-life and palliative care information, including filling data gaps in relation to the end-of-life care experience as a whole.
What is missing from the picture?
Current data sources do not allow for reporting on a range of aspects of end-of-life and palliative care. For example, we do not have access to data to allow reporting on topics including palliative care-related expenditure; community-based palliative care services; MBS-subsidised services provided by general practitioners and non-palliative care medical specialists; and the number of palliative care beds in hospitals, both acute and subacute. This makes it difficult to provide a comprehensive overview of end-of-life and palliative care service provision in Australia.
It is apparent, from recent consultation activities, that end-of-life care remains a community concern. A number of themes about how the end of life could be improved for all Australians and better meet contemporary community expectations, are evident:
- Encouraging all Australians to have conversations about and plan for death.
- Providing timely advice about availability of end-of-life and palliative care services and carer respite.
- Facilitating Australian's ability to 'die in place' rather than in hospital.
- Better integration of end-of-life services between various components of the health sector, including potentially enhancing the role of primary care services in managing end-of-life care.
- Providing appropriate training and support for the end-of-life and palliative care workforce.
- Greater utilisation of ACP/ACD.
- Greater understanding of access to end-of-life care provision, including understanding barriers to accessing end-of-life care (Parliament of Victoria 2015).
A clear message from this is the need for 'consistent' data collection to better inform the community and enable decision-makers at all levels to monitor whether end-of-life care being provided to Australians is high quality and meeting their needs. The PCOC data illustrate that measurement of patient experiences can be achieved and can provide a valuable feedback mechanism to drive service level improvement (Currow et al. 2015). The publication and implementation of version 2 of the National Safety and Quality Health Service Standards is imminent, and includes standards for patients regardless of where they receive care—that is, whether they receive institution-based or home-based care.
A wide-ranging, standardised experience of end-of-life care measure for patients and carers, applicable to all death trajectories would also provide insight into whether services are supporting an experience of 'dying well, and how Australians feel about their end-of-life care.
References
ABS (Australian Bureau of Statistics) 1998. Census of Population and Housing: population growth and distribution, Australia 1996. ABS cat. no. 2035.0. Canberra: ABS.
ABS 2013. Population projections, Australia, 2012 (base) to 2101. ABS cat. no. 3222.0. Canberra: ABS.
ABS 2014. Deaths, Australia, 2013. ABS cat. no. 3302.0. Canberra: ABS.
ABS 2015a. Australian demographic statistics, Mar 2015: Table 59. Estimated resident population by single year of age, Australia. ABS cat. no. 3101.0. Canberra: ABS.
ABS 2015b. Causes of death, Australia, 2013. ABS cat. no. 3303.0. Canberra: ABS.
ACSQHC (Australian Commission on Safety and Quality in Health Care) 2015. National Consensus Statement: essential elements for safe and high-quality end-of-life care. Sydney: ACSQHC.
AIHW (Australian Institute of Health and Welfare) 2012. Palliative care services in Australia 2012. Cat. no. HWI 120. Canberra: AIHW.
AIHW 2014. Palliative care services in Australia 2014. Cat. no. HWI 128. Canberra: AIHW.
AIHW 2015a. Admitted patient care 2013-14: Australian hospital statistics. Health services series no. 60. Cat. no. HSE 156. Canberra: AIHW.
AIHW 2015b. AIHW National Aged Care Data Clearinghouse. Unpublished data. Canberra: AIHW.
AIHW 2015c. Residential aged care and home care 2013-14. Canberra: AIHW.
Aoun SM & Skett K 2013. A longitudinal study of end-of-life preferences of terminally-ill people who live alone. Health and Social Care in the Community 21(5):503-35.
Broad JB, Gott M, Kim H, Boyd M, Chen H & Connolly MJ 2013. Where do people die? An international comparison of the percentage of deaths occurring in hospital and residential aged care setting in 45 populations, using published and available statistics. International Journal of Public Health 58(2):257-67.
Burge F, Lawson B, Johnston G, Asada Y, McIntyre PF & Flowerdew G 2015. Preferred and actual location of death: What factors enable a preferred home death? Journal of Palliative Medicine 18(12):1054-59.
Burns EJ, Quinn SJ, Abernethy AP & Currow DC 2015. Caregiver expectations: predictors of a worse than expected caregiving experience at the end of life. Journal of Pain and Symptom Management 50(4):453-61.
Currow DC, Allingham S, Yates P, Johnson C, Clark K & Eagar K 2015. Improving national hospice/ palliative care services symptom outcomes systematically through point-of-care data collection, structured feedback and benchmarking. Supportive Care in Cancer 23(2):307-15.
Davis K, Stremikis K, Squires D, Schoen C. 2014. Mirror, mirror on the wall: how the performance of the U.S. health care system compares internationally. New York: The Commonwealth Fund.
Department of Health 2011. Strengthening palliative care: policy and strategic directions 2011-2015. Melbourne: Victorian Government.
Etkind SN, Daveson BA, Kwok W, Witt J, Bausewein C, Higginson IJ et al. 2015. Capture, transfer, and feedback of patient-centered outcomes data in palliative care populations: does it make a difference? A systematic review. Journal of Pain and Symptom Management 49(3):611-24.
Foreman LM, Hunt RW, Luke CG & Roder DM 2006. Factors predictive of preferred place of death in the general population of South Australia. Palliative Medicine 20(4):447-53.
Gregory A & Armstrong R 2013. Ann Gregory and Ruth Armstrong: Search for a good death. MJA InSight Monday, 4 March 2013.
Hunt KJ, Shlomo N & Addington-Hall J 2014. End-of-life care and achieving preferences for place of death in England: results of a population-based survey using the VOICES-SF questionnaire. Palliative Medicine 28(5):412-21.
Jones G & Marszalek J 2013. Ita Buttrose names Australian of the Year. Sydney: NSW: The Australian.
Lynne J & Adamson D 2003. Living well at the end of life: adapting health care to serious chronic illness in old age. Santa Monica: Rand Corporation.
McCaffrey N, Skuza P, Breaden K, Eckermann S, Hardy J, Oaten S et al. 2014. Preliminary development and validation of a new end-of-life patient-reported outcome measure assessing the ability of patients to finalise their affairs at the end of life. PLoS ONE 9(4):e94316.
Morgans AK, van Bommel AC, Stowell C, Abrahm JL, Basch E, Bekelman JE et al. 2015. Development of a standardized set of patient-centered outcomes for advanced prostate cancer: an international effort for a unified approach. European Urology 68(5):891-98.
O'Connell DL, Goldsbury DE, Davidson P, Girgis A, Phillips JL, Piza M et al. 2014. Acute hospital-based services utilisation during the last year of life in New South Wales, Australia: methods for a population-based study. British Medical Journal Open 4(3).
Parliament of Victoria 2015. Melbourne: Parliament of Victoria. Terms of reference.
Rosenwax LK, McNamara BA, Murray K, McCabe RJ, Aoun SM & Currow DC 2011. Hospital and emergency department use in the last year of life: a baseline for future modifications to end-of-life care. Medical Journal of Australia 194 (11): 570-73.
Rhee JJ, Zwar NA & Kemp LA 2012. Uptake and implementation of advance care planning in Australia: findings of key informant interviews. Australian Health Review 36(1):98-104.
SCARC (Senate Community Affairs References Committee) 2012. Palliative care in Australia. Report to the Senate, Australian Government. Canberra: Senate Community Affairs References Committee.
Silver Chain 2015. Determinants of hospital and SCG resource use amongst WA cancer patients, and how that has changed over time. Perth: Silver Chain.
Swerissen H, Duckett S 2014. Dying well. Carlton: Grattan Institute.
The Choice in End of Life Care Programme Board 2015. What's important to me. A Review of Choice in End of Life Care.
The Economist (The Economist Intelligence Unit Limited) 2015. The 2015 quality of death index: Ranking palliative care across the world (PDF). The Economist.
Trankle SA 2014. Is a good death possible in Australian critical and acute settings?: physician experiences with end-of-life care. BMC Palliative Care 13:41.
White B, Tilse C, Wilson J, Rosenman L, Strub T, Feeney R et al. 2014. Prevalence and predictors of advance directives in Australia. Internal Medicine Journal 44(10):975-80.
Yates P 2015. What can we do to improve the coordination of care for cancer patients? Cancer Nursing 38(3):248-49.