Australian and state and territory governments provide various types of assistance to people having difficulty with finding or sustaining affordable and appropriate housing in the private housing market. Housing assistance refers to both access to social housing (such as public housing), and targeted financial assistance to eligible Australians.
Social housing provides eligible households with rents set below market rates (based on a percentage of a tenant’s income). Forms of social housing include:
- public housing
- state owned and managed Indigenous housing
- community housing
- Indigenous community housing.
Governments also provide various forms of financial support to assist people on lower incomes to meet housing costs. Forms of financial support include:
- Commonwealth Rent Assistance
- Private Rent Assistance
- Home Purchase Assistance.
The data visualisation displays a summary of key data from the AIHW National Housing Assistance Data Repository and Australian Government Housing Dataset. Data presented are available in the individual sections of this report and in the data download section.
Key messages
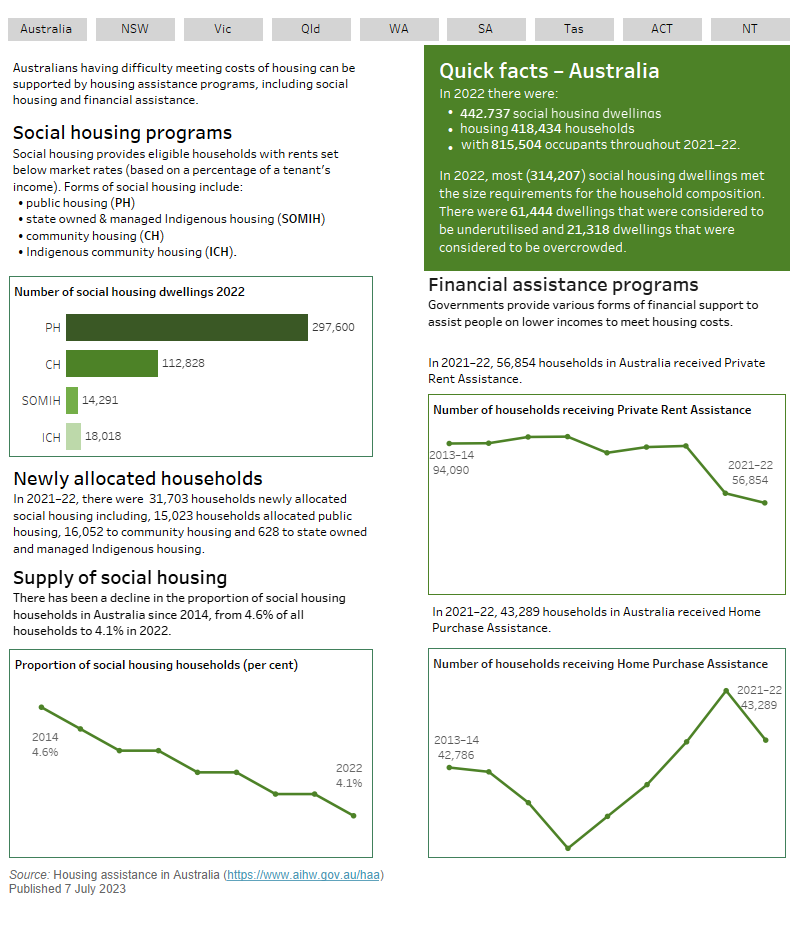
- At June 2022, there were around 442,700 social housing dwellings. For more see Social housing dwellings
- In 2021–22, there were 31,703 households newly allocated social housing, including 15,023 households allocated public housing, 16,052 to community housing and 628 to state owned and managed Indigenous housing. For more see Entries, exits and transfers.
- The proportion of social housing households in Australia fell from 4.6% in 2014 to 4.1% in 2022. For more detail see Households and waiting lists.
- In 2021–22, 56,854 households in Australia received Private Rent Assistance and 43,289 households received Home Purchase Assistance. For more see Financial assistance.
- At June 2022, over 1.3 million income units were receiving Commonwealth Rent Assistance (CRA). For more see Financial assistance.