Primary and secondary schooling
Web article
Release Date:
Section: Education and skills
Citation
AIHW
Australian Institute of Health and Welfare (2023) Primary and secondary schooling, AIHW, Australian Government, accessed 20 April 2024.
APA
Australian Institute of Health and Welfare. (2023). Primary and secondary schooling. Retrieved from https://www.aihw.gov.au/reports/australias-welfare/primary-and-secondary-schooling
MLA
Primary and secondary schooling. Australian Institute of Health and Welfare, 07 September 2023, https://www.aihw.gov.au/reports/australias-welfare/primary-and-secondary-schooling
Vancouver
Australian Institute of Health and Welfare. Primary and secondary schooling [Internet]. Canberra: Australian Institute of Health and Welfare, 2023 [cited 2024 Apr. 20]. Available from: https://www.aihw.gov.au/reports/australias-welfare/primary-and-secondary-schooling
Harvard
Australian Institute of Health and Welfare (AIHW) 2023, Primary and secondary schooling, viewed 20 April 2024, https://www.aihw.gov.au/reports/australias-welfare/primary-and-secondary-schooling

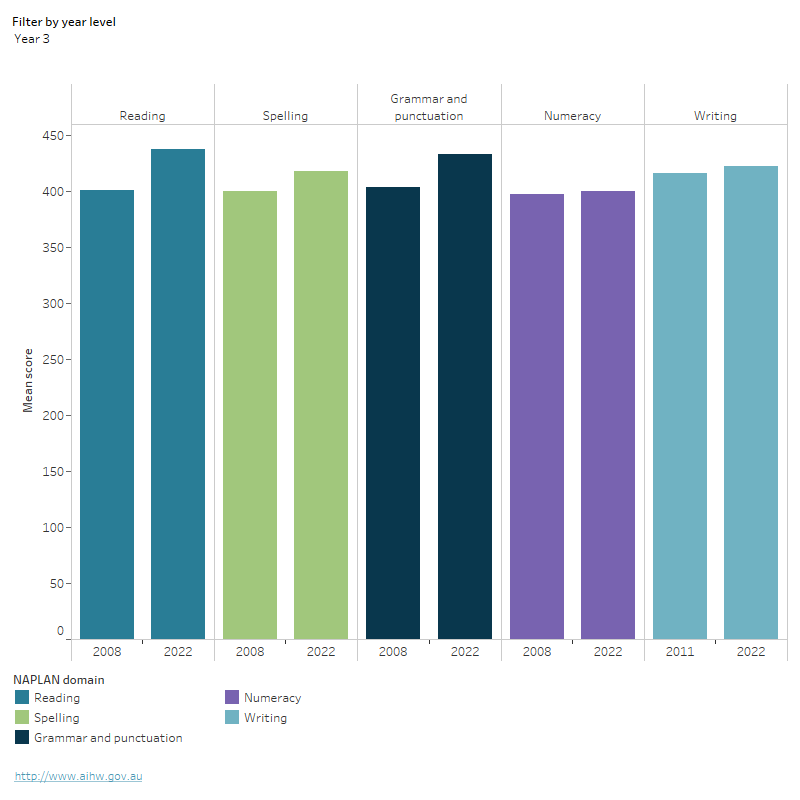
National mean scores across NAPLAN domains by year level, 2008, 2011 and 2022
This graph shows national mean scores on the NAPLAN domain by year level in 2008, 2011 and 2022. There was a statistically significant increase in mean score for year 3 reading, spelling and grammar & punctuation and year 5 reading, spelling and numeracy in 2022 compared to 2008. Average achievement in all other domains was close to or not statistically different from 2008 results (or 2011 results for writing).
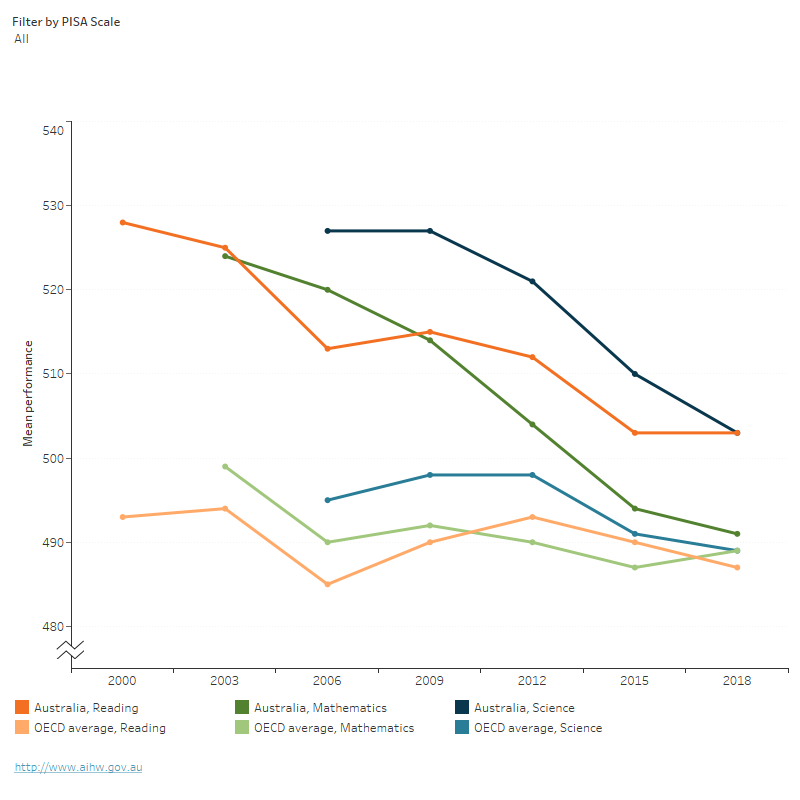
Mean performance on the PISA, Australia and the OECD, 2000 to 2018
This line graph shows the mean performance on the PISA scales, comparing Australia with all OECD countries. Mean performance on the reading literacy scale fluctuated, with an overall decline in Australia (2000: 528, 2018: 503), and as an average of OECD countries (2000: 500, 2018: 487). Mean performance on the Mathematical literacy scale declined in Australia (2000: 533, 2018: 491) and an average of OECD countries (2000: 500, 2018: 489).
Mean performance on the Scientific literacy scale fluctuated, with an overall decline in Australia (2000: 528, 2018: 503) and as an average of OECD countries (2000: 500, 2018: 489).
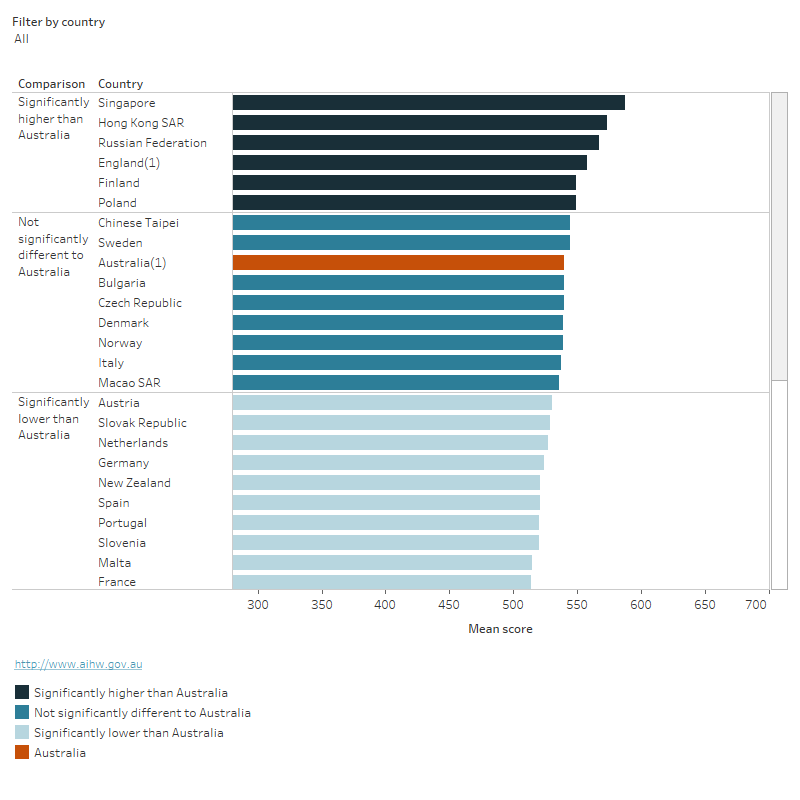
Comparison of mean scores on the PIRLS reading literacy assessment, 2021
This horizontal bar chart shows the mean scores on the PIRLS reading literacy assessment across 43 countries. Australia has a mean score of 540. Australia’s mean score was significantly lower than 6 countries and similar to 8 countries. The scores ranged from 288 in South Africa to 567 in Singapore.
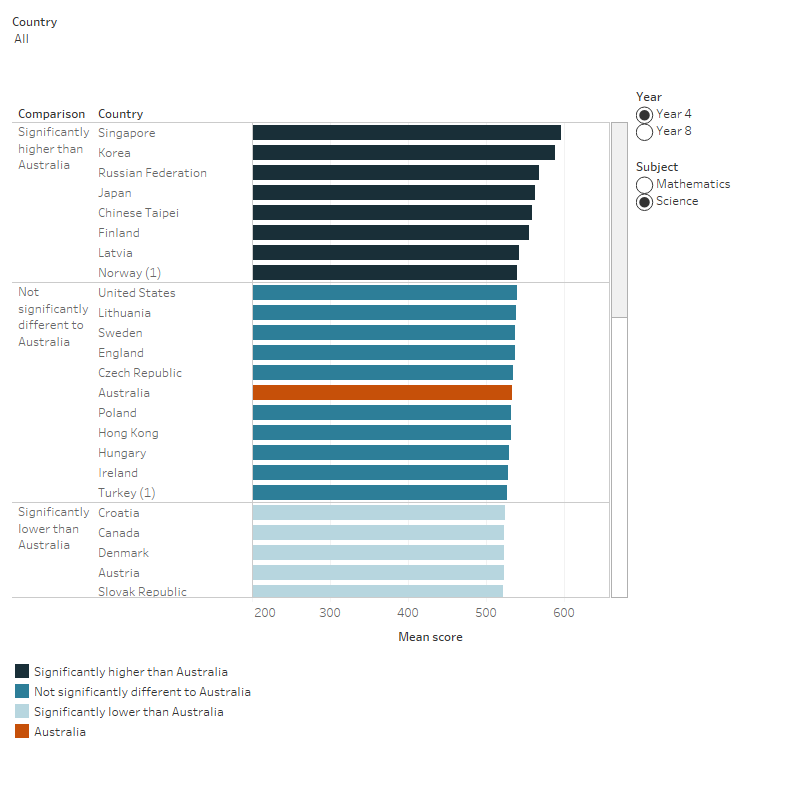
This horizontal bar chart shows the mean scores in the International Mathematics and Science Study (TIMSS) across 64 countries. Australia had a mean score of 516 in Year 4 mathematics, 517 in Year 8 mathematics, 533 in Year 4 science and 528 in Year 8 science. Australia was outperformed by 22 countries in Year 4 mathematics, 6 countries in Year 8 mathematics, 8 countries in Year 4 science, and 6 countries in Year 8 science.
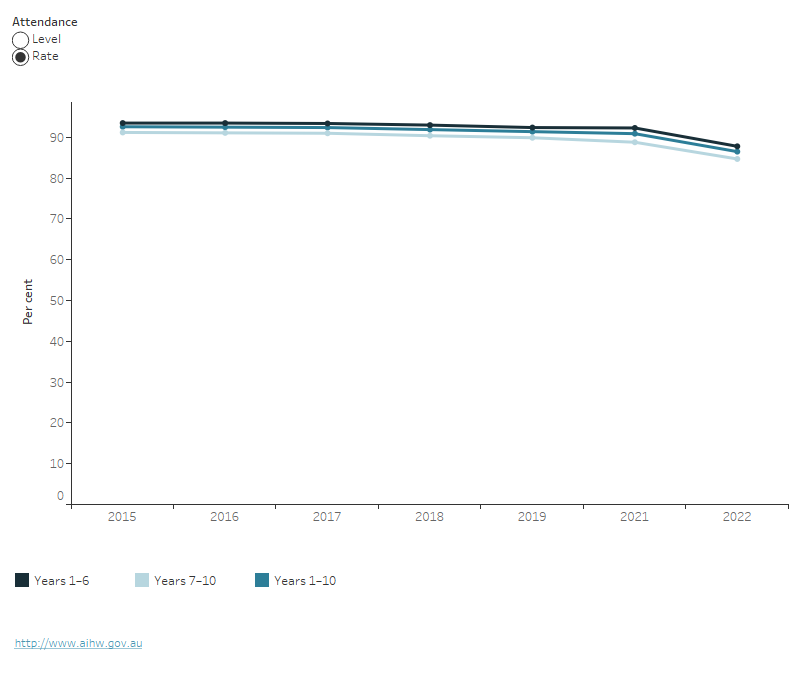
Rate and level of school attendance by year level group, 2016 to 2022
This line graph shows the attendance rate and level between 2015 and 2022 for children in years 1-6, years 7-12 and years 1-10. All groups show a decrease in attendance between 2015 and 2022, with a substantial drop in 2022.
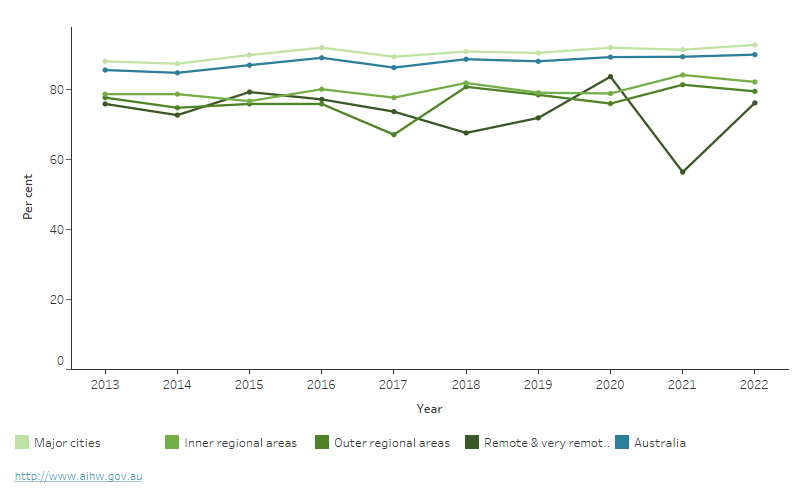
Proportion of people aged 20–24 with year 12 or equivalent, or non-school qualification at certificate III level or above, by remoteness area, 2013 to 2022
This horizontal bar chart shows that the percentage of people aged 20–24 with year 12 or equivalent, or non-school qualification at Certificate III level or above, varies by remoteness area, with people living in less remote areas generally having higher rates of year 12 attainment.
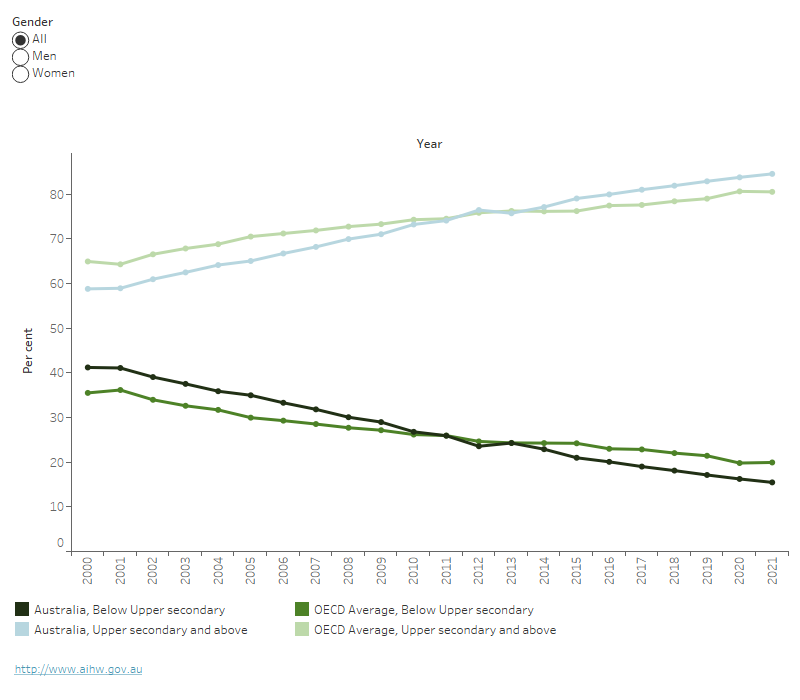
Proportion of adult population aged 25–64 years old, Australia and OECD average, by highest level of education completed and gender, 2000 to 2021
This line graph shows the percentage of adult population whose highest level of education is either below upper secondary or upper secondary and above. Between 2000 and 2021, there was an increase in the percentage of those with upper secondary and above education and a decrease in below upper secondary education for both Australia and the OECD average.