Employment
Employment rate
In 2018, 48% of people aged 15–64 with disability were employed (90% of those in the labour force), compared with 80% of those without disability.
Part-time employment
In 2018, 41% of employed people aged 15–64 with disability worked part time, compared with 32% of those without disability.
Job satisfaction
In 2021, 62% of employed people aged 15–64 with disability were highly satisfied with their job, compared with 67% of those without disability.
On this page:
Introduction
People aged 15–64 with disability have a lower rate of employment than those without disability and are more likely to be working part time. People with disability are also somewhat more likely to be self-employed.
How is employment defined?
Employed people are those who report that they had worked in a job, business, or on a farm during the reference week (the full week before the date of their survey interview); or that they had a job in the reference week, but were not at work.
Data note
Data on this page are largely sourced from the Australian Bureau of Statistics (ABS) 2018 Survey of Disability, Ageing and Carers (SDAC). For more information about the SDAC, including the concepts of disability, disability severity, disability groups, and remoteness categories used by the SDAC, see ‘Data sources’.
Unless otherwise specified, data on this page refer to 2018.
Employment rate
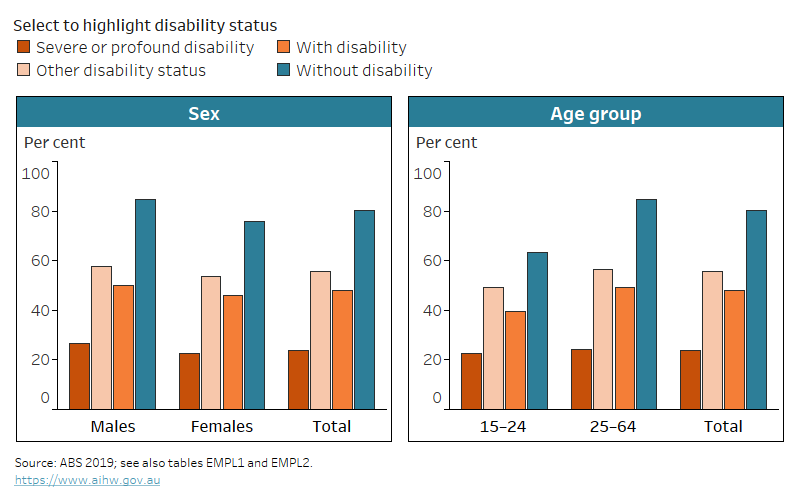
People aged 15–64 with disability have a lower employment rate (48% or 984,000) than those without disability (80% or 11.3 million) (Figure EMPLOYMENT.1). Those with severe or profound disability have a much lower employment rate (24% or 120,000) than those with other disability (56% or 863,000) (ABS 2019).
Among people aged 15–64 in the labour force, the proportion of those employed is 90% for people with disability, 88% for people with severe or profound disability, and 95% for people without disability (ABS 2019).
While the overall employment rate for people aged 15–64 with disability has remained relatively steady in recent years, it has decreased somewhat for those with severe or profound disability (from 27% in 2003 to 24% in 2018) (ABS 2019).
Employment rate
In this section, employment rate (employment-to-population ratio) is the number of employed people aged 15–64 as a percentage of the population aged 15–64 (AIHW 2023).
The employment rate is an indication of the overall level of employment for a population and measures how much of the potential labour resource is being used. As many employment initiatives include trying to engage people not in the labour force in employment (where possible), this rate also includes those not in the labour force.
Females aged 15–64 have a lower employment rate than males (Figure EMPLOYMENT.1). This is true for those with disability (46% compared with 50%) and without disability (76% compared with 85%) (ABS 2019). This is largely related to lower workforce participation among females rather than higher unemployment (see ‘Unemployment’).
Employment rate also varies by age group and disability group:
- people with disability aged 15–24 have a lower employment rate (40% or 116,000) than those aged 25–64 (49% or 870,000) (Figure EMPLOYMENT.1)
- people with sensory and speech disability have the highest employment rate (50% or 205,000) while those with psychosocial disability have the lowest (26% or 165,000) (ABS 2019).
Figure EMPLOYMENT.1: Employment rate of people aged 15–64, by disability status and severity, sex and age group, 2018
The chart shows people with disability are less likely to be employed than those without disability (40% compared with 63% among those aged 15–24).
Notes:
- Restricted to people aged 15–64 living in households.
- Figures are rounded and underwent ABS confidentiality and perturbation processes.
Source data tables: Data tables – Employment. View data tables
Working full time or part time
When employed, people aged 15–64 with disability are less likely to work full time and more likely to work part time than those without disability (Table EMPLOYMENT.1). This is especially the case for people aged 15–64 with severe or profound disability:
- 48% (or 57,000) of those employed work full time, compared with 61% (or 525,000) with other disability
- 52% (or 62,000) work part time, compared with 40% (or 341,000) (ABS 2019).
What is full-time employment?
Full-time employment is defined as working 35 or more hours per week (in all jobs).
Whether employed full time or part time | Severe or profound disability | Other disability status | All with disability | Without disability |
|---|---|---|---|---|
Employed full time | 47.8 | 60.9 | 59.1 | 68.3 |
Employed part time | 51.9 | 39.5 | 40.9 | 31.7 |
Total | 100.0 | 100.0 | 100.0 | 100.0 |
Notes:
- Data are for employed people aged 15–64 living in households.
- Figures are rounded and underwent ABS confidentiality and perturbation processes. Numbers may not add up to 100 per cent due to rounding.
Source: ABS 2019; see also Table EMPL9, Data tables – Employment. View data tables
Whether employed full time or part time | Sensory and speech | Intellectual | Physical restriction | Psychosocial | Other |
|---|---|---|---|---|---|
Employed full time | 69.2 | 43.2 | 59.8 | 42.5 | 50.9 |
Employed part time | 31.7 | 56.8 | 39.9 | 56.9 | 48.4 |
Total | 100.0 | 100.0 | 100.0 | 100.0 | 100.0 |
Notes:
- Data are for employed people with disability aged 15–64 living in households.
- People may report impairments related to more than one disability group. In such cases, people are counted separately for each disability group.
- Estimates for people with head injury, stroke or acquired brain injury not shown due to uncertainty over data quality.
- Figures are rounded and underwent ABS confidentiality and perturbation processes. Numbers may not add up to 100 per cent due to rounding.
Source: ABS 2019; see also Table EMPL12, Data tables – Employment. View data tables
For some disability groups, employed people aged 15–64 are more likely to work part time than full time (Table EMPLOYMENT.2). This is the case for those with:
- intellectual disability (57% or 59,000)
- psychosocial disability (57% or 94,000) (ABS 2019).
While most employed people aged 15–64 with disability work full time, recent years have seen a shift from full-time towards part-time work. For example, between 2003 and 2018, the proportion working:
- full time decreased from 63% to 59%, and from 51% to 48% for those with severe or profound disability
- part time increased from 37% to 41%, and from 49% to 52% for those with severe or profound disability.
This was accompanied by a similar change for employed people without disability, for whom the proportion employed full time decreased from 71% in 2003 to 68% in 2018, and the proportion working part time increased from 29% in 2003 to 32% in 2018 (ABS 2019).
Employed females aged 15–64 with disability are less likely to work full time and more likely to work part time than their male counterparts:
- 46% (or 223,000) worked full time, compared with 72% (or 359,000)
- 54% (or 263,000) worked part time, compared with 28% (or 141,000) (ABS 2019).
Occupations
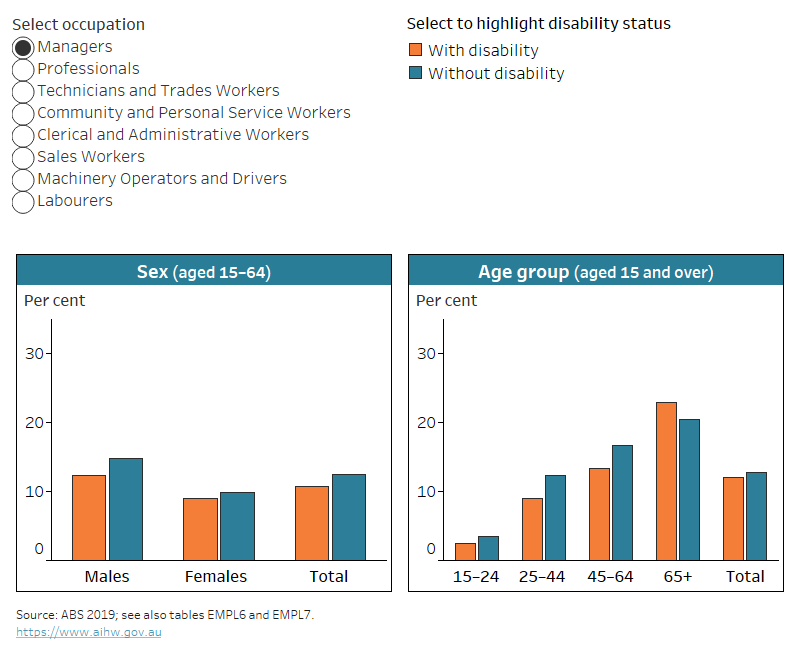
Among employed people aged 15–64 with disability, the most commonly identified occupations are:
- professionals (23% or 222,000)
- technicians and trades workers (15% or 150,000)
- clerical and administrative workers (13% or 130,000)
- labourers (12% or 121,000) (ABS 2019).
Occupations
Occupations in the ABS SDAC are classified according to the Australian and New Zealand Standard Classification of Occupations (ANZSCO) 2013.
People with disability are more likely to work as labourers than people without disability. Among employed people aged 15–64, 12% (or 121,000) of people with disability work in labourer occupations, as do 8.8% (or 991,000) of those without disability (Figure EMPLOYMENT.2, ABS 2019). This pattern is similar for males and females, but is mostly driven by people aged 45–64 (Figure EMPLOYMENT.2).
People with severe or profound disability are even more likely to work in labourer occupations – one in 5 (20% or 24,000) of employed people with severe or profound disability aged 15–64 do so (ABS 2019).
Males with disability are more likely than their female counterparts to work as a:
- labourer – 15% (or 73,000) compared with 9.9% (or 48,000)
- technician and trades worker – 25% (or 127,000) compared with 5.1% (or 25,000)
- manager – 12% (or 62,000) compared with 9.0% (or 44,000) (Figure EMPLOYMENT.2, ABS 2019).
Females with disability are more likely than their male counterparts to work as a:
- professional – 28% (or 134,000) compared with 18% (or 88,000)
- sales worker – 12% (or 59,000) compared with 5.8% (or 29,000)
- clerical or administrative worker – 21% (or 100,000) compared with 6.3% (or 32,000)
- community or personal service worker – 15% (or 70,000) compared with 4.9% (or 25,000) (Figure EMPLOYMENT.2, ABS 2019).
Figure EMPLOYMENT.2: Occupations of employed people, by disability status, age group and sex, 2018
The chart shows that higher proportions of employed people with disability work as labourers (12%) compared with those without disability (8.8%).
Notes:
* Relative standard error of 25–50% and should be used with caution.
- Graph by sex is restricted to employed people aged 15–64 living in households.
- Graph by age group is restricted to employed people aged 15 and over living in households.
- Figures are rounded and underwent ABS confidentiality and perturbation processes.
Source data tables: Data tables – Employment. View data tables
Employment type
Data note
Data in this section are sourced from the 2021 Household, Income and Labour Dynamics in Australia (HILDA) Survey. For more information about HILDA, including the concepts of disability, disability severity, disability groups, and remoteness categories used by HILDA, see ‘Data sources’.
Self-employment
People who operate their own enterprise or engage independently in a profession or trade are referred to as self-employed. In this section, self-employed people include:
- employers, who are owners of incorporated or unincorporated businesses who have one or more employees in addition to themselves
- solo self-employed people, who are owners of incorporated or unincorporated businesses without employees (Wilkins and Lass 2018).
In 2021, about 1 in 10 (11%) employed people with disability aged 15–64 were solo self-employed, 4.5% were employers and 85% were employees. Employed people aged 15–64 with disability were slightly more likely to be solo self-employed than those without disability (11% compared with 7.3%) and less likely to be an employee (85% compared with 88%).
Older employed people aged 65 and over were more likely to be solo self-employed, especially those with disability. About one-third (30%) of employed people aged 65 and over with disability were solo self-employed, compared with around one-quarter (24%) of those without disability (DSS and MIAESR 2022).
Of employed people aged 15–64 with disability:
- females are more likely (89%) to be employees than males (79%)
- those with psychosocial disability are more likely (88%) to be employees than those with physical disability (81%) (DSS and MIAESR 2022).
Employment contract types
This section distinguishes between 3 employment contract types:
- permanent contracts, defined as employment on an ongoing or permanent basis
- fixed-term contracts, defined as employment that ends at a specified date or upon completion of a specific task
- casual employment, which usually means no assured continuity of employment, no paid leave entitlements, and a compensating pay loading (Wilkins et al. 2022).
The most common employment contract type for employees aged 15–64 with disability is permanent employment (71% in 2021), followed by casual employment (23%) and fixed-term employment (6.6%). This is similar for those without disability (71%, 20% and 8.3% respectively). Casual employment is the most common employment type for younger employees aged 15–24 with and without disability (58% and 54%, respectively) (DSS and MIAESR 2022).
Of employees aged 15–64 with disability:
- males are more likely (74%) to have a permanent contract than females (68%)
- those living in Major cities are more likely (73%) to have a permanent contract than those in Inner regional areas (64%)
- those with psychosocial disability are more likely (32%) to be in casual employment than those with physical disability (23%) (DSS and MIAESR 2022).
Selected characteristics of jobs
This section discusses various aspects of the jobs held by people with disability, including job satisfaction, job security, working from home, and retirement plans.
Data note
Data in this section are sourced from the 2021 Household, Income and Labour Dynamics in Australia (HILDA) Survey. For more information about HILDA, including the concepts of disability, disability severity, disability groups, and remoteness categories used by HILDA, see ‘Data sources’.
Job satisfaction
Satisfaction with current job
Each year, the HILDA Survey participants are asked to rate their satisfaction with 5 aspects of their current main job on a 0–10 scale (10 represents the highest level of satisfaction and 0 the lowest):
- Total pay
- Job security
- The work itself
- Work hours
- Flexibility to balance work and non-work commitments
After assessing their satisfaction with each of the above aspects, respondents are then asked how satisfied they are with their current main job, all things considered.
In this analysis, people who indicated a satisfaction level between 0 and 5 are referred to as not satisfied, those with level 6 or 7 as somewhat satisfied, and those with level 8 to 10 as highly satisfied.
The proportion of employed people aged 15–64 with disability who are highly satisfied with their current job has increased from 54% in 2017 to 62% in 2021. This is especially true for those aged 15–24, with 64% being highly satisfied with their current job in 2021, compared with 47% in 2017. The proportion of employed people aged 15–64 without disability who are highly satisfied has increased slightly in the same timeframe (61% in 2017 and 67% in 2021) but stayed about the same for those aged 15–24 (62% in 2017 and 64% in 2021) (DSS and MIAESR 2019, DSS and MIAESR 2022).
However, the satisfaction rate is still lower than for people without disability. In 2021, 62% of employed people aged 15–64 with disability were highly satisfied with their current job compared with 67% of those without disability. Employed people aged 65 and over were the most likely age group to be highly satisfied (77% of those with disability and 81% of those without disability) (DSS and MIAESR 2022).
Job security
Each year, the HILDA Survey asks employees to rate the percentage chance of losing their current job over the next 12 months. This includes being retrenched, fired, or not having their contract renewed.
In 2021, about half (52%) of employees aged 15–64 with disability were confident that there was no chance (0%) of losing their job within the next 12 months. This was similar for those without disability (49%), but varied by sex and remoteness:
- females with disability are more likely (57%) to perceive that there is no chance of losing their job than males with disability (47%)
- those in Major cities are less likely (49%) to perceive that there is no chance of losing their job compared with those in Inner regional (58%), or Outer regional, Remote and Very remote areas (64%) (DSS and MIAESR 2022).
However, employed people aged 15–64 with disability were slightly more likely (13%) to be not satisfied with the job security of their current main job than those without disability (9.7%). This is especially true for males (12% of those with disability compared with 8.4% of those without disability), and people living in Major cities (14% compared with 10%) (DSS and MIAESR 2022).
Working from home
In the HILDA Survey all employed people are asked how many hours they usually work per week in their main job, whether any of their usual hours are worked from home, and how many hours are worked from home. The COVID-19 pandemic had a big impact on where paid work is undertaken and contributed to an increase of employed people working from home (Wilkins et al. 2022).
In 2021, 14% of employed people with disability aged 15–64 worked all hours from home for their main job, 21% worked some hours from home and 65% did not usually work from home at all. Those with disability were less likely (14%) to work all hours from home than those without disability (18%) (DSS and MIAESR 2022).
Some groups of employed people with disability aged 15–64 are less likely to work from home than others:
- 89% of those aged 15–24 do not usually work from home, compared with 64% of those aged 25–44, and 59% of those aged 45–64
- 62% of those in Major cities do not usually work from home, compared with 70% of those in Inner regional, and 79% of those in Outer regional, Remote and Very remote areas
- 82% of those with intellectual disability, 72% of those with sensory disability, 66% of those with psychological disability and 64% of those with physical disability do not usually work from home (DSS and MIAESR 2022).
Retirement plans
Retirement from the workforce is a major life event. HILDA collects data on the age employed people aged 45 and over plan to retire completely from the paid workforce. Most employed people aged 45–64 with disability expect to retire at age 65 or later – 46% expect to retire at age 65–69 and 31% at age 70 or over. This is similar for people without disability (48% and 25%, respectively). Males with disability are more likely to expect to retire later in life, at age 70 or over (39%), than females (24%) (DSS and MIAESR 2022).
ABS (Australian Bureau of Statistics) (2019) Microdata: disability, ageing and carers, Australia, 2018, ABS cat. No. 4430.0.30.002, AIHW analysis of TableBuilder data, accessed 4 August 2021.
AIHW (Australian Institute of Health and Welfare) (2023) Employment and unemployment, AIHW, accessed 21 September 2023.
DSS (Department of Social Services) and MIAESR (Melbourne Institute of Applied Economic Social Research) (2019) The Household, Income and Labour Dynamics in Australia Survey, General Release 18, wave 17, doi:10.26193/IYBXHM, ADA Dataverse, AIHW analysis of unit record data, accessed 11 October 2021.
DSS (Department of Social Services) and MIAESR (Melbourne Institute of Applied Economic Social Research) (2022) The Household, Income and Labour Dynamics in Australia (HILDA) Survey, General Release 21, wave 21, doi:10.26193/KXNEBO, ADA Dataverse, V3, AIHW analysis of unit record data, accessed 7 December 2022.
Wilkins R and Lass I (2018) The Household, Income and Labour Dynamics in Australia Survey: selected findings from waves 1 to 16, Melbourne Institute: Applied Economic and Social Research, University of Melbourne, accessed 11 October 2021.
Wilkins R, Vera-Toscano E, I, Botha F, Wooden M and Trinh T (2022) The Household, Income and Labour, Dynamics in Australia Survey: selected findings from waves 1 to 20, Melbourne Institute: Applied Economic and Social Research, University of Melbourne, accessed 21 September 2023.