Income
Income from wages or salary
In 2018, 41% of people with disability aged 15–64 received income from wages or salary, compared with 73% without disability.
Government payments receipt
In 2018, 44% of people with disability aged 15–64 received a government payment, compared with 12% without disability.
Low income
In 2018, 38% of households with a person with disability had low level of household income, compared with 18% of households without disability.
On this page:
Introduction
Most people with disability have some source of income. This is more likely to be from government sources than from salary or wages, and to be lower than for people without disability (see ‘Level of personal income’ for more details on how income levels are determined).
Higher education is associated with greater income levels, and a higher likelihood of receiving most income from wages or salary, both for people with and without disability. However, people with disability, on average, have lower education levels than those without disability (see ‘Educational attainment’ for more information).
Data note
Data on this page are largely sourced from the Australian Bureau of Statistics' (ABS) 2018 Survey of Disability, Ageing and Carers (SDAC). For more information about the SDAC, including the concepts of disability, disability severity, disability groups, and remoteness categories used by the SDAC, see ‘Data sources’.
Unless otherwise indicated, all data on this page refer to 2018.
Sources of income
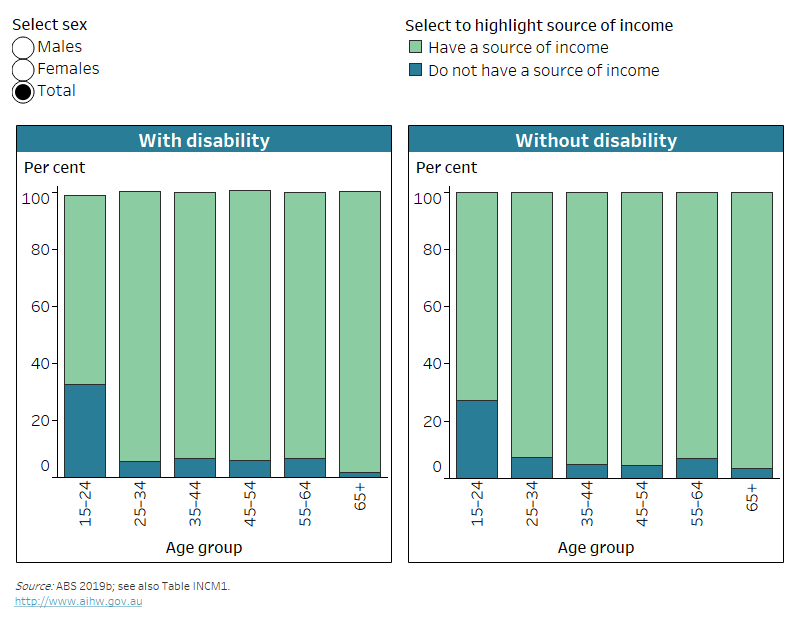
Most people with disability have an income, and are equally likely to have one as those without disability: 90% (or 1.8 million) of people aged 15–64 with disability and 90% (or 12.5 million) of those aged 15–64 without disability have a source of income (Figure INCOME.1, ABS 2019b).
The likelihood of not having a source of income is highest in the 15–24 age group and lowest for those aged 65 and over:
- 33% (or 95,000) of people aged 15–24 with disability and 27% (or 770,000) of those without disability do not have a source of income
- 1.7% (or 29,000) of people aged 65 and over with disability and 3.6% (or 70,000) of those without disability do not have a source of income (Figure INCOME.1, ABS 2019b).
Figure INCOME.1: Whether people have a source of income, by age group, disability status and sex, 2018
The chart shows that 33% of people aged 15–24 with disability do not have a source of income, compared with 27% of their peers without disability.
Notes:
* Relative standard error of 25–50% and should be used with caution.
- Data are for people aged 15 and over living in households.
- Source of income includes wages or salary (including from own incorporated business), government pension, allowance or benefit, child support or maintenance, superannuation, an annuity or private pension, workers' compensation, rental property, unincorporated business or share in a partnership, dividends, interest, and other source of income.
- Figures are rounded and components may not add to total because of ABS confidentiality and perturbation processes.
Source data tables: Data tables – Income. View data tables
People with disability are less likely to receive income from wages or salary, and are more likely to receive income from government payments, than those without disability. Among people aged 15–64 (multiple sources of income may be reported):
- 41% (or 846,000) of people with disability receive at least some income from wages or salary, compared with 73% (or 10.2 million) of people without disability
- 44% (or 909,000) of people with disability receive some income from government payments, compared with 12% (or 1.6 million) of people without disability (ABS 2019b).
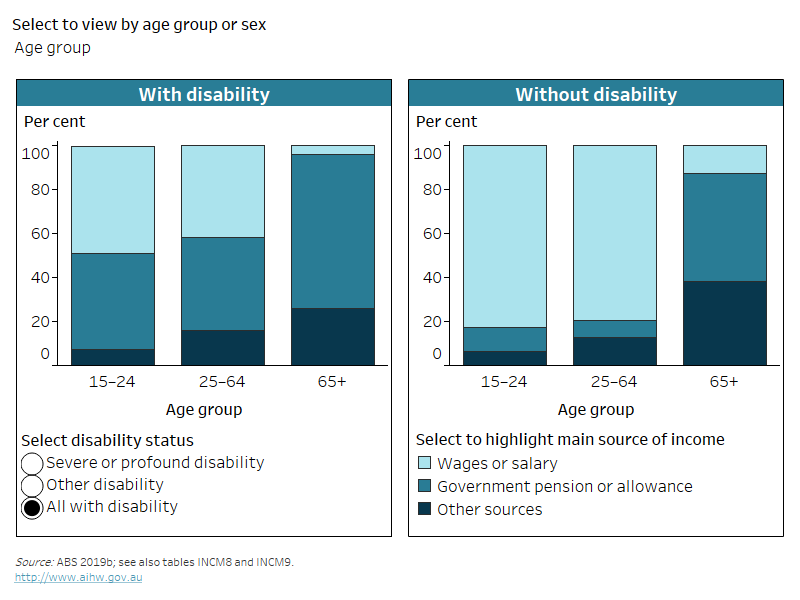
In general, people with disability, especially those with severe or profound disability, are more likely than people without disability to receive their income mainly from a government pension, benefit or allowance and less likely to receive most income from salary or wages. Of people aged 15 and over who have a source of income:
- government pension or allowance is the main source of income for 56% (or 2.0 million) with disability, and 76% (or 702,000) with severe or profound disability, compared with 13% (or 1.9 million) without disability
- salary or wages, including from their own incorporated business, is the main source of income for 24% (or 840,000) with disability, and 9.7% (or 90,000) with severe or profound disability, compared with 71% (or 10.2 million) without disability (Figure INCOME.2).
The main source of income varies by sex, age and severity of disability (Figure INCOME.2). Of those aged 15 and over who have a source of income:
- females with disability (23% or 411,000) are less likely than males with disability (25% or 430,000) to receive wages or salary as their main source of income
- females with severe or profound disability (78% or 394,000) are more likely than males with severe or profound disability (73% or 306,000) to receive a government pension or allowance as their main source of income
- people aged 65 and over with disability (3.9% or 66,000) are less likely to receive wages or salary as their main source of income than those aged 15–64 (42% or 774,000)
- people aged 65 and over with disability (70% or 1.2 million), especially those with severe or profound disability (81% or 404,000), are more likely to receive a government pension or allowance as their main source of income than those without disability (49% or 915,000) (Figure INCOME.2).
Figure INCOME.2: Main source of income, by disability status, age group and sex, 2018
The chart shows 76% of people with severe or profound disability have government pension or allowance as their main source of income.
Notes:
* Relative standard error of 25–50% and should be used with caution.
- Data are for people with disability aged 15 and over, who have a source of income.
- ‘Wages or salary’ include from own incorporated business.
- ‘Other sources’ include child support or maintenance, superannuation, an annuity or private pension, workers' compensation, rental property, unincorporated business or share in a partnership, dividends and / or interest, and other source of income.
- For people with severe or profound disability, categories ‘Other sources’ for those aged 15–24 and ‘Wages or salary’ for those aged 65 and over are not shown as they have a relative standard error greater than 50% and are considered too unreliable for general use.
- Figures are rounded and components may not add to total because of ABS confidentiality and perturbation processes.
Source data tables: Data tables – Income. View data tables
Of people aged 15–64 who have a source of income:
- people aged 15–24 with disability (48% or 95,000) are more likely than those aged 25–64 (42% or 680,000) to receive wages or salary as their main source of income
- people with severe or profound disability (69% or 295,000) are more likely than those with other disability (35% or 486,000) to receive government pension or allowance as their main source of income
- people with disability (42% or 774,000) are less likely than those without disability (80% or 10.0 million) to receive wages or salary as their main source of income
- people with disability living in Major cities (46% or 549,000) are more likely to receive wages or salary as their main source of income than those in Inner regional areas (37% or 165,000), or Outer regional andremote areas (33% or 59,000) (ABS 2019b).
The main source of income also varies by disability group for people aged 15–64 with disability who have a source of income:
- 45% (or 168,000) of those with sensory or speech disability receive wages or salary as their main source of income
- 36% (or 431,000) of those with physical disability
- 28% (or 75,000) of those with intellectual disability
- 22% (or 32,000) of those with disability caused by a head injury, stroke or acquired brain injury
- 20% (or 113,000) of those with psychosocial disability (ABS 2019b).
Level of personal income
A person's level of income is associated with independence, feelings of security and financial freedom. Looking at a person's income level can also provide insight into potential inequality in standard of living.
Measuring income and putting it in context
One way to measure income and inequality is to look at income deciles – dividing the population into 10 equal-sized groups depending on how much income they receive. The bottom decile is those who have the lowest income in the group (bottom 10%). The top decile is those who have the highest level of income (top 10%).
There are many ways to measure and report income. This section uses gross (before tax) weekly personal income to create 3 income groups:
- low income refers to income deciles 1 to 3 ($383 or below per week)
- middle or mid-income refers to deciles 4 to 7 ($384 to $1,150 per week)
- high income refers to income deciles 8 to 10 ($1,151 or more per week).
When using personal income, it is difficult to provide context for poverty because poverty is usually defined using median household income (Davidson et al. 2018). The effect of disability on household income is covered in ‘Level of family and household income’.
It is also difficult to compare personal income against minimum wage because minimum wage assumes a person is working 38 hours a week (FWO 2021). This assumption cannot be made for the whole population. It cannot therefore be suggested that someone is above or below minimum wage based solely on their personal income decile.
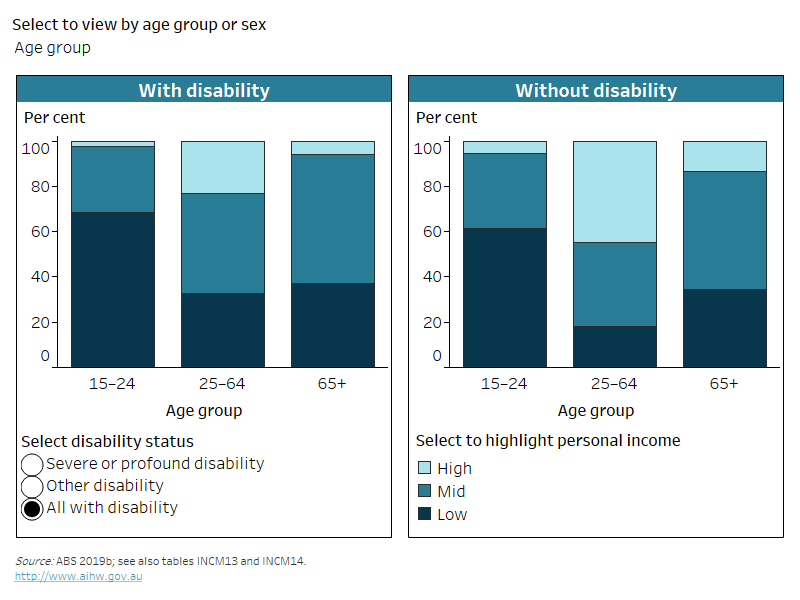
In general, people with disability, especially those with severe or profound disability, are more likely to have a lower level of personal income than people without disability. Of people aged 15–64:
- 38% (or 670,000) with disability, and 51% (or 219,000) with severe or profound disability, have a low level of personal income, compared with 27% (or 3.0 million) without disability
- 42% (or 732,000) with disability, and 44% (or 188,000) with severe or profound disability, are in the mid level of income, compared with 36% (or 4.1 million) without disability
- 20% (or 348,000) with disability, and 5.9% (or 25,000) with severe or profound disability, have a high level of income, compared with 37% (or 4.1 million) without disability (ABS 2019b).
Females aged 15–64 with disability (40% or 365,000) are more likely than their male counterparts (36% or 303,000) to have a low level of personal income. For both males and females, income also varies by level of disability. Of those aged 15–64:
- females with severe or profound disability (4.9% or 11,000) are less likely to have a high level of personal income than females with other disability (19% or 130,000)
- males with severe or profound disability (7.1% or 15,000) are less likely to have a high level of income than males with other disability (31% or 195,000) (ABS 2019b).
Level of personal income varies by age, sex, remoteness and disability group:
- One in 5 (20% or 348,000) people aged 15–64 with disability have a high level of personal income, compared with 5.9% (or 86,000) of those aged 65 and over.
- Males aged 65 and over with disability (9.4% or 66,000) are more likely to have a high level of personal income compared with females (2.7% or 21,000).
- Young people (aged 15–24) with disability (68% or 179,000) are more likely to have a low level of personal income compared with those aged 25–64 (33% or 489,000) and those aged 65 and over (37% or 546,000).
- Young people (aged 15–24) with severe or profound disability (77% or 75,000) are more likely to have a low level of personal income compared with those aged 25–64 (44% or 146,000) (Figure INCOME.3).
- People aged 15–64 with disability living in Major cities (23% or 262,000) are more likely to have a high level of personal income compared with those in Inner regional areas (15% or 65,000), or Outer regional and remote areas (15% or 24,000).
- People aged 15–64 with psychosocial disability (46% or 253,000) or intellectual disability (45% or 125,000) are more likely to have a low level of personal income compared with those with physical disability (39% or 431,000), disability caused by head injury, stroke or acquired brain injury (38% or 48,000), or sensory or speech disability (34% or 120,000) (ABS 2019b).
Figure INCOME.3: Weekly personal income, by disability status, age group and sex, 2018
The chart shows 38% of people aged 15+ with disability, 49% with severe or profound disability, and 28% without disability have low personal income.
Notes:
* Relative standard error of 25–50% and should be used with caution.
- Data are for people aged 15 and over living in households.
- Weekly personal income deciles aggregated into three groups. Low-income includes deciles 1–3 (<$384); mid-income includes deciles 4–7 ($384–$1,150); high-income includes deciles 8–10 (>$1,150).
- Figures are rounded and components may not add to total because of ABS confidentiality and perturbation processes.
Source data tables: Data tables – Income. View data tables
Level of family and household income
Having a person with disability living in the household is associated with lower levels of household income.
Households and families
In the Australian Bureau of Statistics' (ABS) 2018 Survey of Disability, Ageing and Carers (SDAC):
- a household is defined as one or more persons, at least one of whom is at least 15 years of age, and usually living in the same private dwelling
- a family is defined as 2 or more people, one of whom is at least 15 years of age, who are related by blood, marriage (registered or de facto), adoption, step or fostering, and are usually resident in the same household. A family is formed with the presence of a couple relationship, lone parent – child relationship or other blood relationship. Some households therefore contain more than one family (ABS 2019a).
Median gross income gap
In 2018, the median gross income gap between people aged 15–64 with disability and people without disability was $511 per week. For more information, including trends and comparisons by population groups, please see Median gross income gap on Reporting on Australia's Disability Strategy 2021–2031 website.
Measuring household income
This section compares incomes of households using weekly equivalised household income. Weekly equivalised household income is the total gross (before tax) household income adjusted by applying an equivalence scale to compare income levels between households of differing size and composition (ABS 2019a).
The equivalence scale used in this section is the modified Organisation for Economic Co-operation and Development scale (see ABS SDAC methodology for more information).
In this section, households are classified into 3 groups using household income deciles:
- low income refers to income deciles 1 to 3 ($593 or below per week)
- middle or mid-income refers to deciles 4 to 7 ($594 to $1,388 per week)
- high income refers to income deciles 8 to 10 ($1,389 or more per week).
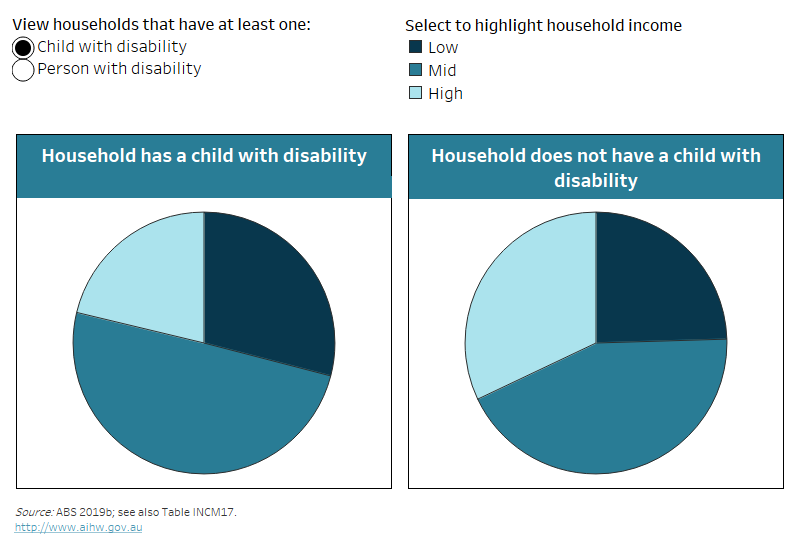
Households with a person with disability are likely to be in the lower range of household weekly income:
- 38% (or 2.2 million) of households with a person with disability have a low level of household weekly income, compared with 18% (or 2.2 million) of households that do not have a person with disability
- 29% (or 475,000) with a child with disability have a low level of household weekly income, compared with those without a child with disability (25% or 3.9 million)
- 21% (or 347,000) with a child with disability have a high level of household weekly income, compared with 32% (or 5.1 million) of households without a child with disability (Figure INCOME.4).
Figure INCOME.4: Weekly equivalised household income, by whether the household includes a child with disability or a person with disability, 2018
The chart shows households with a person with disability are less likely (19%) to have a high equivalised household income than those without (37%).
Notes:
- Data are for people living in households.
- Household income is based on weekly equivalised household income deciles aggregated into 3 groups. Low-income includes deciles 1–3 (<$594); mid-income includes deciles 4–7 ($594–$1,388); high-income includes deciles 8–10 (>$1,388).
- Figures are rounded and components may not add to total because of ABS confidentiality and perturbation processes.
Source data tables: Data tables – Income. View data tables
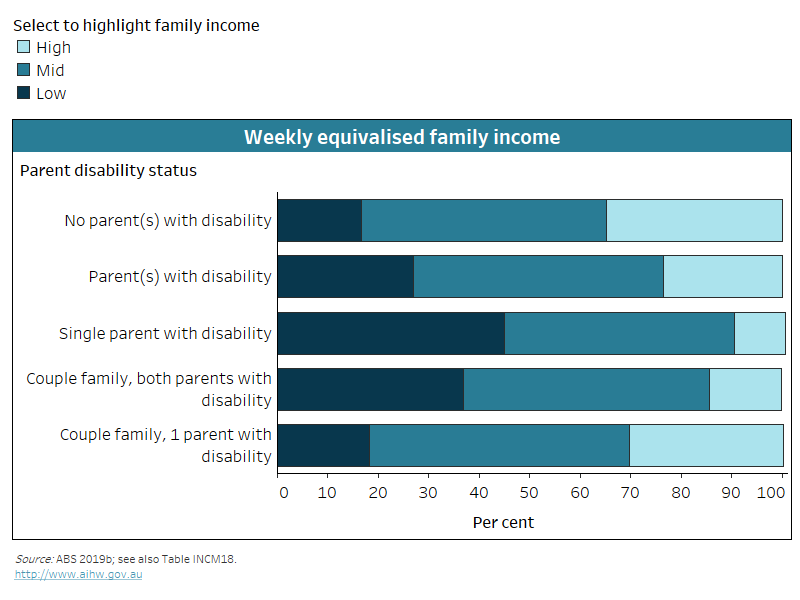
Figure INCOME.5: Weekly equivalised family income, by parent disability status, 2018
Single-parent families where the parent has disability are much more likely to have low income (45%) than families where no parent has disability (17%).
Notes:
- Data are for people in families with at least one dependent or non-dependent child, living in households. Dependent children include those aged under 15 and dependent students aged 15–24.
- Household income is based on weekly equivalised household income deciles aggregated into 3 groups. Low-income includes deciles 1–3 (<$562); mid-income includes deciles 4–7 ($562–$1,343); high-income includes deciles 8–10 (>$1,343).
- Figures are rounded and components may not add to total because of ABS confidentiality and perturbation processes.
Source data tables: Data tables – Income. View data tables
Families with a parent with disability are more likely to be in the lower weekly equivalised family income range:
- 27% (or 527,000) of families with a parent with disability have a low level of family income, 50% (or 970,000) mid-level and 23% (or 459,000) high level
- 17% (or 1.4 million) of families without a parent with disability have a low level, 48% (or 4.1 million) mid-level and 35% (3.0 million) high level
- almost half (45% or 201,000) of one-parent families with a parent with disability have a low level of family income (Figure INCOME.5).
Measuring family income
While the definition of ‘households’ is more generalised and widely used in population-level reporting, there are benefits to comparing families. When doing so, the breakdown of relationships and composition of groups is more clearly understood.
This section uses weekly equivalised family income deciles to classify families into 3 groups:
- low income – families with income in deciles 1 to 3 ($561 or below per week)
- middle or mid-income – families with income in deciles 4 to 7 ($562 to $1,343 per week)
- high income – families with income in deciles 8 to 10 ($1,344 or more per week).
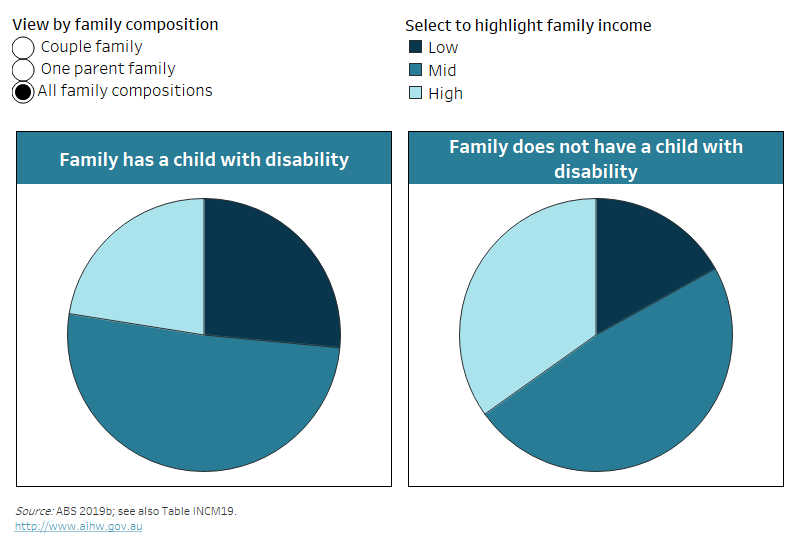
Families with a child with disability are more likely to be in the lower range of weekly equivalised family income than those without a child with disability. Of families with one or more children:
- 1 in 5 (19% or 221,000) couple families with a child with disability have a low level of family income, compared with 12% (or 906,000) of couple families without a child with disability
- 8.7% (or 41,000) of single-parent families with a child with disability have a high level of family income, compared with 16% (or 231,000) of single-parent families without a child with disability (Figure INCOME.6).
Figure INCOME.6: Weekly equivalised family income, by family composition and child disability status, 2018
The chart shows one-parent families with a child with disability are more likely (44%) to have a low family income than those with two parents (19%).
Notes:
- Data are for people in families with at least one dependent or non-dependent child, living in households. Dependent children include those aged under 15 and dependent students aged 15–24.
- Family income is based on weekly equivalised family income deciles aggregated into 3 groups. Low-income includes deciles 1–3 (<$562); mid-income includes deciles 4–7 ($562–$1,343); high-income includes deciles 8–10 (>$1,343).
- Figures are rounded and components may not add to total because of ABS confidentiality and perturbation processes.
Source data tables: Data tables – Income. View data tables
Primary carer income
This report so far had looked at how the disability status of household or family members is related to the level of household and family income. For people who provide unpaid (informal) care to family members or friends with disability (or aged 65 and over), both personal and household income may be affected by the provision of care. Depending on the needs of the person receiving care, an informal carer may need to reduce their working hours or may not be able to earn income from wages or salary. This section looks at the income of primary carers in more detail.
Informal carers
The ABS SDAC defines a carer as a person who provides any informal assistance, in terms of help or supervision, to people with disability or people aged 65 and over. Assistance must be ongoing, or likely to be ongoing, for at least 6 months. In cases where multiple persons are providing informal assistance to a single recipient of care, the SDAC distinguishes between primary, other, and unconfirmed primary carers.
Primary carer
In the SDAC, a primary carer provides the most informal assistance to a person with disability with one or more core activities of mobility, self-care or communication. Primary carers include only people aged 15 and over.
Primary carers are usually a partner (37% or 315,000) or a family member (60% or 516,000), and a small proportion are a friend or neighbour (3.5% or 30,300) (ABS 2019b).
A primary carer’s main source of income varies with the age of the carer. Primary carers aged 65 and over are more likely (68% or 156,000) than those aged 15–64 (39% or 243,000) to receive a government pension or allowance as their main source of income (Table INCOME.1).
Main source of income | Primary carers aged 15–64 | Primary carers aged 65 and over |
|---|---|---|
Wages or salary | 44.7 | 7.1 |
Government pension or allowance | 38.9 | 68.4 |
Other sources | 11.5 | 22.8 |
No source of income | 4.8 | ** |
Total | 100.0 | 100.0 |
Notes:
** Estimate has a relative standard error greater than 50% and is considered too unreliable for general use.
- Data are for people aged 15 and over living in households. People for whom main source of income was recorded as ‘not known’ or ‘not stated’ are excluded from the results shown in the table.
- ‘Wages or salary’ includes from own incorporated business.
- ‘Other sources’ includes child support or maintenance, superannuation, an annuity or private pension, workers' compensation, rental property, unincorporated business or share in a partnership, dividends and/or interest and other source of income.
Source: ABS 2019b; see also Table INCM21, Data tables – Income. View data tables
A primary carer's main source of income also varies by whether the carer lives with the recipient of their care:
- Two in 5 (40% or 191,000) primary carers aged 15–64 who live with the recipient of their care receive wages or salary as their main source of income, compared with 58% (or 87,000) of those who do not.
- Almost three-quarters (73% or 145,000) of primary carers aged 65 and over who live with the recipient of their care receive a government pension or allowance as their main source of income, compared with 43% (or 13,000) of those who do not (ABS 2019b).
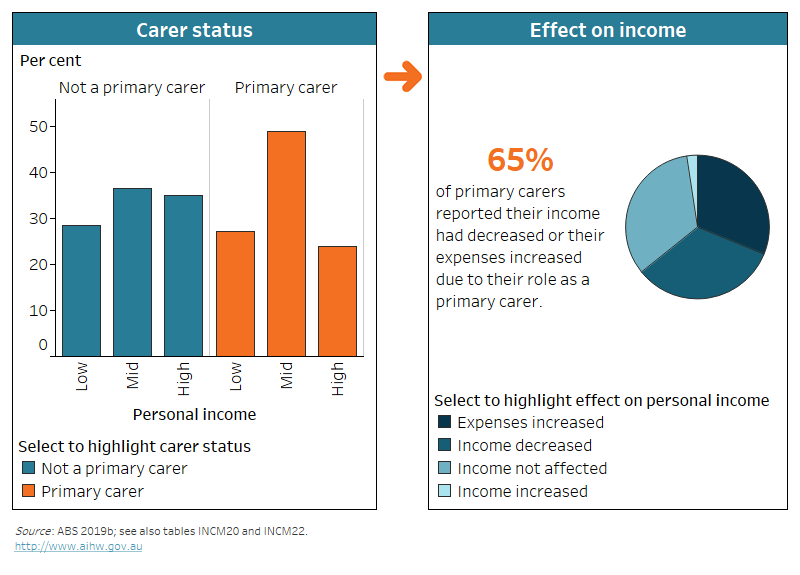
Primary carers aged 15–64 of people with disability are less likely to have a high level of personal income than people in that age group who are not carers:
- about one-quarter (27% or 145,000) of primary carers have a low level of personal income ($383 or below per week), compared with 28% (or 3.6 million) of people who are not primary carers
- half (49% or 262,000) have a mid-level income ($384–$1,150 per week), compared with 36% (or 4.5 million) of people who are not primary carers
- almost one-quarter (24% or 128,000) have a high-level income (more than $1,150 per week), compared with 35% (or 4.4 million) of people who are not primary carers (Figure INCOME.7).
Whether the carer lives with the person with disability they assist has an impact on their personal income. Primary carers aged 15–64 who live with the recipient of their care:
- are more likely to have a low level of income (29% or 119,000) than those primary carers who do not live with the recipient of their care (21% or 25,100)
- are less likely to have a high level of income (20% or 83,000) than those who do not (37% or 45,000) (ABS 2019b).
Most (65% or 366,000) primary carers aged 15–64 report their personal income has decreased or expenses increased because of their role (Figure INCOME.7). This is more likely for primary carers who live with the recipient of their care. Seven in 10 (69% or 297,000) have lower income or higher expenses because of their caring role, compared with half (51% or 70,000) who do not live with the recipient of their care (ABS 2019b).
Figure INCOME.7: Weekly personal income, by primary carer status, and the effect of caring role on personal income of primary carers, 2018
The chart shows primary carers aged 15–64 are less likely (24%) to have a high personal income than people who are not primary carers (35%).
Notes:
- Data are for people aged 15–64 living in households.
- ‘Not a primary carer’ includes unconfirmed primary carers, carers other than primary carers and people who are not carers.
- Primary carers are people aged 15–64 who are the main provider of informal assistance with one or more core activities (mobility, self-care, communication) to a person of any age with disability.
- Personal income is based on weekly personal income deciles aggregated into 3 groups. Low-income includes deciles 1–3 (<$384); mid-income includes deciles 4–7 ($384–$1,150); high-income includes deciles 8–10 (>$1,150).
- Figures are rounded and components may not add to total because of ABS confidentiality and perturbation processes.
Source data tables: Data tables – Income. View data tables
Primary carers aged 65 and over are more likely to have a low level of income than those aged 15–64:
- 2 in 5 (40% or 76,000) primary carers aged 65 and over have a low level of income, compared with 27% (or 145,000) of those aged 15–64
- over half (53% or 101,000) have a mid-level income compared with 49% (or 262,000)
- 1 in 14 (7.2% or 14,000) have a high-level income compared with 24% (or 128,000) (ABS 2019b).
Primary carers aged 65 and over (46% or 92,400) are less likely to have lower income or higher expenses because of their caring role than those aged 15–64 (65% or 366,000) (ABS 2019b).
The household income of primary carers is also generally lower than the income of households where no person is a primary carer: 4 in 10 (39% or 680,000) households where at least one person is a primary carer have a low level of household income ($593 or below per week), compared with 23% (or 3.7 million) of households where no member is a primary carer (ABS 2019b).
Education and income
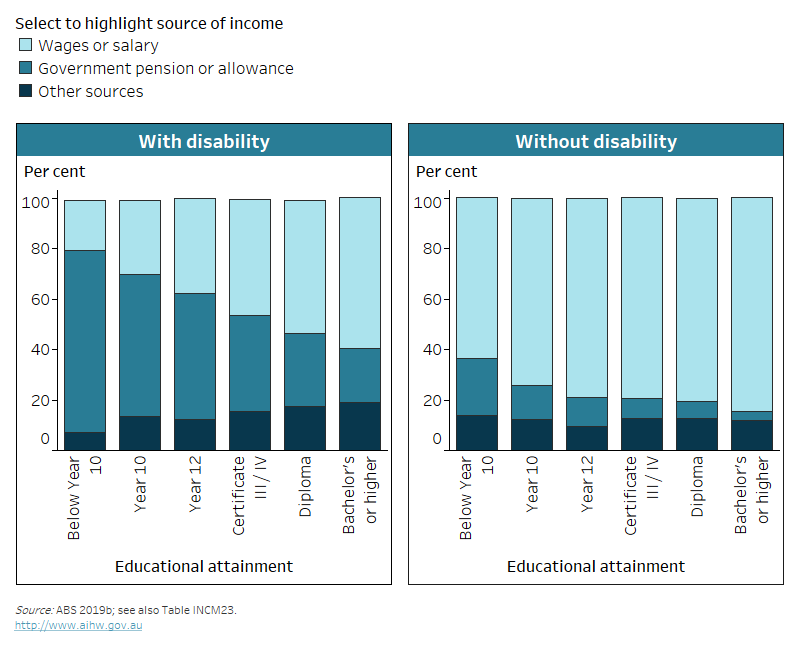
The level of income a person receives is affected by their level of education (see also ‘Education and skills’). However, people with disability who achieve high levels of education are less likely than people without disability to receive their income mainly from wages or salary.
Of people aged 15–64:
- 60% (or 207,000) with disability who attained a bachelor's degree or higher have wages or salary as their main source of income, dropping to 34% (or 19,000) if their disability is severe or profound
- 85% (or 3.6 million) without disability who attained a bachelor's degree or higher have wages or salary as their main source of income (Figure INCOME.8).
Among people with disability aged 15–64, the proportion of people who have government pension or allowance as their main source of income steadily decreases with increasing educational attainment:
- 7 in 10 (72% or 144,000) who have an education level below year 10 (including those who never attended school) have government pension or allowance as their main source of income
- 1 in 2 (50% or 120,000) who completed year 12
- 1 in 5 (21% or 74,000) who attained a bachelor's degree or higher (Figure INCOME.8).
Figure INCOME.8: Main source of income, by disability status and highest level of educational attainment, 2018
The chart shows that proportion of people with disability who have wages or salary as main source of income increases with education level.
Notes:
- Data are for people aged 15–64 living in households, who have a source of income.
- ‘Below Year 10’ includes Certificate I / II, Certificate not further defined, Year 9, and Year 8 or below including never attended school.
- ‘Year 10’ includes Year 10, and Year 11.
- ‘Diploma’ includes Advanced Diploma and Diploma.
- ‘Bachelor’s or Higher’ includes Bachelor Degree, Postgraduate Degree, and Graduate Diploma / Graduate Certificate.
- Figures are rounded and components may not add to total because of ABS confidentiality and perturbation processes.
Source data tables: Data tables – Income. View data tables
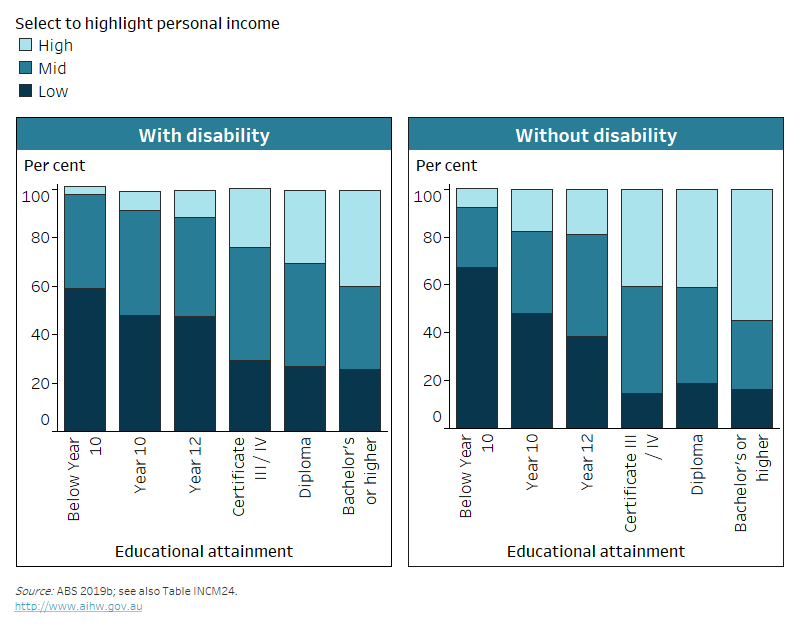
Figure INCOME.9: Weekly personal income, by disability status and highest level of educational attainment, 2018
The chart shows that proportion of people with disability who have high income increases with education (3.6% for below year 10 to 40% for bachelor’s or higher).
Notes:
- Data are for people aged 15–64 living in households.
- Personal income is based on weekly personal income deciles aggregated into 3 groups. Low-income includes deciles 1–3 (<$384); mid-income includes deciles 4–7 ($384–$1,150); high-income includes deciles 8–10 (>$1,150).
- ‘Below Year 10’ includes Certificate I / II, Certificate not further defined, Year 9, and Year 8 or below including never attended school.
- ‘Year 10’ includes Year 10, and Year 11.
- ‘Diploma’ includes Advanced Diploma and Diploma.
- ‘Bachelor’s or Higher’ includes Bachelor Degree, Postgraduate Degree, and Graduate Diploma / Graduate Certificate.
- Figures are rounded and components may not add to total because of ABS confidentiality and perturbation processes.
Source data tables: Data tables – Income. View data tables
This difference between people aged 15–64 with or without disability is also seen in weekly personal income level:
- 40% (or 127,000) of people with disability who attained a bachelor's degree or higher have high personal income, dropping to 18% (or 9,000) if their disability is severe or profound
- 55% (or 2.0 million) of people without disability who attained a bachelor's degree or higher have high personal income (Figure INCOME.9).
Among people with disability aged 15–64, the proportion of people who have a low level of personal income generally decreases with increasing educational attainment:
- 3 in 5 (59% or 128,000) who have an education level below year 10 (including those who never attended school) have a low level of personal income
- less than half (47% or 111,000) who completed year 12
- 1 in 4 (26% or 83,000) who attained a bachelor's degree or higher (Figure INCOME.9).
Government payments
Data note
Data in this section are sourced from the 2021 Household, Income and Labour Dynamics in Australia (HILDA) Survey. For more information about HILDA, including the concepts of disability, disability severity, disability groups, and remoteness categories used by the HILDA Survey, see ‘Data sources’.
Government payments
Government payments are public transfers in the form of pensions, allowances and benefits. Payments available in 2021, at the time of the HILDA Survey 21st wave, included:
- Income support payments
- ABSTUDY, Age Pension, Austudy, Bereavement Allowance, Carer Payment, Disability Support Pension, JobSeeker Payment, Parenting Payment (Single or Partnered), Partner Allowance, Special Benefit, Wife Pension or Widow Allowance, Youth Allowance;
- Department of Veterans' Affairs Disability Pension, Service Pension, War Widow/er's Pension
- Non-income support payments (Mobility Allowance, Carer Allowance, Double Orphan Pension and Australian Government bonus payments)
- Other government payments (such as Paid Parental Leave and Coronavirus Supplement).
Analysis of government payment data in this section is based on self-reported government payments receipt and disability status. Analysis excludes Family Tax Benefit payments.
In 2021, people with disability aged 15–64 were more likely (38%) to report receiving government payments than those without disability (14%). This is especially true for those with severe or profound disability, of whom 66% received government payments. Older people are more likely to receive government payments: in 2021, 77% of people with disability aged 65 and over received government payments, compared with 56% of those without disability.
Of people with disability aged 15–64 (in 2021):
- males (39%) and females (38%) were about as likely to report receiving government payments
- those living in Major cities were less likely (36%) than those living in Inner regional (43%), or Outer regional, remote and very remote areas (47%)
- those with physical disability (43%) or sensory disability (45%) were least likely to report receiving government payments, and those with intellectual disability were most likely (64%) (DSS and MIAESR 2022).
Almost 2 in 5 (39%) people with disability aged 15–64 who reported receiving government payments in 2021 received $400 or more per week, similar to those without disability (38%) (DSS and MIAESR 2022). In 2017, people with disability were more likely to receive payments of more than $400 a week (31% of those aged 15–64 who were receiving government payments) than people without disability (15%) (DSS and MIAESR 2019).
In 2021, of people with disability aged 15–64 who reported receiving government payments:
- 42% of males and 37% of females received payments of $400 or more per week
- 38% of those living in Major cities, 44% in Inner regional areas, and 39% in Outer regional, remote and very remote areas
- 53% of people with head injury, stroke or other brain damage and 52% of people with intellectual disability (DSS and MIAESR 2022).
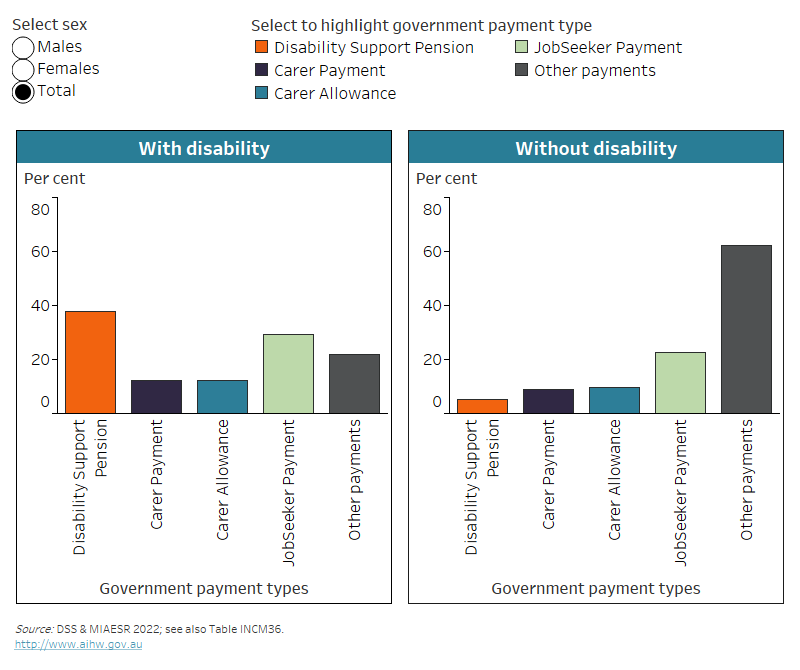
The Disability Support Pension (DSP) is the most common payment type reported by people with disability aged 15–64 who receive government payments (38% in 2021) (Figure INCOME.10). This differs by sex, age group, disability severity and disability group:
- males are more likely (44%) to receive the DSP than females (32%)
- than those aged 45–64 (45%) are more likely to receive DSP than those aged 15–24 (26%) and those aged 25–44 (31%)
- those with severe or profound disability are more likely (61%) to receive DSP than those with other disability status (32%)
- 66% of those with intellectual disability, 65% of those with head injury, stroke or acquired brain injury, 51% of those with sensory disability, 39% of those with physical disability and 38% of those with psychosocial disability receive DSP (DSS and MIAESR 2022).
Other common payment types reported by people with disability aged 15–64 are similar for males and females, with the exception of Carer Allowance (4.3% and 19%, respectively) (Figure INCOME.10).
Of people with disability aged 65 and over who report receiving government payments, 87% receive Age Pension, 4.7% receive Carer Allowance, 4.0% receive Carer Payment and 3.7% receive Disability Support Pension (DSS and MIAESR 2022).
Figure INCOME.10: Government payment types, for payment recipients aged 15–64, by sex and disability status, 2021
The chart shows males with disability who are receiving government payments are more likely than females to receive the Disability Support Pension.
Notes:
- Income from the government in the form of benefits, pensions or allowances, excluding Family Tax Benefit payments.
- People may receive more than one type of government payment. Components will not add to 100%.
- Disability Support Pension is paid by Centrelink.
- Carer Allowance is an income supplement to assist carers.
- ‘Other payments’ include Parenting Payment, Youth Allowance, Disability Pension, Service Pension, COVID-19 Payments, Austudy / ABSTUDY Payment, Special Benefit, War Widows / Widowers Pension, Paid Parental Leave, Bereavement Allowance, Mobility Allowance, other government pensions / benefits (excluding Superannuation and Family Tax Benefit payment), pensions or benefits paid by overseas governments, other allowances, other non-income support payments, don't know, and none of these.
- Numbers in this figure are based on self-reported government payment receipt and disability status.
Source data tables: Data tables – Income. View data tables
Where can I find out more?
- Data tables for this report.
- ABS Disability, Ageing and Carers, Australia: Summary of Findings, 2018.
- Household, Income and Labour Dynamics in Australia (HILDA) Survey.
- This report: ‘Employment’ and ‘Education and skills’ of people with disability.
- People with disability who need help with living costs may access government payments (see ‘Income support’). This includes disability-specific payments (such as the Disability Support Pension) and other mainstream payments (such as JobSeeker Payment).
ABS (Australian Bureau of Statistics) (2016) Australian Statistical Geography Standard (ASGS): Volume 5 – remoteness structure, July 2016, ABS cat. no. 1270.0.55.005, ABS, accessed 4 August 2021.
ABS (2019a) Disability, ageing and carers, Australia: summary of findings methodology, 2018, ABS, accessed 13 May 2022.
ABS (2019b) Microdata: disability, ageing and carers, Australia, 2018, ABS cat. no. 4430.0.30.002, ABS, AIHW analysis of TableBuilder data, accessed 15 June 2020.
Davidson P, Saunders P, Bradbury B and Wong M (2018) Poverty in Australia 2018, Australian Council of Social Service (ACOSS) and University of New South Wales (UNSW) Poverty and Inequality Partnership Report No. 2, ACOSS, Sydney, accessed 4 August 2021.
FWO (Fair Work Ombudsman) (2021) Minimum wages fact sheet, FWO, accessed 4 August 2021.
DSS (Department of Social Services) and MIAESR (Melbourne Institute of Applied Economic Social Research) (2019) The Household, Income and Labour Dynamics in Australia (HILDA) Survey, General Release 18, wave 17 doi:10.26193/IYBXHM, Australian Data Archive (ADA) Dataverse, AIHW analysis of unit record data, accessed 17 December 2021.
DSS and MIAESR (2022) The Household, Income and Labour Dynamics in Australia (HILDA) Survey, General Release 21, wave 21, doi:10.26193/KXNEBO, ADA Dataverse, V3, AIHW analysis of unit record data, accessed 7 December 2022.
Summerfield M, Garrard B, Kamath R, Macalalad N, Nesa MK, Watson N, Wilkins R, Wooden M (2022) HILDA user manual – release 21, Melbourne Institute: Applied Economic and Social Research, University of Melbourne, accessed 23 October 2022.