Activities people need help with
1 in 3
(30%) people with disability living in households need help with health care
1 in 4
(27%) people with disability living in households need help with property maintenance
1 in 2
(48%) people with disability aged 5 and over living in households have a schooling or employment restriction
On this page:
Introduction
People with disability may need assistance to participate in social and economic life. Knowing what activities people need help with can help with planning services and building inclusive communities.
Survey of Disability, Ageing and Carers
Data in this section are largely sourced from the Australian Bureau of Statistics’ (ABS) 2018 Survey of Disability, Ageing and Carers (SDAC). The SDAC is the most detailed and comprehensive source of data on disability prevalence in Australia.
The SDAC considers that a person has disability if they have at least one of a list of limitations, restrictions or impairments, which has lasted, or is likely to last, for at least 6 months and restricts everyday activities.
The limitations are grouped into 10 activities associated with daily living – self-care, mobility, communication, cognitive or emotional tasks, health care, reading or writing tasks, transport, household chores, property maintenance, and meal preparation. The SDAC also identifies 2 other life areas in which people may experience restriction or difficulty as a result of disability – schooling and employment.
The severity of disability is defined by whether a person needs help, has difficulty, or uses aids or equipment with 3 core activities – self-care, mobility, and communication – and is grouped for mild, moderate, severe, and profound limitation. People who always or sometimes need help with one or more core activities, have difficulty understanding or being understood by family or friends, or can communicate more easily using sign language or other non-spoken forms of communication are referred to in this section as ‘people with severe or profound disability’.
Activities of daily living
Three in 5 (60% or 2.5 million) people with disability living in households need help with at least one of 10 activities of daily living (99% or 1.2 million of those with severe or profound disability, and 43% or 1.3 million of those with other disability status) (ABS 2019a, 2019b). Help is most commonly needed with health care, property maintenance, and cognitive or emotional tasks (Table ACTIVITIES.1).
Type of activity | All with disability | Who need help with at least 1 activity |
|---|---|---|
Health care | 29.9 | 50.0 |
Property maintenance | 27.1 | 45.3 |
Cognitive or emotional tasks | 23.7 | 39.7 |
Household chores | 23.4 | 39.1 |
Mobility | 23.0 | 38.5 |
Transport | 21.1 | 35.4 |
Self-care | 15.2 | 25.4 |
Reading or writing tasks | 9.5 | 15.8 |
Meal preparation | 8.8 | 14.8 |
Communication | 7.3 | 12.2 |
Source: ABS 2019a; 2019b.
Whether people with disability living in households need help with at least one activity of daily living varies by sex and age group:
- those aged under 25 are more likely (71% or 459,000) to need help than those aged 25–64 (53% or 932,000) or 65 and over (63% or 1.1 million)
- males aged under 25 are more likely (74% or 277,000) than females under 25 (67% or 182,000)
- females aged 25–64 (56% or 505,000) or 65 and over (71% or 653,000) are more likely to need assistance than males in those age groups (50% or 429,000 and 54% or 456,000 respectively) (ABS 2019b).
Of people with disability living in households who need help with at least one activity:
- the need for help with cognitive or emotional tasks decreases with age (79% or 362,000 of those aged under 25, 45% or 422,000 of those aged 25–64, and 19% or 208,000 of those aged 65 and over)
- those aged under 25 are more likely (41% or 187,000) to need help with oral communication than those aged 25–64 (5.9% or 55,000) or 65 and over (5.8% or 64,000)
- the need for help with household chores or property maintenance increases with age
- 8.3% (or 38,000) of those aged under 25, 41% (or 379,000) of those aged 25–64 and 50% (or 557,000) of those aged 65 and over need help with household chores
- 6.5% (or 30,000) of those aged under 25, 47% (or 442,000) of those aged 25–64 and 60% (or 660,000) of those aged 65 and over need help with property maintenance (ABS 2019b).
Disability group
Disability group is a broad categorisation of disability. It is based on underlying health conditions and on impairments, activity limitations and participation restrictions. It is not a diagnostic grouping, nor is there a one-to-one correspondence between a health condition and a disability group.
The ABS SDAC broadly groups disabilities depending on whether they relate to functioning of the mind or the senses, or to anatomy or physiology. Each disability group may refer to a single disability or be composed of a number of broadly similar disabilities. The SDAC identifies 6 separate groups based on the particular type of disability, these are:
- sensory and speech (sight, hearing, speech)
- intellectual (difficulty learning or understanding)
- physical (including breathing difficulties, chronic or recurrent pain, incomplete use of limbs and more)
- psychosocial (including nervous or emotional conditions, mental illness, memory problems, and social or behavioural difficulties)
- head injury, stroke or acquired brain injury
- other (restrictions in everyday activities due to other long-term conditions or ailments) (ABS 2019b).
Of people aged under 65 with disability living in households:
- 82% (or 631,000) of those with psychosocial disability need assistance with at least one activity of daily living
- 81% (or 430,000) of those with intellectual disability
- 70% (or 120,000) of those with head injury, stroke or acquired brain injury
- 61% (or 845,000) of those with physical disability
- 57% (or 319,000) of those with sensory disability (ABS 2019b).
Type of accommodation
The SDAC collects data for people living in households and in cared accommodation.
Households
In the SDAC, households refer to private dwellings including self-cared accommodation for the retired or aged, and other private dwellings, including houses, flats, home units, garages, tents and other structures used as private places of residence.
Cared accommodation
Cared accommodation is usually long term and may be institutional in style. In the SDAC, cared accommodation includes hospitals, residential aged care, cared components of retirement villages, aged care hostels, psychiatric institutions, and other homes (such as group homes for people with disability). To be included the person must have been, or is expected to be, a resident of the cared accommodation for 3 months or more. The accommodation must include all meals for its occupants and provide 24-hour access to assistance for personal and/or medical needs (ABS 2019a).
The majority of people with disability live in households:
- 99% (or 2.4 million) aged 0–64 live in households and the remaining 0.6% (or 13,500) live in cared accommodation
- 91% (or 1.8 million) aged 65 and over live in households and the remaining 9.0% (or 174,000) live in cared accommodation (ABS 2019b).
People with disability living in cared accommodation (such as in residential aged care or hospital) usually have a higher need for assistance than those living in households. Almost all (99%, or 187,000) people with disability living in cared accommodation need some assistance with a least one of 10 activities of daily living (100% or 183,000 of those with severe or profound disability and 75% or 4,000 of those with other disability status). This is compared with 99% (or 1.2 million) of people with severe or profound disability living in households, and 43% (or 1.3 million) of those with other disability status living in households (ABS 2019b). See Type of housing for more information on people living in cared accommodation compared with in households.
The types of support people with disability need vary according to their age, sex and level of disability (figures ACTIVITIES.1 and ACTIVITIES.2).
Figure ACTIVITIES.1: Activities where assistance is needed for people with disability who need help with at least one activity, by disability status, type of housing and age group, 2018
Horizontal bar chart showing the proportion of people with disability who need help with at least one of 10 activities, including self-care and oral communication. The reader can select to display the chart by age group, by disability status, and by type of housing, including cared accommodation, household, and all living arrangements. The chart shows 75% of people with severe or profound disability aged under 65 need help with mobility compared with 87% aged 65 and over.
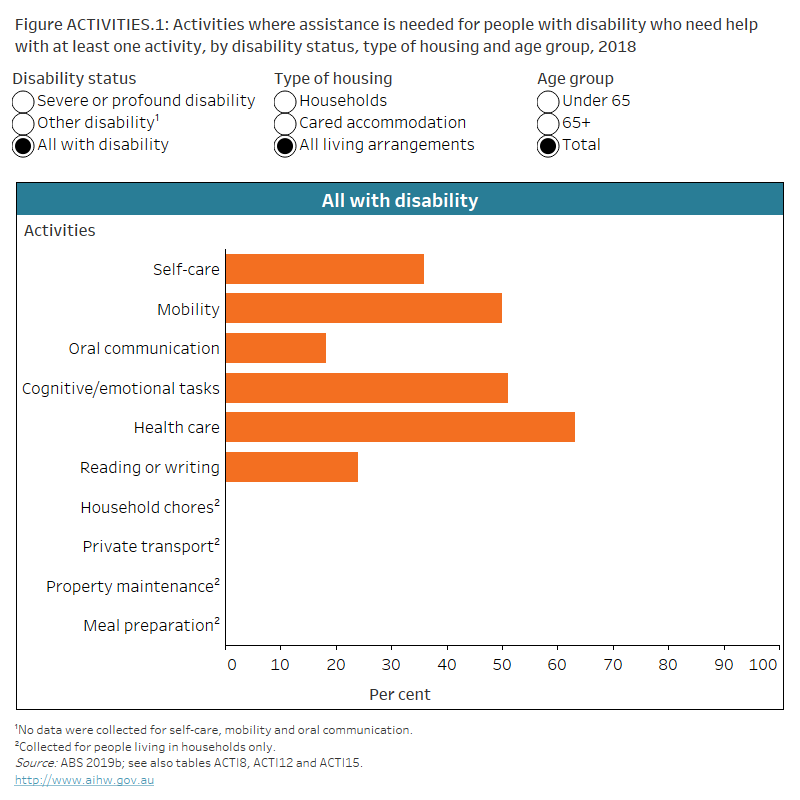
Source data tables: Activities people need help with (XLSX, 281 kB)
Figure ACTIVITIES.2: Activities where assistance is needed for people with disability who need help with at least one activity, by disability status, type of housing and sex, 2018
Horizontal bar chart showing the proportion of people with disability who need help with at least one of 10 activities, including self-care and oral communication. The reader can select to display the chart by sex, by disability status, and by type of housing, including cared accommodation, household, and all living arrangements. The chart shows 75% of males with severe or profound disability need help with mobility compared with 86% of females.
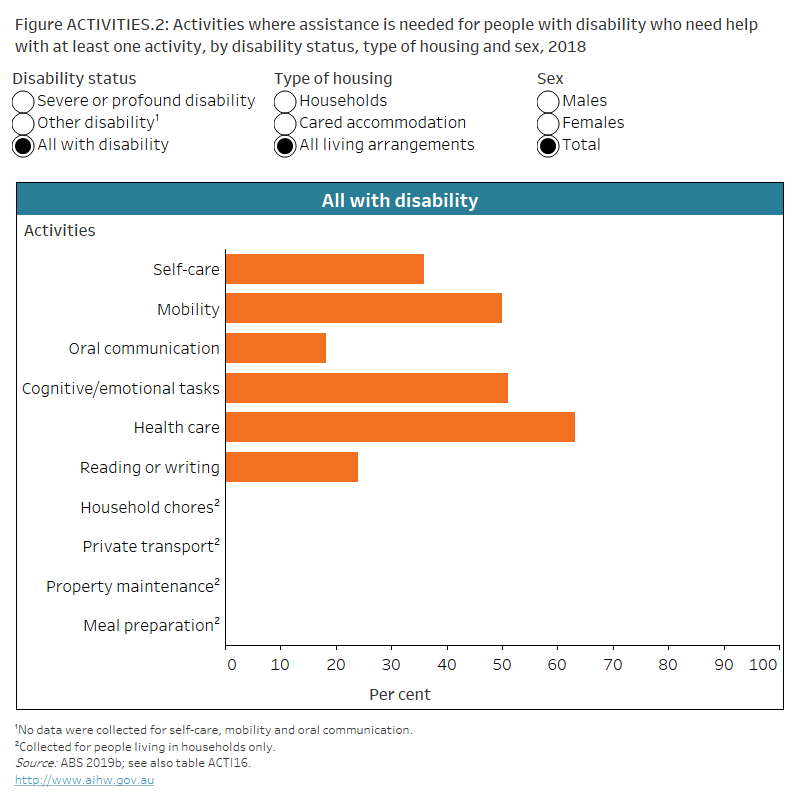
Source data tables: Activities people need help with (XLSX, 281 kB)
Mobility and transport
Mobility limitations and difficulties using public or private transport can make it difficult for people with disability to get to places they need to go to. Accessible transport options, mobility aids and assistance are important to ensure people with disability can participate in society equally and independently.
Mobility limitations
What are mobility limitations?
Mobility is one of the 3 core activities considered by the SDAC and covers tasks such as:
- getting into or out of a bed or chair
- moving about usual place of residence
- moving about a place away from usual residence
- walking 200 metres
- walking up and down stairs without a handrail
- bending and picking up an object from the floor
- using public transport.
The SDAC collects data on whether people have difficulty, need assistance, or use aids or equipment to perform those tasks (ABS 2019a).
Most (98% or 4.2 million) people with disability aged 5 and over are able to leave their place of residence (home or cared accommodation). People with disability aged 65 and over are more likely (2.5% or 48,000) to not leave their place of residence than those aged 5–64 (0.9% or 22,000) (ABS 2019b).
Around one-quarter (26% or 1.1 million) of people with disability aged 5 and over who leave their place of residence, cannot walk 200 metres (18% of those aged 5–64 and 35% of those aged 65 and over). Another 1 in 7 (15% or 650,000) can walk 200 metres but take longer to do so than other people of the same age (ABS 2019b).
More than 2 in 5 (42% or 1.8 million) people with disability aged 5 and over who move about their residence, cannot walk up and down stairs without a handrail (31% of those aged 5–64 and 57% of those aged 65 and over). Another 1 in 9 (12% or 505,000) can walk up and down stairs without a handrail, but have difficulty doing so (ABS 2019b).
One in 8 (13% or 556,000) people, with disability aged 5 and over who leave their place of residence, always need assistance with mobility away from their place of residence (9.4% of those aged 5–64 and 17% of those aged 65 and over). Another 1 in 9 (11% or 467,000) sometimes need assistance with mobility and 4.5% (or 195,000) do not need assistance but have difficulty with mobility (ABS 2019b).
Use of mobility aids
What are mobility aids?
Mobility aids can help people with mobility limitations to move around and perform mobility tasks. Mobility aids include canes, crutches, walking frames, walking sticks, electric and manual wheelchairs, scooter or gopher, specially modified car or car aids, braces, belts, corsets, guide dog or other assistance animals, built-up shoes, orthoses or orthotics, electric operated lounge chairs and/or specialised seating, lifting machine or hoist, other mobility chairs, disability specific mobile apps and other mobility aids.
More than 1 in 7 (16% or 679,000) people with disability use mobility aids (7.7% of those aged 0–64 and 25% of those aged 65 and over). Those with severe or profound disability are almost 7 times as likely (37%) to use mobility aids as those with other disability status (5.4%).
More than 2 in 5 (42% or 78,000) of those aged 0–64 who use mobility aids use a walking stick, 25% use a walking frame, 22% use a manual wheelchair, 17% use crutches and 13% use canes. Almost 3 in 5 (58% or 284,000) of those aged 65 and over who use mobility aids use a walking frame, 40% (or 195,000) use a walking stick, 24% (or 119,000) use a manual wheelchair and 10% (or 52,000) use canes (ABS 2019b).
Around 1 in 25 (3.7% or 89,000) people with disability aged 0–64 use mobility aids for moving around their residence and other places (14% or 273,000 of those aged 65 and over). Another 3.6% (or 88,000) of those aged 0–64 use mobility aids only for moving around places other than their residence (8.6% or 166,000 of those aged 65 and over) (ABS 2019b).
Public transport
One in 7 (14% or 590,000) people, with disability aged 5 and over living in households who leave home, cannot use any form of public transport (12% of those aged 5–64 and 17% of those aged 65 and over). Another 1 in 9 (11% or 458,000) need help or supervision to use public transport and a further 1 in 14 (6.9% or 282,000) are able to use public transport without help or supervision but have difficulty (ABS 2019b).
People with disability may experience indirect discrimination in terms of environmental or structural elements that limit their access to, and ability to use public transport. See Disability discrimination for more information on difficulties people with disability experience when using public transport.
Private transport
Around one-quarter (24% or 884,000) of people with disability, aged 16 and over living in households who leave home need assistance with private transport to get to places away from home (19% of those aged 16–64 and 29% of those aged 65 and over). Females (26% or 509,000) are more likely to need assistance with private transport than males (21% or 372,000):
- 20% (or 206,000) of females aged 16–64 need assistance compared with 17% (or 169,000) of males
- 33% (or 303,000) of females aged 65 and over need assistance compared with 24% (or 205,000) of males (ABS 2019b).
Two in 3 (66% or 2.5 million) people with disability, aged 16 and over living in households who leave home do not have difficulty travelling by private transport without assistance (70% of those aged 16–64 and 61% of those aged 65 and over). A further:
- 15% (or 575,000) always need to be driven
- 8.2% (or 309,000) sometimes need to be driven
- 3.4% (or 126,000) do not need to be driven but have difficulty travelling without assistance
- 6.9% (or 258,000) need to be driven or have other difficulty (ABS 2019b).
More than 4 in 5 (82% or 2.9 million) people with disability, aged 17 and over living in households who leave home and know how to drive, are licensed (85% of those aged 17–64 and 78% of those aged 65 and over) (ABS 2019b).
Schooling and employment restrictions
What is an employment or schooling restriction?
Having a schooling or employment restriction means the person with disability experiences some level of difficulty, requires the assistance of another person, or needs aids or special equipment to participate in education or employment.
See ABS SDAC and Education and Employment for more information on people with schooling and employment restrictions.
People with disability may also have restrictions that specifically make it difficult to participate in schooling or employment. For example, of people with disability living in households, an estimated:
- 1 in 2 (48% or 2.0 million) aged 5 and over have a schooling or employment restriction (65% or 768,000 of those with severe or profound disability and 41% or 1.2 million of those with other disability status)
- 4 in 5 (80% or 305,000) aged 5–18 who attend school have specific restrictions related to their schooling (92% or 190,000 of those with severe or profound disability and 66% or 115,000 of those with other disability status)
- 1 in 2 (47% or 88,000) aged 15–64 studying for a non-school qualification have specific restrictions related to education (73% or 25,000 of those with severe or profound disability and 41% or 61,000 of those with other disability status)
- 2 in 3 (68% or 1.4 million) aged 15–64 have specific restrictions related to employment (91% or 457,000 of those with severe or profound disability and 60% or 936,000 of those with other disability status) (ABS 2019b).
Almost 9 in 10 (87% or 659,000) people aged 5–64 with psychosocial disability living in households have a schooling or employment restriction compared with:
- 85% (or 439,000) of those with intellectual disability
- 82% (or 140,000) of those with head injury, stroke or acquired brain injury
- 75% (or 1.0 million) of those with physical disability
- 67% (or 345,000) of those with sensory disability (ABS 2019b).
Where can I find out more?
Data tables for this report.
ABS Disability, Ageing and Carers, Australia: Summary of Findings, 2018.
ABS (Australian Bureau of Statistics) (2019a) Disability, ageing and carers, Australia: summary of findings, 2018, ABS, accessed 4 August 2021.
ABS (2019b) Microdata: disability, ageing and carers, Australia, 2018, ABS cat. no. 4430.0.30.002, ABS, AIHW analysis of TableBuilder data, accessed 14 July 2021.