Summary
The data in this report come from the Commonwealth/State Disability Agreement Minimum Data Set (CSDA MDS) collection conducted on a snapshot day in May-June 2002, and cover State, Territory and Commonwealth CSDA-funded services. This report includes and significantly expands the information published in Disability Support Services: First National Results 2002, released on the web site of the Australian Institute of Health and Welfare (AIHW) in December 2002.
This report provides estimates relating to a single 'snapshot' day and deals with consumers and their characteristics, and service outlets that are funded to deliver CSDA services.
Data on each previous annual collection have been published by the AIHW. For more information, see the reference section of this report and the AIHW web site.
Consumers and services received
On the 2002 snapshot day, an estimated 65,809 consumers received 77,382 services from a total of 8,142 outlets Australia-wide.
Victoria had the highest proportion of consumers (35%), followed by New South Wales (26%), Queensland (14%), Western Australia and South Australia (each 10%) (Table 1.1).
On the snapshot day:
- 34% of consumers used accommodation support services, in both institutional and community settings (Table 1.1)
- 20% used community support services, which include early childhood intervention, specific therapies, counselling and case management services
- 28% used employment services, covering open employment and supported employment services
- 29% used community access services, mainly covering educational, social and daily living activities
- 5% used respite services, facilities providing short-term breaks from caring activities to carers of people with a disability.
| Service group | NSW | Vic | Qld | WA | SA | Tas | ACT | NT | Total | % |
|---|---|---|---|---|---|---|---|---|---|---|
| Accommodation support | 6,069 | 7,412 | 3,314 | 1,987 | 2,373 | 798 | 297 | 124 | 22,373 | 34.0 |
| Community support | 3,105 | 4,724 | 1,409 | 2,344 | 1,189 | 149 | 213 | 80 | 13,211 | 20.1 |
| Community access | 3,960 | 8,938 | 2,253 | 1,093 | 1,692 | 654 | 220 | 57 | 18,866 | 28.7 |
| Respite | 612 | 1,151 | 515 | 459 | 339 | 46 | 56 | 36 | 3,214 | 4.9 |
| Employment | 5,924 | 4,485 | 2,616 | 2,245 | 2,032 | 521 | 288 | 134 | 18,242 | 27.7 |
| Total consumers | 17,343 | 23,096 | 9,065 | 6,676 | 6,655 | 1,829 | 797 | 389 | 65,809 | 100.0 |
Notes
- Consumer data are estimates after use of a statistical linkage key to account for individuals who have received more than one service on the snapshot day. Totals may not be the sum of the components since individuals may access more than one service type on the snapshot day. There were 41 consumers who accessed services in more than one State or Territory, mainly in 'border' areas.
- Data for consumers of the following CSDA-funded service types were not collected: advocacy, information/referral, combined information/advocacy, mutual support/self-help groups, print disability/alt. formats of communication, research & evaluation, training & development, peak bodies and other support services.
- Data provided by the Commonwealth are preliminary and cover 99% of Commonwealth-funded services.
Sex and age
Overall, 57% (37,677) of consumers were male (Table 3.4); however, this proportion varied with service group from 54% for community access services to 64% for employment services (Table 3.5).
There were greater numbers of males than females for all but the oldest age category (70+ years) (Figure 3.1). For males, the largest age group was the 20-24 year group (4,288 consumers or 11% of all males), and for females the largest group consisted of those aged 35-39 years (2,932 consumers, 11% of all females).
The median age of females (35.4 years) was 2.2 years higher than that of males (33.2 years). In fact, median ages were higher for females than males in every service group, with the largest difference being in community support services (females 17.8 years, males 12.9 years) (Figure 3.2).
Age trends from 1999-2002 show that, overall, the median age for consumers of accommodation support, employment and respite services has increased (Figure 3.3). There has been a fall in the median age of consumers receiving community access and community support services over this same period. This trend, however, is complicated by some service category changes between collections.
Disability groups
The most commonly reported disability group was intellectual, reported by 61% of consumers as their primary disability, and 69% of consumers as one of their significant disabilities (Table 3.8 and Figure 1.1). The next most common disability group was physical, reported as primary by 12% of consumers and as a significant disability by 29%. Speech was the third most commonly reported group when all significant disabilities were considered (22% of consumers); however, it was the second smallest group reported as a primary disability (0.6% of consumers).
Over half of all consumers (53%) reported having more than one disability (Table 3.7). Consumers who reported acquired brain injury as their primary disability were found to be most likely to report at least one other significant disability (with an average of 2.3 disabilities per consumer). The primary disability group least likely to report other significant disability groups was psychiatric (average 1.3 disabilities per consumer).
Consumers used an average of 1.18 services on the snapshot day; this ranged between 1.04 for consumers reporting specific learning/ADD as their primary disability, to 1.22 for intellectual (Table 3.7).
Figure 1.1: Consumers of CSDA-funded services on a snapshot day, primary disability group and all significant disability groups, 2002
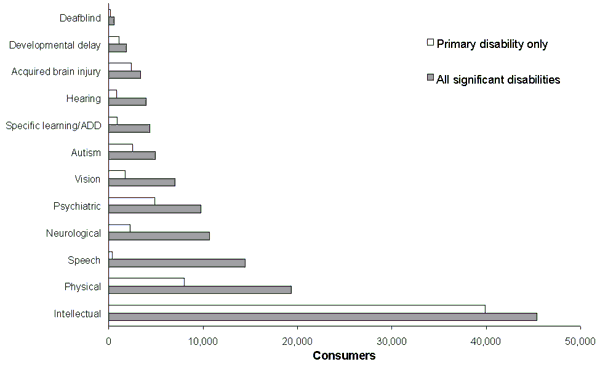
Source: Table 3.8.
Indigenous status
A total of 1,670 consumers (2.5%) were identified as being of Aboriginal or Torres Strait Islander origin or both (Table 3.10). This was very similar to the figure of 2.6% of Indigenous Australians in the general population aged under 65 (Table 3.11). Compared with the overall consumer population, a higher proportion of Indigenous consumers used respite services (5.3%) and community support services (4.0%), and a lower proportion used community access (2.1%) and employment (1.9%) services (Table 3.12).
Indigenous consumers were found to be, on average, much younger than non-Indigenous consumers - the median age of Indigenous consumers was 29.4 years, compared with 34.3 years for non-Indigenous consumers (see also Figure 3.5).
Need for interpreter services
Information on consumers' need for interpreter services was collected for the first time in the 2002 CSDA MDS snapshot collection. Overall, 6.4% of consumers reported needing an interpreter for non-spoken communication, and 1.3% for spoken language other than English (Table 3.15). Over four-fifths (83%) of consumers reported not needing an interpreter at all. The 'not stated' rate for this item was relatively high, at 9%.
Support needs
Information was collected concerning consumers' overall support needs in each of nine life areas, grouped into three more general areas: activities of daily living (ADL), activities of independent living (AIL), and activities of work, education and community living (AWEC).
Considering each of the nine life areas separately, the percentage of consumers always needing support ranged from 27% for communication to 42% for working (Table 3.18).
The highest proportion of consumers always needing support was for the AWEC category (58%), followed by AIL (48%) and ADL (42%) (Table 3.19). This proportion was the highest for those using accommodation support services in all three broad groupings ADL (56%), AIL (64%) and AWEC (74%) (Table 3.19).
Australian-born consumers were more likely to report always needing support in ADL (43%) than overseas-born consumers in any the four English Proficiency (EP) Groups (ranging from 30% to 41%) (Table 3.21).
Consumer location
The recently developed Remoteness Areas of the Australian Standard Geographical Classification were used to classify consumers into geographical areas. Consumers per 1,000 population were the highest in inner regional areas (4.5) and lowest in very remote areas (1.2) (Table 3.22).
Income source
The Disability Support Pension was the main income source for 84% of adult consumers (over 16 years), followed by paid employment (3.6%) and other pensions/benefits (3.5%) (Table 3.24). Just over half (51%) of child consumers (under 16 years) reported that their parent or guardian was in receipt of Carer Allowance (child); however, the 'not known' rate for this item was 40% (Table 3.25).
Living arrangements and residential setting
Around 47% of consumers reported that they lived with their family, 39% lived with others and 12% lived alone (Table 3.27). Most consumers reported living in a private residence (58%), followed by supported accommodation facilities (18%) and domestic-scale supported accommodation (17%) (Table 3.30).
Consumers of multiple services
The majority of consumers (86%) used services from only one service group on the snapshot day (Table 4.1). The remaining 16% used services from two, three, four or five service groups. Consumers of accommodation and community access services were most likely to use more than one service group, whilst consumers using community support and employment services were much less likely to do so (Table 4.2).
The most common combination of service groups on the snapshot day was accommodation with community access (Table 4.3). Within this combination, the specific service types most frequently combined were group homes and learning and life skills development (Table 4.4).
Service outlets
In total, 8,142 CSDA service outlets took part in the 2002 CSDA MDS collection (Table 5.1). The national rate of response was 98% (Table 6.1). Almost three-quarters of outlets (74%) reported that their agency was in the non-government sector whilst the remaining 2,149 (26%) were government-provided (Table 5.1). Most outlets in the non-government sector were income tax exempt (charitable) organisations (68%). Most government outlets were State/Territory-provided (92%), with the majority of remainder local government provided. There were 7,268 State- or Territory-funded CSDA service outlets and 874 Commonwealth-funded service outlets (Tables 5.2 and 5.3).
Most service outlets (40%) reported operating between 7 and 9 hours per day, or 24 hours per day (34%) (Table 5.5). Most outlets operated either for 7 days a week (45%), or 5 days a week (43%) (Table 5.6). The majority of service outlets (68%) reported that they were open for 52 weeks of the year (Table 5.7).
Government expenditure
Total expenditure by governments on CSDA services over the 2001-02 financial year as reported in the Report on Government Services 2003 was $2.75 billion, or $2.53 billion when identified administration expenditure is excluded (Table 1.2). Accommodation support services accounted for just over half of this expenditure ($1,412 million or 51%). Around 11% of the total funds were spent on each of community access ($304 million) and community support ($299 million), and 10% on employment services ($261 million). The remaining government expenditure on disability support services was for administration ($221 million, 8%), respite services ($156 million, 6%), other support services ($64 million, 2%), and finally advocacy, information and print disability services ($29 million, 1%).
| Service group $ million |
NSW | Vic | Qld | WA | SA | Tas | ACT | NT | Cwlth | Australia |
|---|---|---|---|---|---|---|---|---|---|---|
| Accommodation support | 529.68 | 416.58 | 160.58 | 126.36 | 108.53 | 43.52 | 20.02 | 6.76 | 0.00 | 1,412.03 |
| Community support | 74.66 | 92.77 | 34.11 | 50.09 | 26.61 | 6.31 | 6.02 | 8.52 | 0.00 | 299.09 |
| Community access | 86.98 | 129.43 | 40.56 | 15.45 | 12.30 | 10.67 | 2.33 | 1.35 | 4.61 | 303.68 |
| Respite | 57.80 | 36.63 | 26.56 | 13.69 | 7.40 | 6.19 | 2.49 | 0.77 | 4.53(a) | 156.05 |
| Employment | 0.00 | 0.00 | 0.00 | 0.00 | 0.00 | 0.00 | 0.00 | 0.00 | 261.25 | 261.25 |
| Other support | 7.32 | 30.28 | 4.21 | 8.80 | 5.89 | 1.28 | 0.20 | 0.23 | 6.01 | 64.21 |
| Advocacy, information and print disability | 0.83 | 6.01 | 3.65 | 1.31 | 1.87 | 1.56 | 0.87 | 0.07 | 12.69 | 28.86 |
| Subtotal | 757.27 | 711.69 | 269.68 | 215.70 | 162.61 | 69.54 | 31.30 | 17.70 | 289.08 | 2,525.17 |
| Administration | 77.36 | 62.75 | 24.71 | 9.98 | 12.23 | 3.58 | 4.14 | 1.90 | 24.07 | 220.72 |
| Total | 834.63 | 774.43 | 294.38 | 225.68 | 174.84 | 73.12 | 35.44 | 19.59 | 313.14 | 2,745.89 |
- Commonwealth-funded respite services are not funded under the CSDA.
Source: SCRCSSP 2003, Table 13A.21
Outline of the report
Chapter 2 introduces and describes the data collection and how it was conducted, and indicates some of the features affecting interpretation.
Chapters 3 to 5 give a detailed description of the results of the 2002 data collection, concentrating mainly on national patterns. Data are reported on estimates of consumers and on CSDA service outlets. Chapter 4 focuses specifically on multiple service users.
Chapter 6 contains a discussion of the data quality of the 2002 collection.
Appendix 1 contains detailed tables for consumers, services received and service outlets.
Appendix 2 contains copies of the consumer and service outlet collection forms.
Appendix 3 contains detailed information on the statistical linkage key.
Appendix 4 lists English Proficiency Groups by country of birth, related to tables in Section 3.6.