Educational attainment
Leaving school early
In 2018, 21% of people aged 15–64 in 2018 who had acquired disability before age 15 reported they left school before age 16 (8.9% without disability).
Year 12 completion
As at 2018, 34% of people aged 20 and over with disability had completed Year 12 (66% without disability).
Higher education
As at 2018, 17% of people aged 20 and over with disability had a bachelor’s degree or higher (35% without disability).
On this page:
Introduction
Access to education and the level of education attained can affect participation in other key life areas, including employment and ability to achieve economic independence. People with disability are more likely to leave school at younger ages and to have a lower level of educational attainment.
Data note
Data on this page are largely sourced from the Australian Bureau of Statistics' (ABS) 2018 Survey of Disability, Ageing and Carers (SDAC). For more information about the SDAC, including the concepts of disability, disability severity, disability groups, and remoteness categories used by the SDAC, see ‘Data sources’.
Unless indicated otherwise, all data on this page refer to 2018.
Age left school
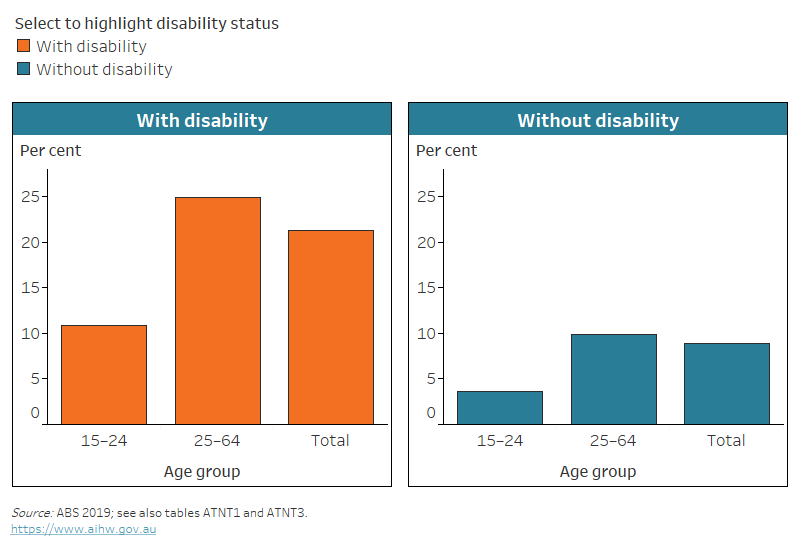
People with disability are more likely to leave school at a younger age than those without disability. Among people aged 15–64 in 2018, almost 1 in 4 (23% or 437,000) people with disability had left school before age 15, compared with 8.9% (or 1.2 million) of those without disability (Figure ATTAINMENT.1, ABS 2019). For people with disability (aged 15–64), this did not vary much by the age of onset of disability: the proportions leaving school before age 16 were 21% (or 85,000) of those who acquired disability before age 15, and 23% (or 350,000) of those who acquired disability after age 15 (ABS 2019).
There have been improvements in school retention for people with disability over time – cohorts who left school in more recent years are less likely to have left school before age 16. Around 1 in 10 (11% or 12,000) people aged 15–24 who acquired disability before age 15 left school before age 16, compared with 3.6% (or 75,000) of those without disability (Figure ATTAINMENT.1, ABS 2019).
Figure ATTAINMENT.1: Proportion of people who left school before age 16, by disability status and age group, 2018
The chart shows that, of people who acquired disability before age 15, 25% in 25–64 age group have left school before age 16 (11% in 15–24 group).
Notes:
- Data are for people aged 15–64 living in households.
- With disability refers to disability onset before age 15.
Source data tables: Data tables – Educational attainment. View data tables
School retention for people with disability varies by remoteness. Of people aged 15–64 in 2018 who acquired disability before age 15, about 1 in 6 (17% or 47,000) living in Major cities left school before age 16. This is lower than for those living in Inner regional areas (31% or 30,000) and Outer regional and remote areas (36% or 11,000) (ABS 2019).
School retention also varies by disability group. Of people aged 15–64 who acquired disability before age 15, more than 1 in 3 (37% or 12,000) people with head injury, stroke, or acquired brain injury left school before age 16. This is double that of those with sensory and speech disability (18% or 20,000) (ABS 2019).
Highest level of education
Completion of Year 12
Around 1 in 3 (34% or 1.2 million) people with disability aged 20 and over in 2018, and 1 in 4 (27% or 261,000) with severe or profound disability have completed year 12 or equivalent. This was much lower than the 2 in 3 (66% or 9.7 million) people without disability in this age range (ABS 2019).
The completion of year 12 for people with and without disability has increased in the last several years. In 2018, 34% of people with disability aged 20 and over had completed year 12 compared with 66% of those without disability; in 2012, these proportions were 28% and 59%, respectively (ABS 2013, ABS 2019).
Whether a person has completed year 12 varies by age, with those in the older age groups less likely to have done so. Among people aged:
- 20–24, 66% (or 90,000) of people with disability had completed year 12 or equivalent, compared with 85% (or 1.3 million) of people without disability
- 50–54, 38% (or 99,000) compared with 56% (or 694,000)
- 85 and over, 15% (or 43,000) compared with 20% (or 20,000) (ABS 2019).
These figures reflect changing patterns of education in Australian society where completion of year 12 is becoming increasingly common.
Australia's Disability Strategy reporting
School completion by students with disability is one of the priorities reported on under the Australia's Disability Strategy. Data on Year 10 and Year 12 completion are reported. For more information, including trends and comparisons by population groups, please see Year 10 completion and Year 12 completion on Reporting on Australia's Disability Strategy 2021–2031 website.
Highest level of education attained
In the last decade, the highest level of educational attainment for people with disability has improved, but is still generally lower than for people without disability. For example, in 2018, a bachelor's or a higher degree was attained by:
- 17% (or 614,000) of people with disability aged 20 and over
- 11% (or 107,000) of those with severe or profound disability in the same age range.
This compared with 35% (or 5.0 million) of people without disability (ABS 2019).
Australia's Disability Strategy reporting
Completion of tertiary education by students with disability is one of the priorities reported on under the Australia's Disability Strategy. Data on vocational education and training (VET) completion and higher education completion are reported. For more information, including trends and comparisons by population groups, please see VET completion and Higher education completion on Reporting on Australia's Disability Strategy 2021–2031 website.
Outcomes on completion of non-school qualification
Data note
Data in this section are sourced from the National Centre for Vocational Education Research (NCVER) Vocational Education and Training (VET) Students Outcomes Collection, and the Department of Education's Graduate Outcomes Survey.
These sources define disability differently from each other and from the ABS SDAC. They also rely on self-disclosure of disability. Because of this, figures vary between sources.
Vocational education and training outcomes
Data from the 2023 VET Student Outcomes collection show that vocational education and training (VET) graduates with disability were less likely to:
- report being satisfied with overall quality of training (87%) than those without disability (89%)
- report having achieved main reason for doing the training (82%) than those without disability (89%) (NCVER 2023).
The data also show that, for people with disability, the main reason for undertaking training is less likely to be employment-related (68% of 2023 VET graduates with disability, compared with 76% of those without). In line with this, VET graduates with disability were:
- less likely to report improved employment status after training (52%) than those without disability (69%)
- less likely to be employed after training (62%) than those without disability (81%)
- more likely to be enrolled in further study after training (40%) than those without disability (33%) (NCVER 2023).
Higher education outcomes
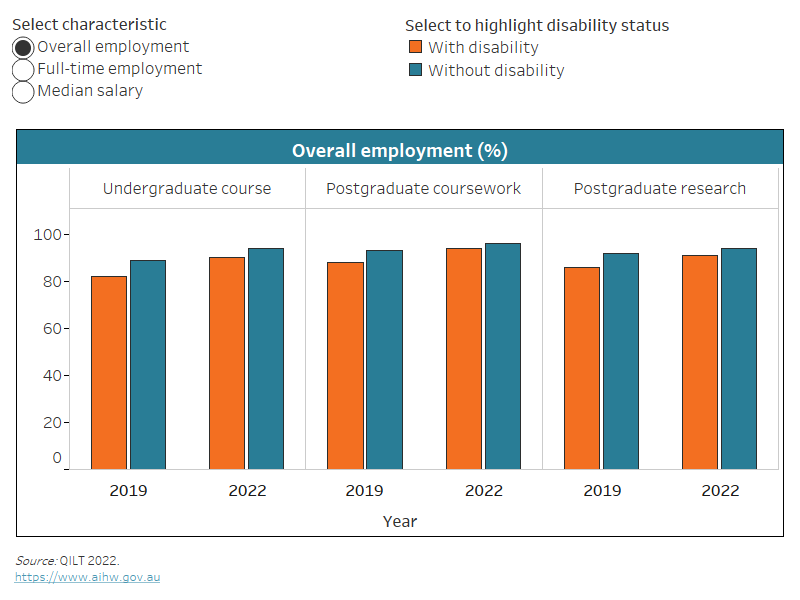
According to the data from 2022 Graduate Outcomes Survey (GOS), graduates with disability were less likely to be employed approximately 4 months after completing their studies than those without disability:
- among graduates from undergraduate courses, 82% of those with disability were employed compared with 89% of those without disability
- among graduates from postgraduate coursework courses, 87% compared with 94%
- among graduates from postgraduate research courses, 85% compared with 92% (QILT 2023).
The 2022 GOS data also show that graduates with disability who were in full-time employment had lower median full-time salaries than those without disability 4 months after graduation:
- among graduates from undergraduate courses, the median full-time salary was $66,000 for those with disability compared with $68,000 for those without disability
- among graduates from postgraduate coursework courses, $83,400 compared with $92,000
- among graduates from postgraduate research courses, $95,000 compared with $96,500 (QILT 2023).
The Graduate Outcomes Survey – Longitudinal (GOS-L) tracks the employment and further study outcomes of graduates of Australian higher education institutions over a longer timeframe. The GOS-L collects information from graduates approximately 3 years after completing their studies, supplementing the GOS data collected 4 months after the graduation.
Data from the 2022 GOS-L show that employment outcomes are generally better for both graduates with and without disability 3 years after graduation compared with the more short-term outcomes at 4 months (Figure ATTAINMENT.2). However, graduates with disability have lower employment rates than graduates without disability, both at the 4-month and 3-year mark:
- In 2022, 3 years after graduation, 90% of undergraduate coursework graduates with disability were employed, compared with 94% of those without disability (for those who were available for any work).
- Among postgraduate coursework graduates, 94% of graduates with disability were employed in 2022, compared with 96% of those without disability.
- Among postgraduate research courses graduates, 91% of graduates with disability were employed in 2022, compared with 94% of those without disability (Figure ATTAINMENT.2).
The gap in employment rates between graduates with and without disability narrowed as more time passed since graduation; for example, the full-time employment gap for graduates of postgraduate courses fell from 8.1 percentage points in 2019 to 3.6 percentage points in 2022 (QILT 2022).
For 2019 graduates, both the 2019 and 2022 median salaries of graduates working full time were similar for those with and without disability (Figure ATTAINMENT.2).
Figure ATTAINMENT.2: Employment outcomes and median salaries of graduates, by disability status and study type, 2019 and 2022
The chart shows 82% of graduates of undergraduate courses with disability were employed 4 months after graduation (2019) and 90% 3 years after (2022).
Notes:
- Data are for graduates of Australian higher education institutions approximately 4 months (2019) and 3 years (2022) after completing their studies.
- Overall employment is reported for graduates who are available for any work.
- Full-time employment is reported for graduates who are available for full-time work.
- Median salary is reported for graduates who are employed full time.
Source data tables: QILT 2022.
ABS (Australian Bureau of Statistics) (2013) Microdata: disability, ageing and carers, Australia, 2012, ABS cat. no. 4430.0.30.002, AIHW analysis of TableBuilder data, accessed 14 September 2020.
ABS (2019) Microdata: Disability, Ageing and Carers, Australia, 2018, ABS cat. No. 4430.0.30.002, ABS, AIHW analysis of TableBuilder data, accessed 12 October 2020.
NCVER (National Centre for Vocational Education Research) (2023) Australian vocational education and training statistics: VET student outcomes 2023, AIHW analysis of DataBuilder data, accessed 5 January 2023.
QILT (Quality Indicators for Learning and Teaching) (2022) 2022 Graduate Outcomes Survey – Longitudinal, QILT website, accessed 19 July 2023.
QILT (2023) 2022 Graduate Outcomes Survey, QILT website, accessed 19 July 2023.