Employment rate and type
Working-age people with disability
have a lower employment rate (48%) than those without disability (80%)
41%
of employed working-age people with disability work part-time, compared with 32% of those without disability
54%
of employed working-age females with disability work part-time, compared with 28% of their male counterparts
On this page:
Introduction
Working-age people with disability have a lower rate of employment than those without disability. They are more likely to be working part-time.
How is employment defined?
Employed people are those who reported in the SDAC that they had worked in a job, business or farm during the reference week; or that they had a job in the reference week, but were not at work.
Survey of Disability, Ageing and Carers
Data in this section are sourced from the Australian Bureau of Statistics’ (ABS) 2018 Survey of Disability, Ageing and Carers (SDAC). The SDAC is the most detailed and comprehensive source of data on disability prevalence in Australia.
The SDAC considers that a person has disability if they have at least one of a list of limitations, restrictions or impairments, which has lasted, or is likely to last, for at least 6 months and restricts everyday activities.
The limitations are grouped into 10 activities associated with daily living – self-care, mobility, communication, cognitive or emotional tasks, health care, reading or writing tasks, transport, household chores, property maintenance, and meal preparation. The SDAC also identifies 2 other life areas in which people may experience restriction or difficulty as a result of disability – schooling and employment.
The severity of disability is defined by whether a person needs help, has difficulty, or uses aids or equipment with 3 core activities – self-care, mobility, and communication – and is grouped for mild, moderate, severe, and profound limitation. People who always or sometimes need help with one or more core activities, have difficulty understanding or being understood by family or friends, or can communicate more easily using sign language or other non-spoken forms of communication are referred to in this section as ‘people with severe or profound disability’.
Employment rate
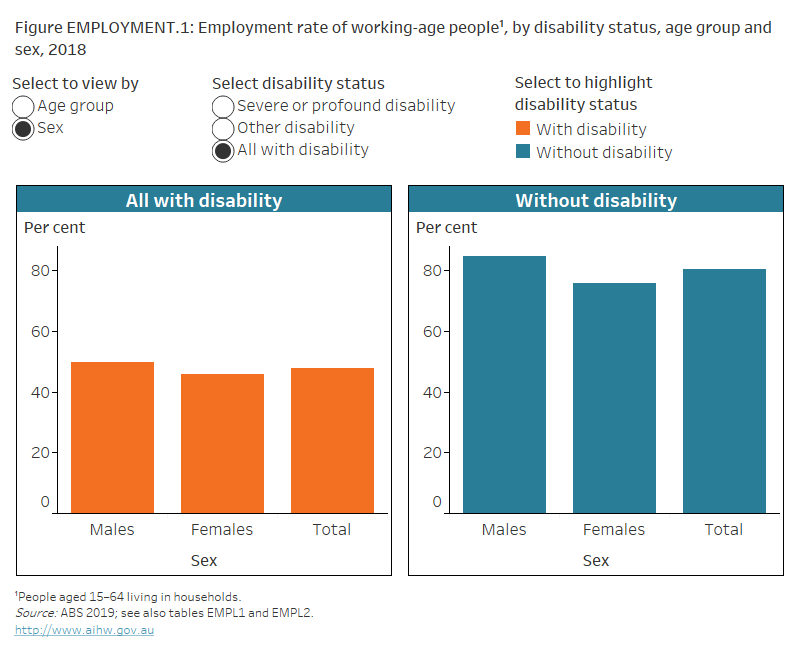
Working-age people with disability have a lower employment rate (48% or 984,000) than those without disability (80% or 11.3 million) (Figure EMPLOYMENT.1). Working-age people with severe or profound disability have a much lower employment rate (24% or 120,000) than those with other disability (56% or 863,000) (ABS 2019).
Employment rate also varies by disability group. People with sensory and speech disability have the highest employment rate (50% or 205,000) while those with psychosocial disability have the lowest (26% or 165,000) (ABS 2019).
Employment rate
In this section, employment rate (employment-to-population ratio) is the number of employed working-age (aged 15–64) people as a percentage of the working-age population (AIHW 2019).
The employment rate is an indication of the overall level of employment for a population and measures how much of the potential labour resource is being used. As many employment initiatives include trying to engage people not in the labour force in employment (where possible), this rate also includes those not in the labour force.
Disability group
Disability group is a broad categorisation of disability. It is based on underlying health conditions and on impairments, activity limitations and participation restrictions. It is not a diagnostic grouping, nor is there a one-to-one correspondence between a health condition and a disability group.
The ABS SDAC broadly groups disabilities depending on whether they relate to functioning of the mind or the senses, or to anatomy or physiology. Each disability group may refer to a single disability or be composed of a number of broadly similar disabilities. The SDAC identifies 6 separate groups based on the particular type of disability; these are:
- sensory and speech (sight, hearing, speech)
- intellectual (difficulty learning or understanding)
- physical (including breathing difficulties, chronic or recurrent pain, incomplete use of limbs and more)
- psychosocial (including nervous or emotional conditions, mental illness, memory problems, and social or behavioural difficulties)
- head injury, stroke or acquired brain injury
- other (restrictions in everyday activities due to other long-term conditions or ailments) (ABS 2019).
While the overall employment rate for working-age people with disability has remained relatively steady in recent years, it has decreased for those with severe or profound disability (from 27% in 2003 to 24% in 2018) (ABS 2019).
Working-age females have a lower employment rate than males (Figure EMPLOYMENT.1). This is true for those with disability (46% compared with 50%) and without disability (76% compared with 85%) (ABS 2019). This is largely related to lower workforce participation among females rather than higher unemployment (see Unemployment).
Figure EMPLOYMENT.1: Employment rate of working-age people, by disability status, age group and sex, 2018
Column chart showing employment rate for working-age people with and without disability. The reader can select to display the chart by sex, by age group, and by disability status. The chart shows people aged 15–24 with disability are less likely (40%) to be employed than those without disability (63%).
Source data tables: Employment (XLSX, 208KB)
Working full- or part-time
When employed, working-age people with disability are less likely to work full-time and more likely to work part-time than those without disability (Table EMPLOYMENT.1). This is especially the case for working-age people with severe or profound disability:
- 48% (or 57,000) of those employed work full-time, compared with 61% (or 525,000) with other disability
- 52% (or 62,000) work part-time, compared with 40% (or 341,000) (ABS 2019).
|
Whether employed full-time or part-time |
Severe or profound disability |
Other disability status |
All with disability |
Without disability |
|---|---|---|---|---|
|
Employed full-time |
47.8 |
60.9 |
59.1 |
68.3 |
|
Employed part-time |
51.9 |
39.5 |
40.9 |
31.7 |
|
Total |
100.0 |
100.0 |
100.0 |
100.0 |
(a) Aged 15–64 living in households.
Note: Figures are rounded and components may not add to total because of ABS confidentiality and perturbation processes.
Source: ABS 2019; see also Table EMPL9.
For some disability groups, employed working-age people are more likely to work full‑time than part-time (Table EMPLOYMENT.2). This is the case for those with:
- sensory and speech disability (69% or 142,000)
- physical disability (60% or 341,000) (ABS 2019).
|
Whether employed full-time or part-time |
Sensory and speech |
Intellectual |
Physical restriction |
Psychosocial |
Other |
|---|---|---|---|---|---|
|
Employed full-time |
69.2 |
43.2 |
59.8 |
42.5 |
50.9 |
|
Employed part-time |
31.7 |
56.8 |
39.9 |
56.9 |
48.4 |
|
Total |
100.0 |
100.0 |
100.0 |
100.0 |
100.0 |
(a) Aged 15–64 living in households.
Notes:
- Components will not add to total as people may report impairments related to more than one disability group. In such cases, people are counted separately for each disability group but are only counted once in the aggregated total.
- Estimates for people with head injury, stroke or acquired brain injury not shown due to uncertainty over data quality.
- Figures are rounded and components may not add to total because of ABS confidentiality and perturbation processes.
Source: ABS 2019; see also Table EMPL12.
While most employed working-age people with disability work full-time, recent years have seen a shift from full-time towards part-time work. For example, between 2003 and 2018, the proportion working:
- full-time decreased from 63% to 59%, and from 51% to 48% for those with severe or profound disability
- part-time increased from 37% to 41%, and from 49% to 52% for those with severe or profound disability.
Employed working-age females with disability are less likely to work full-time and more likely to work part-time than their male counterparts:
- 46% (or 223,000) worked full-time, compared with 72% (or 359,000)
- 54% (or 263,000) worked part-time, compared with 28% (or 141,000) (ABS 2019).
Occupations
Among employed working-age people with disability, the most commonly identified occupations are:
- professionals (23% or 222,000)
- technicians and trades workers (15% or 150,000)
- clerical and administrative workers (13% or 130,000)
- labourers (12% or 121,000) (ABS 2019).
Occupations
Occupations in the ABS SDAC are classified according to the Australian and New Zealand Standard Classification of Occupations (ANZSCO) 2013.
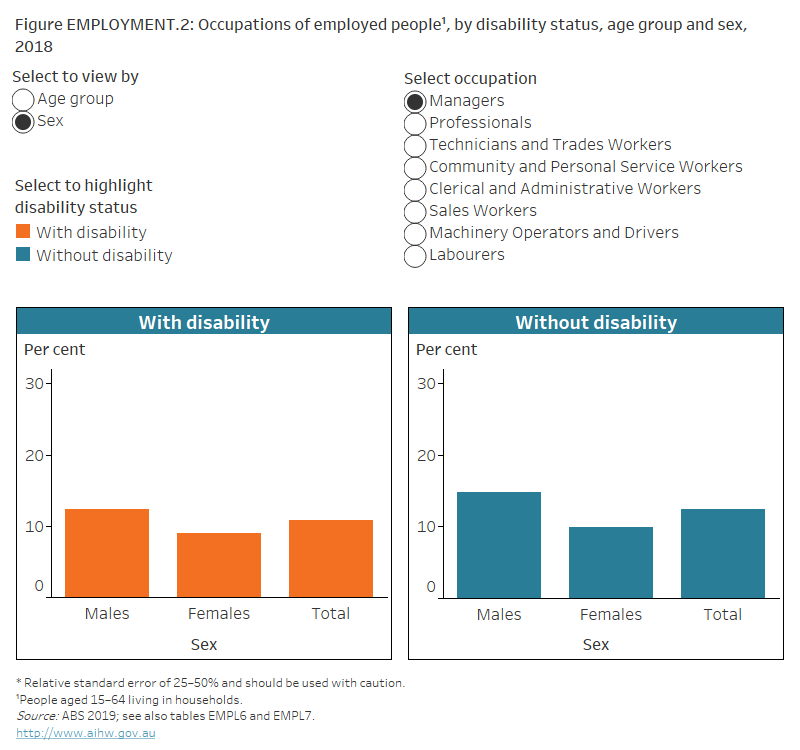
Occupations vary among groups (Figure EMPLOYMENT.2). For example, of working-age people who are employed:
- 1 in 5 (20% or 24,000) with severe or profound disability work as labourers, compared with 1 in 9 (11% or 97,000) who have other disability and 1 in 11 (8.8% or 991,000) without disability
- 1 in 9 (11% or 13,000) work as sales workers, compared with 1 in 11 (8.9% or 77,000) and 1 in 11 (8.8% or 988,000) (ABS 2019).
Males with disability are more likely than their female counterparts to work as a:
- labourer – 15% (or 73,000) compared with 9.9% (or 48,000)
- technician and trades worker – 25% (or 127,000) compared with 5.1% (or 25,000)
- manager – 12% (or 62,000) compared with 9.0% (or 44,000).
Females with disability are more likely than their male counterparts to work as a:
- professional – 28% (or 134,000) compared with 18% (or 88,000)
- sales worker – 12% (or 59,000) compared with 5.8% (or 29,000)
- clerical or administrative worker – 21% (or 100,000) compared with 6.3% (or 32,000)
- community or personal service worker – 15% (or 70,000) compared with 4.9% (or 25,000) (ABS 2019).
Figure EMPLOYMENT.1: Employment rate of working-age people, by disability status, age group and sex, 2018
Column chart showing employment rate for working-age people with and without disability. The reader can select to display the chart by sex, by age group, and by disability status. The chart shows people aged 15–24 with disability are less likely (40%) to be employed than those without disability (63%).
Source data tables: Employment (XLSX, 208KB)
Employment type
Household, Income and Labour Dynamics in Australia Survey
Data in this section are sourced from the Household, Income and Labour Dynamics in Australia (HILDA) Survey. The HILDA Survey is a nationally representative, household-based longitudinal study of Australian households and individuals conducted in annual waves since 2001. Members of selected households who are Australian residents and aged 15 or over are invited to participate in a personal face-to-face interview. This section presents cross-sectional analyses of the 17th wave (2017). In 2017, almost 18,000 people from around 10,000 households participated in the HILDA survey.
The HILDA Survey defines disability as an impairment, long-term health condition or disability that restricts everyday activities and has lasted, or is likely to last, for 6 months or more. This is similar to the definition of disability used by the ABS' Short Disability Module (Summerfield et al. 2019; Wilkins et al. 2019).
How is remoteness defined?
The remoteness categories used in HILDA are based on the Australian Statistical Geography Standard Remoteness Area framework (Summerfield et al. 2019).
Disability group
Disability group is a broad categorisation of disability. It is based on underlying health conditions and on impairments, activity limitations and participation restrictions. It is not a diagnostic grouping, nor is there a one-to-one correspondence between a health condition and a disability group.
The HILDA Survey collects information on 17 disability types, which have been combined into the following 6 disability groups:
- sensory: includes sight, hearing, and speech problems
- intellectual: includes difficulty learning or understanding things
- physical: includes difficulty breathing, blackouts, chronic pain, limited use of arms or fingers, difficulty gripping things, limited use of feet or legs, physical restrictions, and disfigurement or deformity
- psychosocial: includes nervous or emotional conditions, and mental illness
- head injury, stroke or other brain damage
- other: includes long-term conditions that are restrictive despite treatment or medication, and other long-term conditions.
Self-employment
People who operate their own enterprise or engage independently in a profession or trade are referred to as self-employed. In this section, self-employed people include:
- employers, who are owners of incorporated or unincorporated businesses who have one or more employees in addition to themselves
- solo self-employed people, who are owners of incorporated or unincorporated businesses without employees (Wilkins and Lass 2018).
The 13th Annual Statistical Report of the HILDA Survey (wave 1–16) reports that solo self-employed workers are more likely to have disability, work fewer hours per week and have a lower income than employers (Wilkins and Lass 2018).
One in 10 (10%) employed people with disability aged 15–64 are solo self-employed, 1 in 20 (4.6%) are employers and 17 in 20 (85%) are employees. Employed people with disability aged 15–64 are slightly more likely (10%) to be solo self-employed than those without disability (7.1%). Older employed people aged 65 and over are more likely to be solo self-employed, especially those with disability. One-third (33%) of employed people aged 65 and over with disability are solo self-employed, compared with around one-quarter (24%) of those without disability (DSS and MIAESR 2019).
Of employed people aged 15–64 with disability:
- females are more likely (89%) to be employees than males (82%)
- those with intellectual disability are more likely (96%) to be employees than those with sensory disability (84%) or physical disability (83%) (DSS and MIAESR 2019).
Employment contract types
This section distinguishes between 3 employment contract types:
- permanent contracts, defined as employment on an ongoing or permanent basis
- fixed-term contracts, defined as employment that ends at a specified date or upon completion of a specific task
- casual employment, which usually means no assured continuity of employment, no paid leave entitlements, and a compensating pay loading (Wilkins et al. 2019).
The most common employment contract type for employees aged 15–64 with disability is permanent employment (66%), followed by casual employment (24%) and fixed-term employment (10%). This is similar for those without disability (66%, 23% and 11% respectively). Casual employment is the most common employment type for younger employees aged 15–24 with and without disability (61% and 55% respectively) (DSS and MIAESR 2019).
Of employees aged 15–64 with disability:
- females are more likely (26%) to be in casual employment than males (21%)
- those living in Major cities are more likely (68%) to have a permanent contract than those in Inner regional areas (62%), or Outer regional, remote and very remote areas (54%)
- those with psychosocial disability are more likely (33%) to be in casual employment than those with sensory or physical disability (both 22%) (DSS and MIAESR 2019).
Job satisfaction
Satisfaction with current job
In 2017, employed HILDA Survey participants were asked to rate their satisfaction with their current job on a 0–10 scale. Ten represents the highest level of satisfaction and 0 the lowest (DSS and MIAESR 2019). In this analysis, people who indicate a satisfaction level between 8 and 10 are referred to as being totally satisfied or satisfied.
More than half (54%) of employed people aged 15–64 with disability are satisfied or totally satisfied with their current job. This is lower than for people without disability, of whom 61% are satisfied or totally satisfied. Young employed people with disability aged 15–24 are least likely (47%) to be satisfied or totally satisfied, and older people aged 65 and over are most likely to be satisfied (77%). Employed people with disability aged 15–64 living in Major cities are less likely (52%) to be totally satisfied with their job than those in Inner regional areas (62%) (DSS and MIAESR 2019).
Retirement plans
Retirement from the workforce is a major life event. HILDA collects data on the age employed people aged 45 and over plan to retire completely from the paid workforce. Most employed people aged 45–64 with disability expect to retire at age 65 or later. Forty-four per cent expect to retire at age 65–69 and 33% at age 70 or over. This is similar for people without disability (43% and 31% respectively). Males with disability are more likely to expect to retire later in life, at age 70 or over (38%), than females (28%) (DSS and MIAESR 2019).
Commuting
How are commuting times measured?
Daily commute times refer to the total time spent travelling to and from work per day worked. Three commute lengths are distinguished:
- short (less than one hour per day)
- medium (at least one hour but less than 2 hours per day)
- long (2 or more hours per day) (Wilkins et al. 2019).
Self-completion questionnaire
In addition to personal face-to-face interviews, survey participants are asked to complete a self-completion questionnaire. The questionnaire covers the amount of time people spend on a number of activities, such as paid employment and travelling to and from paid employment.
About half (51%) of employed people aged 15–64 with disability spend less than 1 hour commuting to and from work per day worked; around 3 in 10 (29%) spend 1 hour to less than 2 hours; and 2 in 10 (20%) spend 2 hours or more. This is similar for those without disability (52%, 30% and 18% respectively). Of employed people aged 15–64 with disability:
- females are more likely (56%) to have a short daily commute of less than 1 hour than males (46%)
- those in Major cities are less likely (46%) to have a short daily commute than those in Inner regional (63%), or Outer regional, remote and very remote areas (67%) (DSS and MIAESR 2019).
Where can I find out more?
Data tables for this report.
ABS Disability, Ageing and Carers, Australia: Summary of Findings, 2018
ABS (Australian Bureau of Statistics) (2019) Microdata: disability, ageing and carers, Australia, 2018, ABS cat. no. 4430.0.30.002, AIHW analysis of TableBuilder data, accessed 4 August 2021.
AIHW (Australian Institute of Health and Welfare) (2019) Employment and unemployment, AIHW, accessed 2 June 2020.
DSS (Department of Social Services) and MIAESR (Melbourne Institute of Applied Economic Social Research) (2019) The Household, Income and Labour Dynamics in Australia Survey, general release 18 (wave 17), doi:10.26193/IYBXHM, ADA Dataverse, AIHW analysis of unit record data, accessed 11 October 2021.
Summerfield M, Bright S, Hahn M, La N, Macalalad N, Watson N, Wilkins R and Wooden M (2019) HILDA user manual – release 18, Melbourne Institute: Applied Economic and Social Research, University of Melbourne, accessed 12 October 2021.
Wilkins R and Lass I (2018) The Household, Income and Labour Dynamics in Australia Survey: selected findings from waves 1 to 16, Melbourne Institute: Applied Economic and Social Research, University of Melbourne, accessed 11 October 2021.
Wilkins E, Laß I, Butterworth P and Vera-Toscano E (2019) The Household, Income and Labour, Dynamics in Australia Survey: selected findings from waves 1 to 17, Melbourne Institute: Applied Economic and Social Research, University of Melbourne, accessed 11 October 2021.