Introduction
Like everyone, people with disability have health-care needs, access health services to meet them, and have varying health-related experiences. They use a range of mainstream health services, such as general practitioners (GPs), medical specialists, dentists, and hospitals. Their care may require coordination between different health professionals.
People with disability may also rely on informal care, such as that provided by family and friends, to meet or supplement their health-care needs.
Data note
Data on this page are largely sourced from the Australian Bureau of Statistics (ABS) 2018 Survey of Disability, Ageing and Carers (SDAC). For more information about the SDAC, including the concepts of disability, disability severity, disability groups, and remoteness categories used by the SDAC, see ‘Data sources’.
The patient experience information collected in the SDAC does not include health professionals other than GPs, medical specialists, and dental professionals. Hence, it is not possible to examine from this survey whether some needs for non-hospital health services were met by other health professionals, such as nurses, pharmacists, or other allied health professionals.
The patient experience information collected in the SDAC is collected for people with disability living in households and for primary carers. It is not collected for people with disability living in cared accommodation and people without disability who are not primary carers. Hence comparisons with people without disability cannot be directly made.
Unless otherwise indicated, all data on this page refer to 2018.
Assistance with health-care activities
About 23% (an estimated 542,000) of people with disability aged 5–64 living in households need assistance with health care activities. Of those:
- 24% (or an estimated 127,000) receive assistance from formal services only
- 17% (or 93,000) receive assistance from both formal and informal providers
- 47% (or 252,000) receive informal assistance only
- 13% (or 70,000) do not receive any assistance (ABS 2019a).
Four in 5 (81%, or an estimated 439,000) people with disability aged 5–64 living in households who need help with health-care activities have their needs for assistance fully met, and 19% (or 102,000) have their needs for assistance partly met or not met at all (ABS 2019a).
Females aged 5–64 who need assistance with health care are more likely (29% or 75,000) than males (19% or 53,000) to receive formal assistance only, and males are more likely (53% or 150,000) than females (40% or 101,000) to receive informal assistance only (ABS 2019a).
People aged 65 and over with disability living in households and who need help with health-care activities are less likely (22% or 155,000) to receive that assistance from informal providers only than those aged 25–64 (37% or 140,000) or 5–24 (66% or 111,000) (ABS 2019a).
People aged 5–64 with severe or profound disability who need assistance with health care are more likely (56% or 207,000) to receive informal assistance only than those with other disability status (25% or 42,000), and less likely (15% or 57,000) to receive formal assistance only (42% or 71,000) (ABS 2019a).
For people with disability aged 5–64 who need help with health-care activities, the type of assistance received varies depending on the disability group:
- those with intellectual disability (61% or 119,000) are more likely to receive that assistance from informal providers only than those with psychosocial disability (51% or 146,000), sensory disability (48% or 69,000), head injury, stroke or acquired brain injury (47% or 31,000), or physical disability (41% or 164,000)
- those with intellectual disability are more likely (84% or 162,000) to have their need for help with health-care activities fully met than those with sensory or speech disability (73% or 106,000) (ABS 2019a).
Finally, the type of assistance received by those who need it also varies depending on remoteness:
- people with disability aged 5–64 living in Outer regional and remote areas are more likely to receive the assistance from informal providers only (54% or 30,000), compared with those living in Major cities (45% or 162,000) or Inner regional areas (49% or 59,000) (ABS 2019a).
Use of mainstream health services
What health services do people with disability use?
Almost all (97%) people with disability aged under 65 living in households used at least one of the below selected health services for own health in the last 12 months:
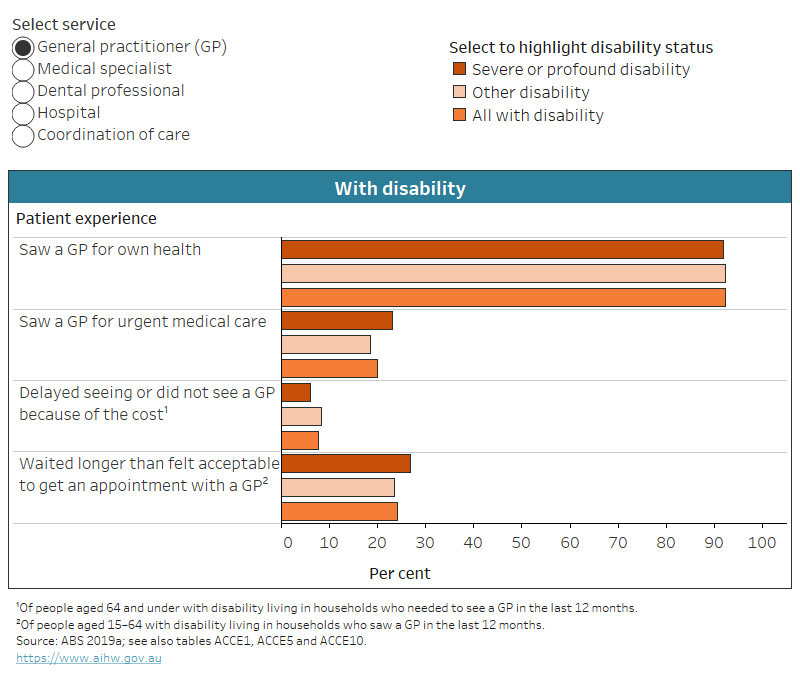
- most (92% or 2.2 million) saw a GP for their own health
- 1 in 5 (20% or 482,000) saw a GP for urgent medical care
- 2 in 3 (63% or 1.5 million) saw a medical specialist
- half (51% or 1.2 million) saw a dental professional
- 1 in 4 (26% or 639,000) visited a hospital emergency department
- 1 in 5 (22% or 541,000) were admitted to hospital
- 2 in 5 (38% or 911,000) saw 3 or more health professionals for the same condition (ABS 2019a).
Females aged under 65 with disability living in households were more likely to use health services within a year than males:
- 95% (or 1.1 million) of females saw a GP for own health compared with 89% (or 1.1 million) of males
- 23% (or 268,000) of females saw a GP for urgent medical care compared with 17% (or 215,000)
- 65% (or 769,000) of females saw a medical specialist compared with 60% (or 743,000)
- 55% (or 648,000) of females saw a dental professional compared with 48% (or 586,000)
- 28% (or 334,000) of females visited a hospital emergency department compared with 25% (or 306,000)
- 24% (or 288,000) of females were admitted to hospital compared with 20% (or 252,000)
- 41% (or 490,000) of females saw 3 or more health professionals for the same condition compared with 34% (or 421,000) of males (ABS 2019a).
The use of mainstream health services by people with disability living in households also varied by age:
- those aged 0–24 were less likely to see a GP (86% or 557,000), see a GP for urgent medical care (15% or 99,000), or be admitted to hospital (18% or 116,000) within one year than those aged 25–64 (95% or 1.7 million, 22% or 383,000 and 24% or 426,000 respectively)
- those aged 0–24 were more likely (64% or 415,000) to see a dental professional than those aged 25–64 (46% or 819,000)
- people aged 65 and over were more likely to see a medical specialist (72% or 1.3 million) or be admitted to hospital (29% or 513,000) than those aged under 65 (63% or 1.5 million and 22% or 541,000 respectively)
- people aged 65 and over were less likely to see a GP for urgent medical care (15% or 268,000) or to see 3 or more health professionals for the same conditions (31% or 545,000) than those aged under 65 (20% or 482,000 and 38% or 911,000 respectively) (ABS 2019a).
Use of mainstream health services varies depending on severity of a person’s disability, disability group, and remoteness of the area where the person with disability lives. These differences are discussed in more detail in ‘Remoteness’, ‘Severity of disability’, and ‘Disability group’ sections on this page.
How does the use of mainstream health services compare for people with and without disability?
The patient experience information in the SDAC is collected only from people with disability and primary carers (living in households). It is not therefore possible to compare with people without disability.
However, the AIHW analysis of self-reported information from the 2021 HILDA Survey suggests that, in 2021, people with disability aged 15–64 had higher rates of use of:
- GPs or family doctors (92% compared with 76% of those without disability)
- mental health professionals (26% compared with 9.4%)
- specialist doctors (43% compared with 20%)
- hospital doctors as an outpatient or casualty (29% compared with 12%)
- hospital overnight stays (20% compared with 6.8%)
- hospital admission as day patient (16% compared with 9.5%) (DSS and MIAESR 2022).
- In contrast to this, people with disability aged 15–64 were slightly less likely to visit a dentist (51%) than people without disability (56%) (DSS and MIAESR 2022).
How many people have a regular GP?
People aged 15–64 with disability were more likely to see a particular GP or clinic when they were sick or needed advice about their own health than those without disability (93% compared with 84% in 2021). Of people with disability:
- people aged 65 and over were more likely (99%) to see a particular GP or clinic than people aged 15–64 (93%)
- females (94%) aged 15–64 were about as likely as males (92%) (DSS and MIAESR 2022).
Difficulties accessing health services
Service accessibility depends on many factors. Some people with disability experience difficulties accessing health services; barriers include:
- unacceptable or lengthy waiting times
- cost
- inaccessibility of buildings
- discrimination by health professionals.
They may also experience issues caused by lack of communication between the health professionals treating them.
People with disability aged under 65 living in households experienced a range of difficulties in accessing health services in the last 12 months. In 2018, these included:
- problems with waiting time:
- 1 in 4 (24% or 386,000) of those aged 15–64 who needed to see a GP waited longer than they felt acceptable to get an appointment, and 1 in 3 (31% or 285,000) of those who needed to see a medical specialist
- 3 in 10 (29% or 142,000) of those who needed to see a GP for urgent medical care waited one or more days after making an appointment to be seen
- 1 in 8 (13% or 202,000) of those who needed to see a dental professional were placed on a public dental waiting list. 7 in 10 (70% or 98,000) of those placed on a public dental waiting list waited 1 month to more than 1 year before receiving dental care (ABS 2019a).
- delaying or not seeing health professionals because of cost. This was the case for:
- 3.6% (or 21,000) of those who needed to go to hospital (one of the reasons)
- 4.6% (or 71,000) of those who needed to see a medical specialist (the main reason)
- 7.6% (or 172,000) of those who needed to see a GP in the last 12 months (one of the reasons)
- 28% (or 449,000) of those who needed to see a dental professional (one of the reasons) (ABS 2019a).
- problems with health services coordination, accessibility, or discrimination:
- 1 in 8 (12% or 78,000) of those who have been to a hospital emergency department felt a GP could have provided care for their most recent visit
- 1 in 5 (21% or 187,000) of those who saw 3 or more health professionals for the same health condition reported issues caused by lack of communication among health professionals
- 3.5% (or 59,000) of those aged 15–64 experienced discrimination by health staff (GP, nurse, hospital staff)
- 1 in 8 (12% or 96,000) of those aged 5–64 who need assistance or have difficulty with communication or mobility had difficulty accessing medical facilities (GP, dentist, hospital) (ABS 2019a).
People aged 25–64 with disability are more likely than older or younger people to delay or not see a health professional when needed because of the cost.
- Those aged 25–64 (8.9% or 150,000) are more likely to delay or not see a GP when needed to because of the cost than those aged under 25 (4.3% or 24,000) or aged 65 and over (1.2% or 21,000).
- Those aged 25–64 (34% or 395,000) are more likely to delay or not see a dental professional than those aged under 25 (12% or 55,000) or aged 65 and over (11% or 110,000) (ABS 2019a).
Difficulties accessing health services vary depending on severity of a person’s disability, disability group, and remoteness of the area where the person with disability lives. These differences are discussed in more detail in ‘Remoteness’, ‘Severity of disability’, and ‘Disability group’ sections on this page.
How do difficulties in accessing health services compare for people with and without disability?
As the patient experience information in the ABS SDAC is collected only from people with disability and their carers, it is not possible to make comparisons with people without disability.
While not directly comparable, information from the ABS Patient Experience Survey, which looks at the use of health services by the general Australian population, suggests that people with disability are more likely to face barriers such as cost when accessing some types of health services. For example, in the last 12 months:
- According to the 2018 SDAC, of people with disability aged 15–64:
- 8.7% delay or do not see a GP when needed
- 32% delay or do not see a dental professional when needed
because of cost (ABS 2019a).
- According to the 2018–19 Patient Experience Survey, of the general Australian population aged 15–64:
- 4.1% delay or do not see a GP when needed
- 20% delay or do not see a dental professional when needed
because of cost (ABS 2019b).
Remoteness
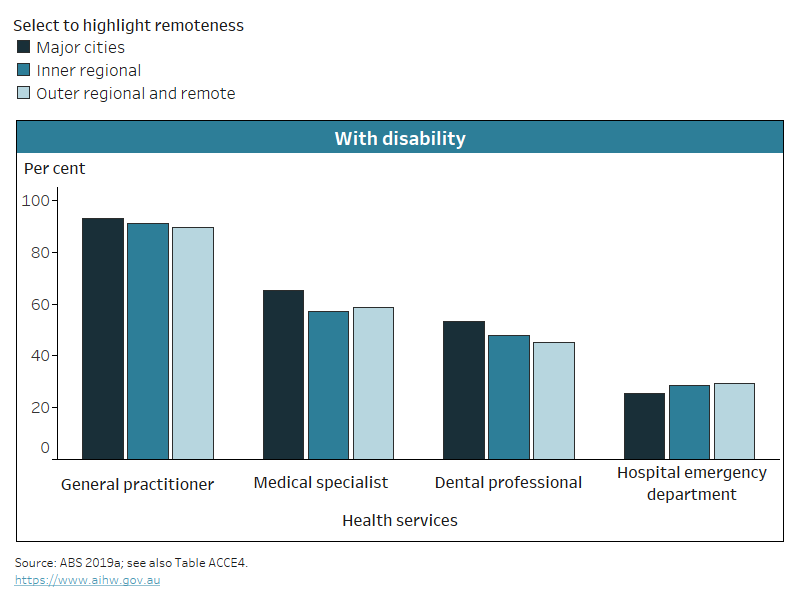
People with or without disability living in more remote areas may experience greater difficulties accessing primary health care (such as GPs or dentists) or medical specialists. At the same time, people in regional and remote areas may be more reliant on hospitals for their health care, including potentially avoidable GP-type presentations to the emergency departments (O’Loughlin et al. 2021).
For people with disability aged under 65 living in the community, there is some evidence of greater difficulties accessing health services in regional and remote areas (Figure ACCESS.1 and Table ACCESS.1). For instance, 65% (or 1.1 million) of those living in Major cities reported seeing a medical specialist in the last year, compared with 57% (or 327,000) in Inner regional and 59% (or 136,000) in Outer regional and remote areas. At the same time, hospital emergency department visits increased with remoteness, from 25% (or 407,000) in Major cities to 29% (or 68,000) in Outer regional and remote areas (Figure ACCESS.1). Those in regional and remote areas are also more likely to wait longer for an appointment with a GP or a medical specialist, or to receive dental care (Table ACCESS.1).


 Wait 6 months or more on public dental waiting list before receiving dental care(g)