Health risk factors and behaviours

47% of people

aged 2 and over with disability do not eat enough fruit and vegetables, compared with 41% without disability

18% of people

aged 15 and over with disability smoke daily, compared with 12% without disability

72% of people

aged 15 and over with disability do not do enough physical activity, compared with 52% without disability

Introduction

Health risk factors and behaviours – such as poor diet, physical inactivity, tobacco smoking and excessive alcohol consumption – can have a detrimental effect on a person’s health (see Health status for information on the general health of people with disability).

Many health problems experienced by the Australian population, including by people with disability, can be prevented or reduced by decreasing exposure to modifiable risk factors where possible.

People with disability generally have higher rates of some modifiable health risk factors and behaviours than people without disability. But there can be particular challenges for people with disability in modifying some risk factors, for example, where extra assistance is needed to achieve a physically active lifestyle, or where medication increases appetite or affects drinking behaviours.

What are health risk factors and behaviours?

Health risk factors are attributes, characteristics or exposures that increase the likelihood of a person developing a disease or health disorder. They can be behavioural or biomedical.

Behavioural risk factors are those that individuals have the most ability to modify – for example, diet, tobacco smoking and alcohol consumption.

Biomedical risk factors are bodily states that pose direct and specific risks for health – for example, overweight and obesity and high blood pressure. They are often influenced by health behaviours, such as diet and physical activity, but can also be influenced by genetic, socioeconomic and psychological factors.

Modifying behavioural and biomedical risk factors can reduce a person's risk of developing chronic conditions and result in large health gains by reducing illness and rates of death.

National Health Survey

The data used in this section are from the Australian Bureau of Statistics’ (ABS) National Health Survey (NHS) 2017–18. The NHS was designed to collect information about the health of people, including:

  • prevalence of long-term health conditions
  • health risk factors (such as smoking, overweight and obesity, alcohol consumption and physical activity)
  • demographic and socioeconomic characteristics (ABS 2018a).

The NHS uses the ABS Short Disability Module to identify disability. This produces an estimate of disability known as ‘disability or restrictive long-term health condition’. In this section, people with disability or restrictive long-term health condition are referred to as ‘people with disability’.

The NHS considers that a person has disability if they have one or more conditions which have lasted, or are likely to last, for at least 6 months and restrict everyday activities. Disability is further classified by whether a person has a specific limitation or restriction and then by whether the limitation or restriction applies to core activities or only to schooling or employment.

The level of disability is defined by whether a person needs help, has difficulty, or uses aids or equipment, with 3 core activities – self-care, mobility, and communication – and is reported for mild, moderate, severe, and profound limitation. People who always or sometimes need help with one or more core activities are referred to in this section as ‘people with severe or profound disability’.

The Short Disability Module is not as effective as the ABS Survey of Disability, Ageing and Carers (SDAC) in identifying disability as it overestimates the number of people with less severe forms of disabilities (ABS 2018b). The module provides useful information about the characteristics of people with disabilities relative to those without but is not recommended for use in estimating disability prevalence.

The NHS collects data from people in private dwellings and not from people living in institutional settings, such as aged care facilities. As such, it may underestimate disability for some groups, such as people aged 65 and over, and those with severe or profound disability.

For more information, see the NHS user guide.


Food and nutrition

Food and beverages (our diet) play an important role in overall health and wellbeing. Good dietary choices:

  • contribute to quality of life
  • help maintain a healthy body weight
  • protect against infection
  • reduce the risk of developing chronic conditions.

Health conditions often affected by diet include:

  • overweight and obesity
  • coronary heart disease
  • stroke
  • high blood pressure
  • some forms of cancer
  • type 2 diabetes.

Fruit and vegetables

Australia has national guidelines that provide advice on the amount and types of foods to eat to promote health and wellbeing.

Australian dietary guidelines recommend that adults eat 2 serves of fruit and at least 5 serves of vegetables per day. They recommend, for children and adolescents, depending on age and sex, 1 to 2 serves of fruit and 2½ to 5½ serves of vegetables per day. Guidelines are different for pregnant and breastfeeding women.

The guidelines do not apply to people needing special dietary advice for a medical condition, or to the frail elderly. As such, they should be treated with caution for some people with disability (for example, those with medical conditions requiring a special diet).

See Australian dietary guidelines (NHMRC 2013) for more information.

In the ABS NHS, adequacy of intake (consumption) is based on whether a respondent's reported usual daily fruit or vegetable intake meets or exceeds the NHMRC recommendation. It is collected for people aged 2 and over.

Many people, including those with disability, do not eat enough fruit and vegetables for optimum health and wellbeing. Based on self-reported data, around half (47%) of people aged 2 and over with disability eat less than the recommended serves of fruit and less than the recommended serves of vegetables each day, and are more likely than people without disability (41%) to not meet the guidelines (Figure RISK.1).

Figure RISK.1: Consumption of fruit and vegetables, by disability status, age group and sex, 2017–18

Stacked column chart showing whether people, with and without disability, met national guidelines for fruit and vegetable consumption. The reader can select to display the chart by disability status; by age group 2–64, 65 and over or all ages; by sex; and by whether the person met the guidelines for fruit consumption, for vegetable consumption and for both fruit and vegetable consumption. The chart shows people with and without disability were less likely to meet the guidelines for vegetable consumption than for fruit consumption, regardless of sex, age or level of disability. 

Source data tables: Health risk factors (XLSX, 418 kB)

Males aged 2 and over with disability (53%) are more likely than females aged 2 and over with disability (41%) to not eat enough fruit or vegetables each day.

Younger adults with disability are more likely than older adults with disability not to eat enough fruit or vegetables each day. Around half (53%) of younger adults (aged 18–64) with disability eat less than the recommended serves of fruit or vegetables each day, compared with 39% of older people (aged 65 and over) with disability.

As this is consistent with patterns for the overall population, this likely reflects age rather than disability status (see food and nutrition for more information).

There was little difference by disability group – around half of people aged 2 and over across all disability groups do not eat enough fruit or vegetables (ranging from 45% for those with sensory disability to 52% with psychological disability).

Sugar-sweetened and diet drinks

Australian dietary guidelines recommend limiting intake of discretionary items, such as sugar-sweetened drinks and diet drinks, as they tend to have little nutritional value. Limiting intake may help manage some health conditions.

What are sugar-sweetened and diet drinks?

The ABS NHS includes information on the usual daily consumption, in the previous week, of selected sugar-sweetened drinks and diet drinks.

Sugar-sweetened drinks include soft drinks, cordials, sports drinks or caffeinated energy drinks. This may include soft drinks in ready-to-drink alcoholic beverages but excludes fruit juice, flavoured milk, sugar-free drinks, coffee and hot tea, and alcoholic beverages (that is, beer and wine).

Diet drinks have artificial sweeteners in place of sugar. These include diet soft drinks, cordials, sports drinks or caffeinated energy drinks. This may also include diet soft drinks in ready-to-drink alcoholic beverages but excludes non-diet drinks, fruit juice, flavoured milk, water or flavoured water, coffee and tea flavoured with sugar replacements (for example, the brand Equal), and alcoholic beverages (that is, beer and wine).

Some people, including those with disability, consume sugar-sweetened drinks and diet drinks daily. Based on self-reported data, an estimated:

  • 12% of people aged 2 and over with disability consume sugar-sweetened drinks daily, compared with 7.8% of people without disability
  • 6.3% of people aged 2 and over with disability consume diet drinks each day, compared with 3.5% of people without disability (Figure RISK.2).

Younger people (aged 2–64) with disability are more likely than older people (aged 65 and over) with disability to consume sugar-sweetened and diet drinks daily:

  • 14% compared with 7.0% consume sugar-sweetened drinks daily
  • 6.8% compared with 5.3% consume diet drinks daily (Figure RISK.2).
     

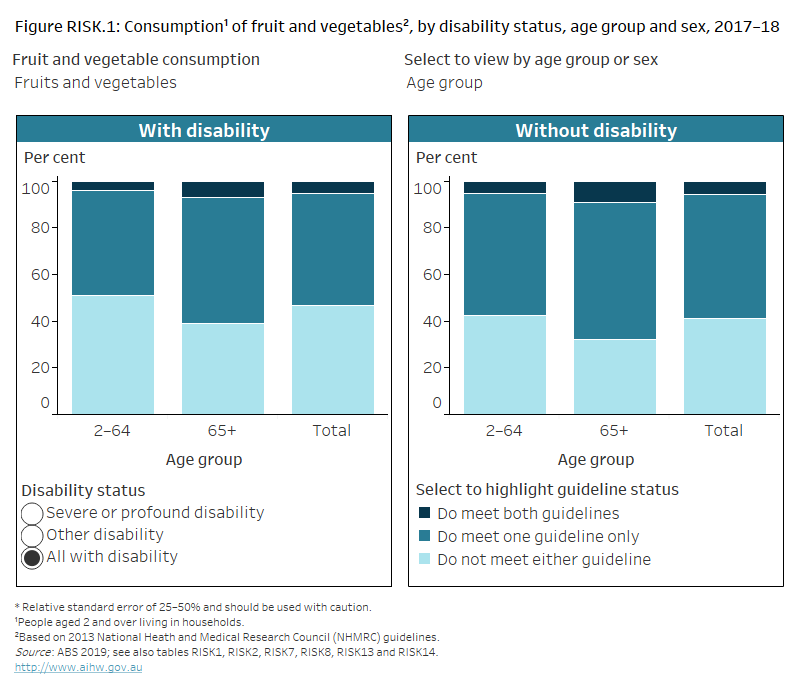
Figure RISK.2: Consumption of sugar-sweetened and diet drinks, by disability status, age group and sex, 2017–18
Stacked column chart showing whether people, with and without disability, daily consume sweetened drinks. The reader can select to display the chart by disability status; by age group 2–64, 65 and over, or all ages; by sex; and by drink type including sugar-sweetened or diet drinks. The chart shows males with disability are more likely (16%) to consume sugar-sweetened drinks daily than females (8%). 

Source data tables: Health risk factors (XLSX, 418 kB)


Weight

Maintaining a healthy weight is important for good health. Not maintaining a healthy weight – such as being underweight, overweight or obese – is a risk factor for lower life expectancy and the development of chronic conditions, such as:

  • cardiovascular disease
  • type 2 diabetes
  • some musculoskeletal conditions
  • some cancers.

What is a healthy weight?

Healthy weight can be measured in several ways, including the commonly used body mass index (BMI) and waist circumference. These are valuable tools at broader population level, but they have some limitations for measuring healthy weight for certain groups of people, including for some people with disability. For example, these measures do not account for the effects of medications taken by, or the long-term health conditions of, some people with disability that may contribute to weight gain or increased waist circumference.

For more information on healthy weight, see overweight and obesity.

Body mass index

BMI is an internationally recognised standard for classifying weight in adults (healthy weight range, underweight, overweight or obese). It is calculated by dividing a person’s weight in kilograms by the square of their height in metres.

However, because BMI does not distinguish between the proportion of weight due to fat or muscle, it is less accurate for assessing healthy weight in some groups, such as for some people with disability. For example, for people with physical disability, muscle wasting may occur and BMI may be slightly lower. This results in a person without weight issues being erroneously classified as underweight or a person with increased body fat being classified as within the healthy weight range.

In the ABS NHS, BMI is calculated for people aged 2 and over. Different cut-offs for BMI categories are used for adults and children. Physical measurement of height and weight is voluntary in the NHS. In 2017–18, 34% of adult participants in the NHS did not have their height and/or weight measured. For these participants, height and weight were imputed (ABS 2018a).

Waist circumference

Waist circumference can be also used to indicate health risk. It measures the amount of fat carried around the middle of the body and can be used along with BMI. In general, a higher waist measurement is associated with an increased risk to health.

However, waist circumference may not be accurate in some situations, including if a person has a medical condition involving enlargement of the abdomen.

In the ABS NHS, waist circumference is measured for men and women and assigned to 3 categories – not at risk, at increased risk, and at substantially increased risk of developing chronic conditions. Different cut-offs are used for men and women. On this page those with increased risk and substantially increased risk are reported on as one group and referred to as 'at increased risk’.

Physical measurement of waist circumference is voluntary in the NHS. In 2017–18, 35% of adult participants in the NHS did not have their waist circumference measured. For these participants, waist circumference was imputed (ABS 2018a).

Based on measured data, people aged 2 and over with disability are more likely to be overweight or obese (72%) than those without disability (55%) (Figure RISK.3). Rates are similar for those with severe or profound disability and others with disability.

Males aged 2 and over with disability (75%) are more likely than females in that age group with disability (69%) to be overweight or obese (Figure RISK.3). As this is consistent with patterns for the overall population, this likely reflects the sex of the person rather than their disability status.

Older people (aged 65 and over) with disability (79%) are more likely than younger people (aged under 65) (68%) to be overweight or obese (Figure RISK.3).

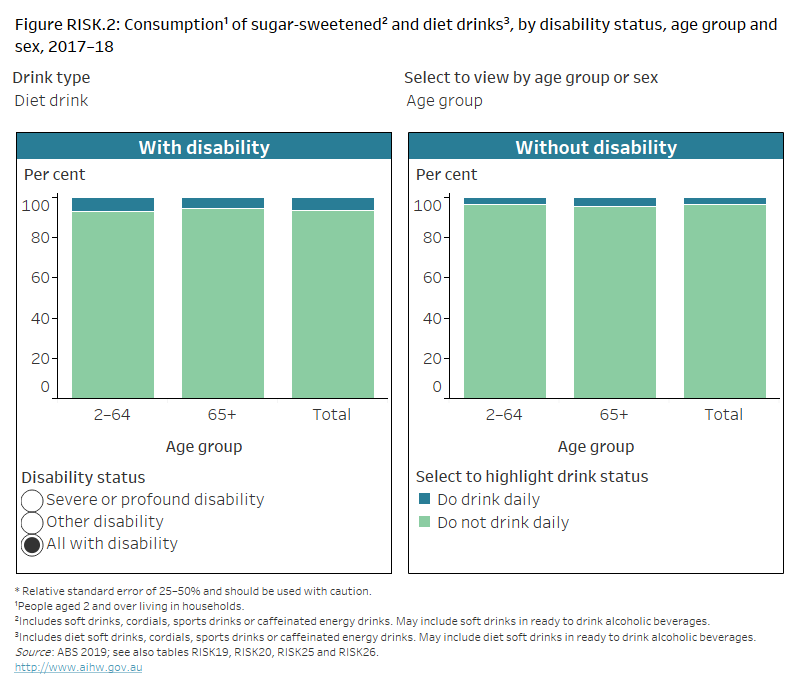
Figure RISK.3: Body Mass Index (BMI), by disability status, age group and sex,
2017–18

Stacked column chart showing 3 categories of body mass index for people with and without disability. The reader can select to display the chart by disability status; by age group 2–64, 65 and over, or all ages; and by sex. The chart shows females with disability are more likely (69%) to be overweight or obese than those without disability (48%).

Source data tables: Health risk factors (XLSX, 418 kB)

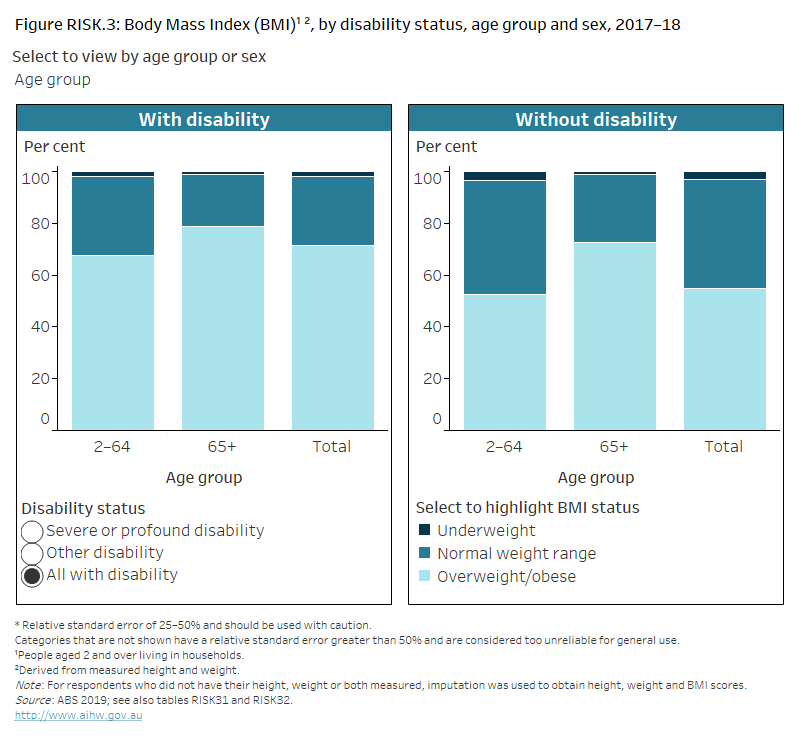
Figure RISK.4: Waist circumference, by disability status, age group and sex,
2017–18

Stacked column chart showing 3 categories of risk of developing chronic conditions, based on waist circumference, for adults with and without disability. The reader can select to display the chart by disability status; by age group 18–64; 65 and over, or all adults; and by sex. The chart shows men with disability are more likely (51%) to have substantially increased risk of developing chronic conditions than those without disability (32%).

Source data tables: Health risk factors (XLSX, 418 kB)

Based on measured waist circumference, adults with disability (76%) are more likely than those without (59%) to have an increased or substantially increased risk of developing chronic conditions (Figure RISK.4).

Women with disability (79%) are more likely than men with disability (73%) to be at increased risk of developing chronic conditions, based on waist circumference (Figure RISK.4). As this is consistent with patterns for the overall population, this likely reflects the sex of the person rather than their disability status.

Older people (aged 65 and over) with disability (85%) are more likely than younger people (aged 18–64) with disability (70%) to be at increased risk based on waist circumference (Figure RISK.4).


Physical activity

Getting enough exercise is an important factor in maintaining good physical and mental health and wellbeing.

What is physical activity?

Physical activity includes just about any movement resulting in energy expenditure, such as:

  • taking part in a deliberate exercise or sport, like running or swimming
  • incidental movement, like hanging out the washing
  • work-related activity, like lifting.

Physical activity and exercise guidelines for all Australians (Department of Health 2021) provide recommendations on:

  • the minimum levels of physical activity required for health benefits
  • the maximum amount of time an adult (aged 18–64) should spend on sedentary behaviours to achieve optimal health outcomes.

There are different recommendations for each age group. This acknowledges that different amounts of physical activity are required at various stages of life for maximum health benefits.

These guidelines are aimed at everyone irrespective of cultural background, gender or ability. However, they may not be appropriate for people with some forms of disability and may not fully take into account that, for some groups of people with disability, such as those with mobility issues, getting enough exercise can be particularly challenging. Physical activity for people with disability or chronic or acute medical conditions is still important, but the type and amount should be appropriate to a person’s ability and based on advice from health-care practitioners.

In the ABS NHS, people aged 15 and over are asked to report the intensity, duration and number of sessions spent on physical activity during the week before the survey (including at work). In 2017–18, the NHS asked about the following types of physical activity:

  • walking for transport
  • walking for fitness, sport or recreation
  • moderate exercise
  • vigorous exercise
  • strength or toning exercises
  • workplace physical activity.

Based on the guidelines, this report defines not enough physical activity as:

  • children and adolescents aged 15–17 who did not complete at least 60 minutes of physical activity per day
  • adults aged 18–64 who did not complete 150 minutes of moderate to vigorous physical activity across 5 or more days in the last week
  • adults aged 65 and over who did not complete at least 30 minutes of physical activity per day on 5 or more days in the last week.

For more information on physical activity, see physical activity.

Many people, including those with disability, are not getting enough exercise. Based on self-reported data, nearly three-quarters (72%) of people aged 15 and over with disability do not do enough physical activity (including at work) for their age, compared with just over half (52%) of those without disability (Figure RISK.5).

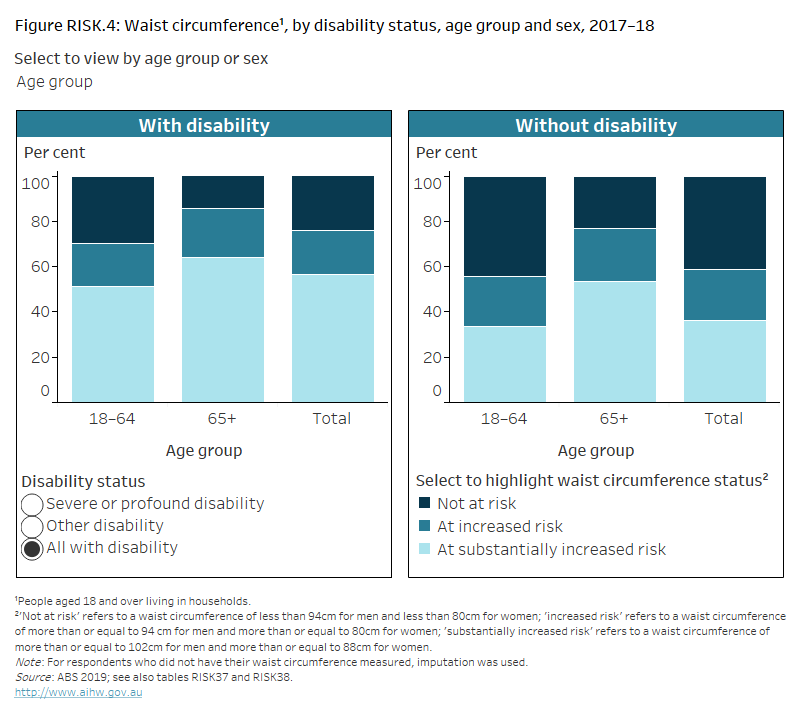
Figure RISK.5: Physical activity, by disability status, age group and sex, 2017–18

Stacked column chart showing whether people with and without disability met national guidelines for physical activity. The reader can select to display the chart by disability status; by age group 15–64, 65 and over, or all ages; and by sex. The chart shows people with disability aged 65 and over are less likely (17%) to meet the physical activity guidelines than those aged 15–64 (35%).

Source data tables: Health risk factors (XLSX, 418 kB)

This was particularly the case for older people with disability:

  • 65% of adults with disability aged 18–64 do not do enough physical activity, compared with 48% without disability
  • 83% of older adults with disability (aged 65 and over) do not do enough physical activity, compared with 62% without disability (ABS 2019).

Most people of both sexes do not get enough exercise, but females aged 15 and over with disability (25%) are slightly less likely than males aged 15 and over with disability (32%) to meet the recommended guidelines (Figure RISK.5). As this is consistent with patterns for the overall population, this likely reflects the sex of the person rather than their disability status.


Blood pressure

High blood pressure – also known as hypertension – is a major risk factor for chronic conditions including stroke, coronary heart disease, heart failure, and chronic kidney disease.

Risk factors for high blood pressure include:

  • poor diet (particularly a high salt intake)
  • obesity
  • excessive alcohol consumption
  • insufficient physical activity.

What is high blood pressure?

Blood pressure is the force exerted by the blood on the walls of the arteries. It is written as systolic/diastolic (for example, 120/80 mmHg, stated as '120 over 80').

In the ABS NHS, measured blood pressure is collected from people aged 18 and over (adults) at the time of their interview. High blood pressure is defined as including any of the following:

  • systolic blood pressure greater than or equal to 140 mmHg
  • diastolic blood pressure greater than or equal to 90 mmHg
  • receiving medication for high blood pressure.

Uncontrolled high blood pressure is defined as measured systolic blood pressure of 140 mmHg or more, or diastolic blood pressure of 90 mmHg or more, irrespective of the use of blood pressure medication. It increases the risk of serious health problems.

Controlled high blood pressure refers to people taking blood pressure medications who have a normal blood pressure reading.

Physical measurement of blood pressure is voluntary in the NHS. In 2017–18, 32% of adult participants in the NHS did not have their blood pressure measured. For these participants, blood pressure was imputed (ABS 2018a).

Based on measured data, among adults with disability:

  • 54% (more than half) have hypertension, comprising
    • 32% with uncontrolled (or high) blood pressure
    • 21% with controlled blood pressure.

This is far higher than for adults without disability, of whom:

  • 27% have hypertension, comprising
    • 20% with uncontrolled blood pressure
    • 7.5% with controlled blood pressure (Figure RISK.6).

There was little difference by level of disability or sex but older adults (aged 65 and over) with disability (43%) are more likely than younger adults (aged 18–64) with disability (26%) to have uncontrolled blood pressure, similar to the pattern among those without disability.

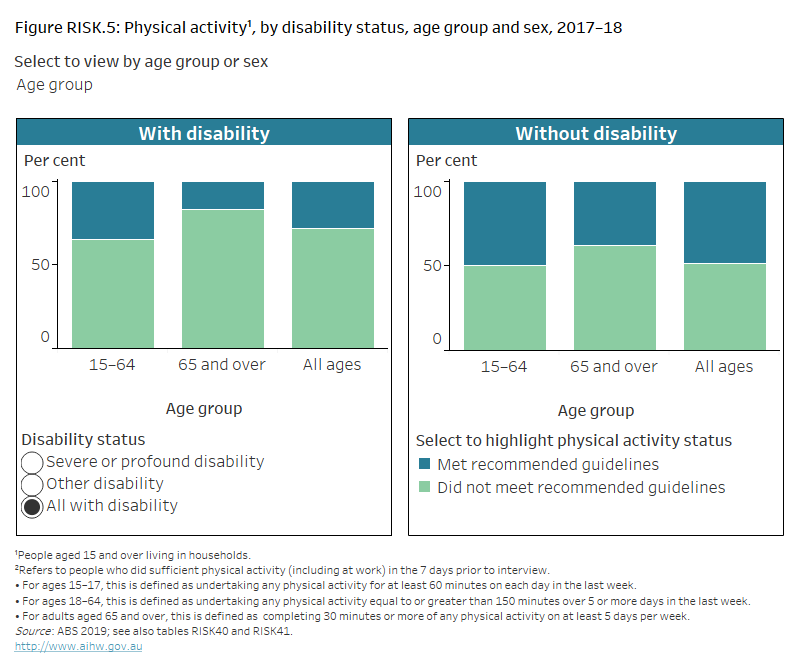
Figure RISK.6: Blood pressure status, by disability status, age group and sex,
2017–18

Column chart showing 3 categories of blood pressure status for adults with and without disability. The reader can select to display the chart by blood pressure category, including controlled blood pressure, uncontrolled blood pressure and all with hypertension, by disability status; by age group 18–64, 65 and over, or all adults; and by sex. The chart shows adults with disability aged 65 and over are more likely (78%) to have hypertension than those aged 18–64 (38%).

Source data tables: Health risk factors (XLSX, 418 kB)


Tobacco smoking

Tobacco smoking is an important cause of preventable ill health and death in Australia. It is a leading risk factor for the development of many chronic conditions and premature death.

Health conditions often affected by tobacco smoking include many types of cancer, respiratory disease and heart disease.

What is tobacco smoking?

Tobacco smoking is the smoking of tobacco products, including packet cigarettes, roll-your-own cigarettes, cigars and pipes.

In the ABS NHS, people aged 15 and over are asked:

  • if they currently smoke
  • if they were ex-smokers or had never smoked
  • about the frequency and quantity of their smoking.

Because daily smoking presents the greatest health risk, the results presented on this page relate to people who were daily smokers at the time of the survey.

For more information, see smoking.

About 1 in 6 (18%) people aged 15 and over with disability smoke daily (based on self‑reported data) (Figure RISK.7). They are more likely to do so than people without disability (12%).

Males aged 15 and over with disability (22%) are more likely to smoke daily than their female counterparts (15%) (Figure RISK.7). As this is consistent with patterns for the overall population, this likely reflects the sex of the person rather than their disability status.

Younger people (aged 15–64) with disability (25%) are more likely to smoke daily than their older counterparts (aged 65 and over) (8.2%) (Figure RISK.7).

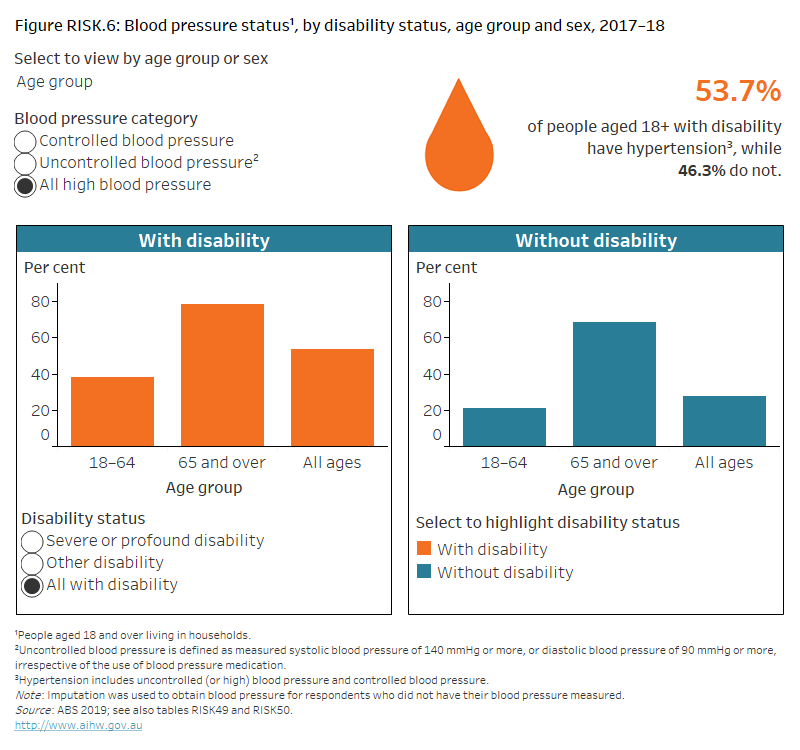
Figure RISK.7: Daily tobacco smoking status, by disability status, age group and sex, 2017–18

Stacked column chart showing whether people with and without disability currently smoke daily. The reader can select to display the chart by disability status; by age group15–64, 65 and over, or all ages; and by sex. The chart shows people with disability aged 15–64 are more likely (25%) to smoke daily than those without disability (13%).

Source data tables: Health risk factors (XLSX, 418 kB)


Alcohol consumption

Harmful levels of alcohol consumption are a major health issue and are associated with increased risk of chronic conditions and injury.

What is risky alcohol consumption?

Alcohol consumption refers to the consumption of drinks containing ethanol, commonly referred to as alcohol. The quantity, frequency or regularity with which alcohol is drunk provides a measure of the level of alcohol consumption.

The National Health and Medical Research Council’s (NHMRC) guidelines for alcohol consumption provide advice on reducing risks to health from drinking alcohol. The 2017–18 National Health Survey (NHS) used 2009 guidelines which defined alcohol-related risk as:

  • lifetime risk for alcohol consumption is more than 2 standard drinks per day on average
  • single occasion risk for alcohol consumption is more than 4 standard drinks on a single occasion.

In 2017–18, the NHS collected information about alcohol consumption for people aged 15 and over. It should be noted that the above definition of risky alcohol consumption is for people aged 18 and over, and that the current guidelines state that children and young people under 18 years of age should not be drinking alcohol.

For more information, see alcohol.

Based on self-reported data, 1 in 7 (14%) people aged 15 and over with disability consume, on average, more than 2 standard drinks of alcohol per day, increasing their lifetime risk of harm from alcohol consumption (Figure RISK.8). This compares with 1 in 6 (16%) people aged 15 and over without disability.

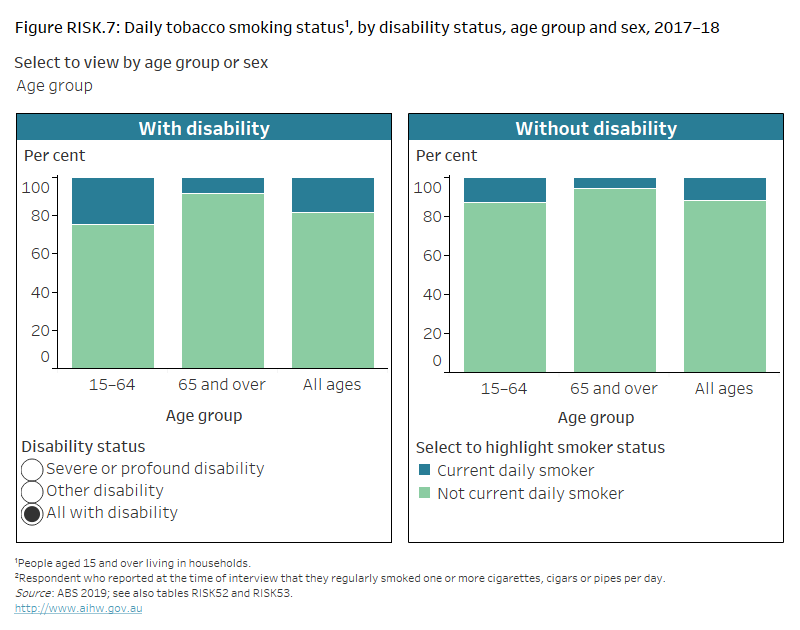
Figure RISK.8: Lifetime alcohol risk, by disability status, age group and sex, 2017–18

Column chart showing the proportion of people with and without disability who exceed the lifetime alcohol risk guidelines. The reader can select to display the chart by disability status; by age group 15–64, 65 and over, or all ages; and by sex. The chart shows females with severe or profound disability are less likely (3%) to drink more than 2 standard drinks per day than those without disability (9%).

Source data tables: Health risk factors (XLSX, 418 kB)

Around 1 in 3 (31%) people aged 15 and over with disability consumed more than 4 standard drinks of alcohol on a single occasion in the past year, increasing their risk of alcohol-related injury arising from that occasion (Figure RISK.9). This compares with 44% of people aged 15 and over without disability.

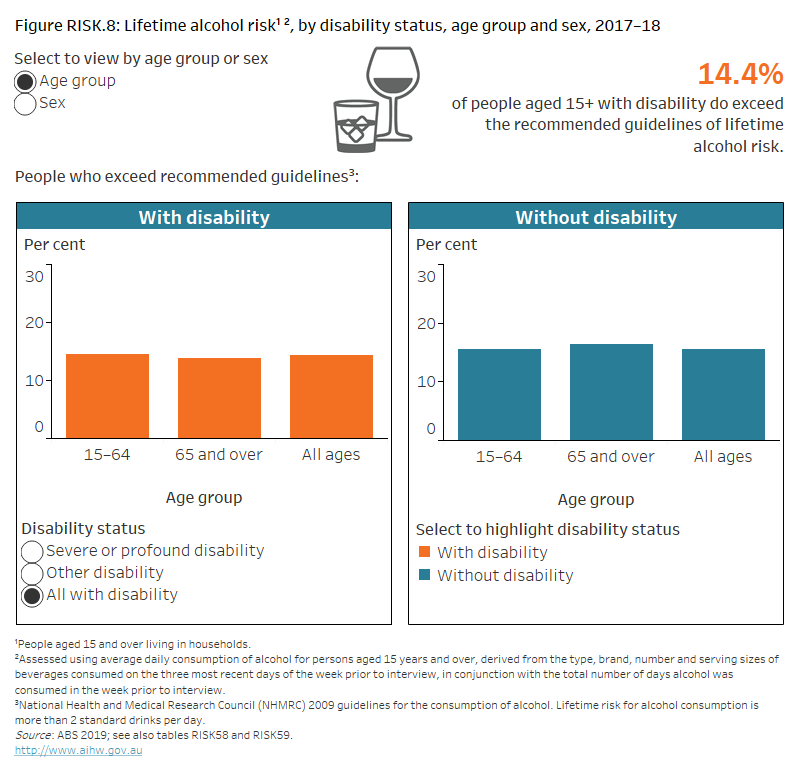
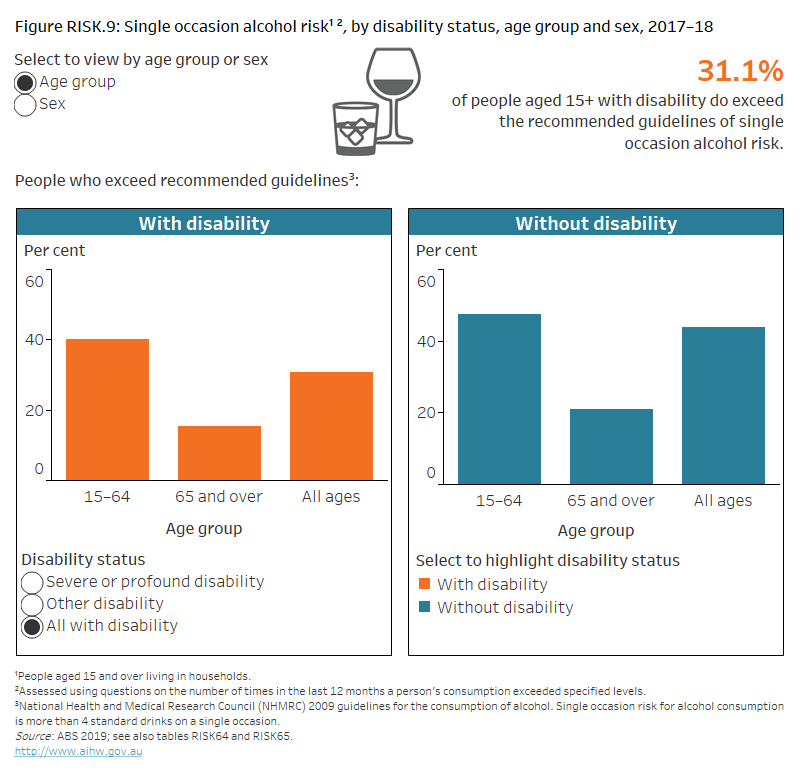
Figure RISK.9: Single occasion alcohol risk, by disability status, age group and sex, 2017–18

Column chart showing the proportion of people with and without disability who exceed the single occasion alcohol risk guidelines. The reader can select to display the chart by disability status; by age group 15–64, 65 and over, or all ages; and by sex. The chart shows people with disability aged 15–64 are less likely (40%) to drink at risky levels on a single occasion than those without disability (48%).

Source data tables: Health risk factors (XLSX, 418 kB)

People aged 15 and over with severe or profound disability are less likely to drink at risky levels than those with other disability:

  • 8.0% consumed more than 2 standard drinks of alcohol per day on average, compared with 16% (Figure RISK.8)
  • 19% consumed more than 4 standard drinks of alcohol on a single occasion, compared with 34% (Figure RISK.9).

Males aged 15 and over with disability are far more likely than their female counterparts to drink at risky levels:

  • 23% consumed more than 2 standard drinks of alcohol per day on average, compared with 7.3% (Figure RISK.8)
  • 43% consumed more than 4 standard drinks of alcohol on a single occasion, compared with 21% (Figure RISK.9).

As this is consistent with patterns for the overall population, this likely reflects the sex of the person rather than their disability status.

For lifetime alcohol risk, there is little difference between younger (aged 15–64) and older (aged 65 and over) people with disability (15% compared with 14%). However, younger people with disability are far more likely than older people with disability to drink at risky levels on a single occasion (40% compared with 16%) (figures RISK.8 and RISK.9). As this is consistent with patterns for the overall population, this likely reflects age rather than disability status.

Where can I find out more?

Data tables for this report.

ABS Disability, Ageing and Carers, Australia: Summary of Findings, 2018.

Health risk factors and behaviours for the general Australian population – Behaviours & risk factors.

ABS National Health Survey: First Results, 2017–18.

Dietary guidelines – National Health and Medical Research Council (NHMRC).