Living arrangements
Home ownership
In 2018, almost two-thirds (64%) of people with disability were living in owner-occupied housing, either with (22%) or without (41%) a mortgage.
Public housing
In 2018, 16% of people with disability living in rental accommodation were renting from a state or territory housing authority (compared with 4% without disability).
Living alone
Non-dependent people with disability are more likely than those without disability to live alone (24% compared with 10% in 2018).
On this page:
Introduction
Living arrangements in this section refer to:
- the type of tenure a person has
- who they live with
- their relationship within the household
- their type of landlord (for those who have a landlord).
Data note
Data on this page are largely sourced from the Australian Bureau of Statistics' (ABS) 2018 Survey of Disability, Ageing and Carers (SDAC). For more information about the SDAC, including the concepts of disability, disability severity, disability groups, and remoteness categories used by the SDAC, see ‘Data sources’.
Unless otherwise indicated, all data on this page refer to 2018.
Household relationships
This section provides separate descriptions of the housing situation for two types of household relationships:
- dependent children and students
- non-dependent people.
In the ABS SDAC, housing information – including tenancy and landlord type – is recorded for an income unit. Dependent children are considered part of the same income units as their parents. In the SDAC, dependent children include:
- all children under 15 years
- those people aged 15–24 who are full-time students, live with at least one parent, and do not live with their own partner or child.
The housing situation for the dependent child is the same as for the parent (or other person) they depend upon. For example, a dependent student may have ‘owner’ as their tenure type even though someone else in their income unit is the owner. As a result, a tenure type of owner will not necessarily be the owner of the dwelling.
Non-dependent people are defined by their household relationship to the main respondent being interviewed in the survey. These include: husband, wife or partner, lone parent, non-dependent child, other related person, unrelated person, and lone person (ABS 2019a). A non-dependent child is a person aged 15 or over who is not a full-time student aged 15–24, lives with at least one parent and does not live with their own partner or child.
Being non-dependent is not the same as being independent. Non-dependent refers to a person who is not part of their parent's or carer's income unit. This includes anyone aged 15–24 who is not a full-time student and those who may have other limitations or care needs and are not necessarily independent across all contexts.
Housing tenure
Tenure type refers to whether a dwelling is rented or owned (with or without a mortgage). Looking at tenure type can help monitor housing security, mobility issues and home ownership trends.
Tenure type
Almost two-thirds (64% or 2.7 million) of people with disability own their home. They belong to an income unit with ‘owner’ as tenure type, either with a mortgage (22% or 939,000) or without (41% or 1.7 million) (ABS 2019b).
Close to one-third (29% or 1.2 million) of people with disability are renting (39% or 949,000 aged under 65; 14% or 256,000 aged 65 and over). A further 5.9% (or 248,000) live rent-free (7.4% or 179,000 aged under 65; 3.9% or 70,000 aged 65 and over) (ABS 2019b).
People with severe or profound disability are:
- less likely to own their own home – 56% (or 692,000) compared with 67% (or 2.0 million) of people with other disability
- more likely to rent – 32% (or 397,000) compared with 27% (or 807,000)
- more likely to live rent free – 9.2% (or 114,000) compared with 4.6% (or 136,000) (ABS 2019b).
Older people (aged 65 and over) with disability (79% or 1.4 million) are more likely than those aged 25–64 (55% or 971,000) to own their home (ABS 2019b). Considering that the likelihood of disability increases with age (see ‘Prevalence of disability’), some older people with disability who are home owners may have bought their house before onset of disability.
Dependent children and students
Dependent children (aged 0–14) and dependent students aged 15–24 share the tenure type with their income unit.
Dependants with disability are more likely than those without disability to live in households with less secure tenure types:
- 6 in 10 (59% or 278,000) dependants with disability live in a home that is owned by someone in their income unit, compared with 66% (or 3.7 million) without disability
- almost 4 in 10 (38% or 182,000) live in a home that is rented, compared with 32% (1.8 million) (ABS 2019b).
About 4 in 10 (40% or 117,000) young people aged 15–24 with disability live in their household as a dependent student. A further 4 in 10 (39% or 115,000) are a non-dependent child in their household, and the remaining 20% (or 59,000) have another household relationship (such as living on their own as a partner, parent, or lone person) (ABS 2019b). Young people aged 15–24 without disability are less likely to live in their households as a non-dependent child (26% or 727,000) and more likely to have ‘other’ (husband, wife or partner, lone parent, other related person, unrelated person, and lone person) as their household relationship (30% or 838,000) than young people with disability (ABS 2019b).
The most common living arrangement for young people aged 15–24 with disability was living as a dependent student in a home that was owned by someone else in their income unit (27% or 80,000), followed by being a non-dependent child living rent free (23% or 68,000) (ABS 2019b). For young people without disability, the most common living arrangement was also a dependent student in a home that was owned by someone else in their income unit (34% or 973,000); however, the second most common was ‘other’ householder paying rent (24% or 678,000) (ABS 2019b).
Non-dependent people aged 15 and over
Non-dependent people with disability aged 25–64 (55% or 971,000) and aged 65 and over (79% or 1.4 million) are less likely than those without disability (61% or 6.8 million and 86% or 1.7 million respectively) to own their home. Of young people (aged 15–24) with disability, 6.3% (or 11,000) are in the owner category. This is similar to those without disability (4.9% or 76,000) (Figure LIVING.1).
Figure LIVING.1: Tenure type for non-dependent people, by disability status and broad age group, 2018
The chart shows that, for ages 25–64 and 65 and over, the rates of home ownership are lower for people with disability than those without disability.
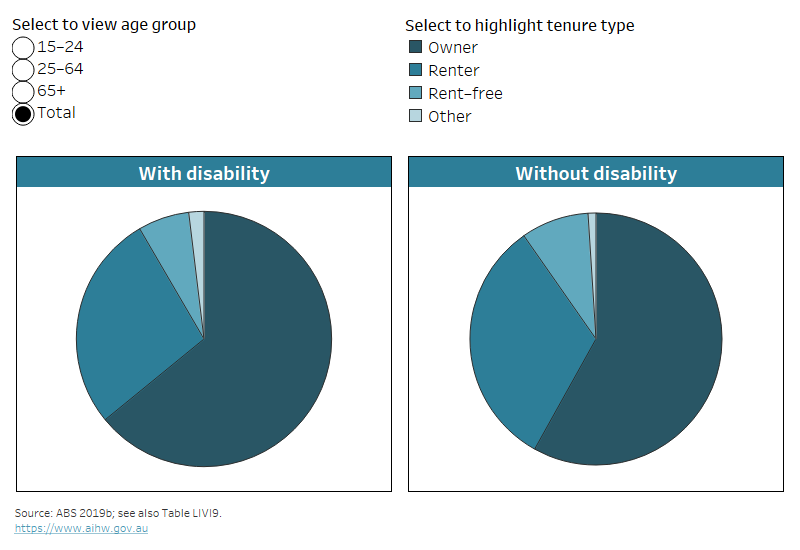
Notes:
- Data are for non-dependent people (aged 15 and over) living in households.
- ‘Owner’ includes owners with and without mortgage.
- ‘Other’ includes life tenure schemes, rent/buy (shared equity schemes), assisting with expenses and other.
- The category ‘Other’ for people aged 15–24 with disability is not shown, as it has a relative standard error greater than 50% and is considered too unreliable for general use.
Source data tables: Data tables – Living arrangements. View data tables
Older non-dependent people (aged 65 and over) with and without disability are more likely to own their home; however, older people without disability have higher home ownership rates than those with disability (Figure LIVING.2). The decrease in renting as people age is more gradual for those with disability than without disability. For example, non-dependent people aged 55–64 with disability (26% or 180,000) are nearly twice as likely as those without disability (14% or 294,000) to be renting (Figure LIVING.2).
Figure LIVING.2: Tenure type for non-dependent people, by disability status and age group, 2018
The chart shows that, for people with and without disability, rates of home ownership increase for older age groups, while renting drops after age 34.
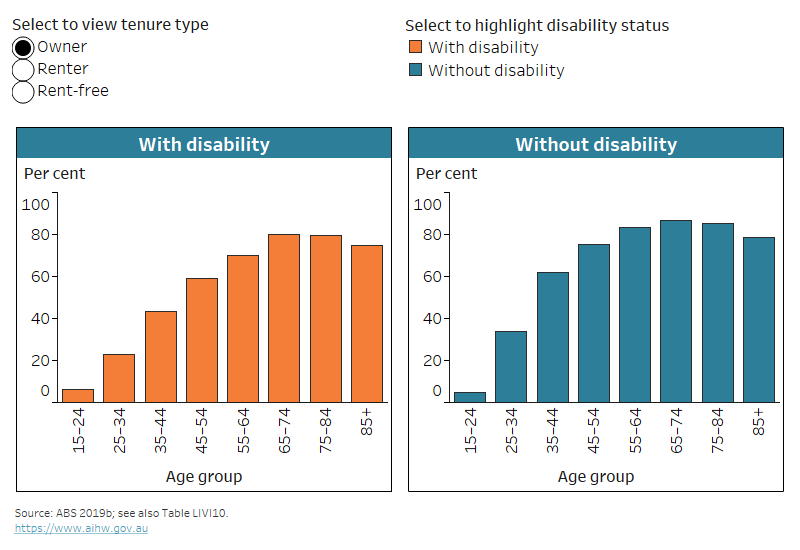
Notes:
* Relative standard error of 25–50% and should be used with caution.
- Data are for non-dependent people (aged 15 and over) living in households.
- ‘Owner’ includes owners with and without mortgage.
- A small proportion of people with other tenure types, such as life tenure schemes, rent/buy (shared equity schemes), assisting with expenses and other, are excluded from this figure.
Source data tables: Data tables – Living arrangements. View data tables
The proportion of non-dependent people who own their home varies by disability group. Non-dependent people aged 15–64 with sensory disability (53% or 209,000) or physical disability (53% or 667,000) are more likely to own their home than those with head injury, stroke or acquired brain injury (37% or 60,000), psychosocial disability (34% or 200,000), or intellectual disability (22% or 62,000) (ABS 2019b).
The relationships people have within their households vary between those with and without disability (Figure LIVING.3), by disability group and by tenure type. For example:
- Non-dependent people with disability aged 15–64 are more likely than those without disability to live alone or as single parents, and less likely to live with a husband, wife or partner
- 52% (or 1.0 million) lived with a husband, wife or partner, compared with 67% (or 8.5 million) without disability
- 19% (or 362,000) lived alone, compared with 8.4% (or 1.1 million)
- 8.5% (or 165,000) were lone parents, compared with 5.4% (or 685,000).
- Non-dependent people aged 15–64 with intellectual disability are most likely to be a non-dependent child (39% or 107,000), while people with sensory or physical disability are most likely to live with a husband, wife or partner (53% or 210,000 and 53% or 674,000 respectively). Of those with head injury, stroke or acquired brain injury, 41% (or 66,000) live with a husband, wife, or partner; for those with psychosocial disability the corresponding proportion is 34% (or 201,000) (ABS 2019b).
- Non-dependent people living with a husband, wife or partner are the most likely to own their home (Figure LIVING.4).
Figure LIVING.3: Household relationships for non-dependent people, by disability status and age group, 2018
The chart shows that a higher proportion of people with disability live alone compared with those without disability (24% and 10%, respectively).
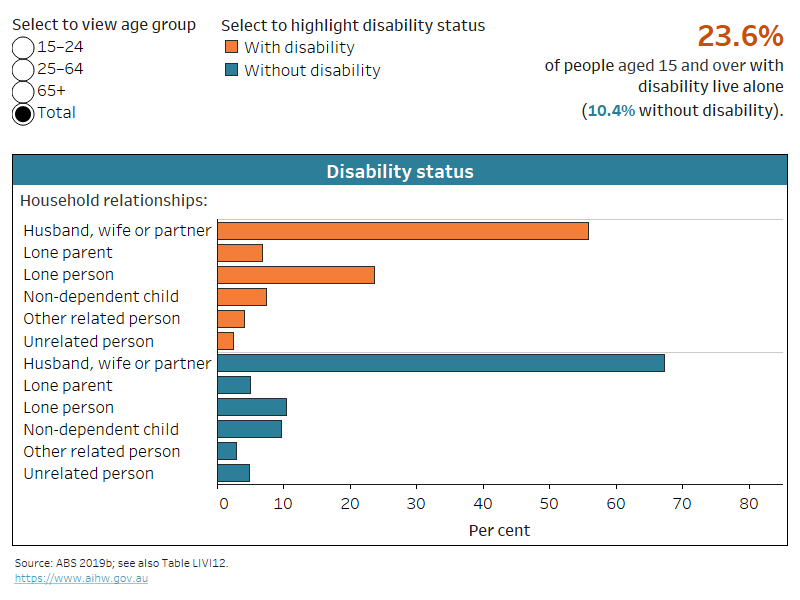
Notes:
* Relative standard error of 25–50% and should be used with caution.
- Data are for non-dependent people (aged 15 and over) living in households.
Source data tables: Data tables – Living arrangements. View data tables
Figure LIVING.4: Home ownership for non-dependent people, by disability status, age group and household relationship, 2018
The chart shows that rates of home ownership are higher for partnered people with and without disability, than for other household relationships.
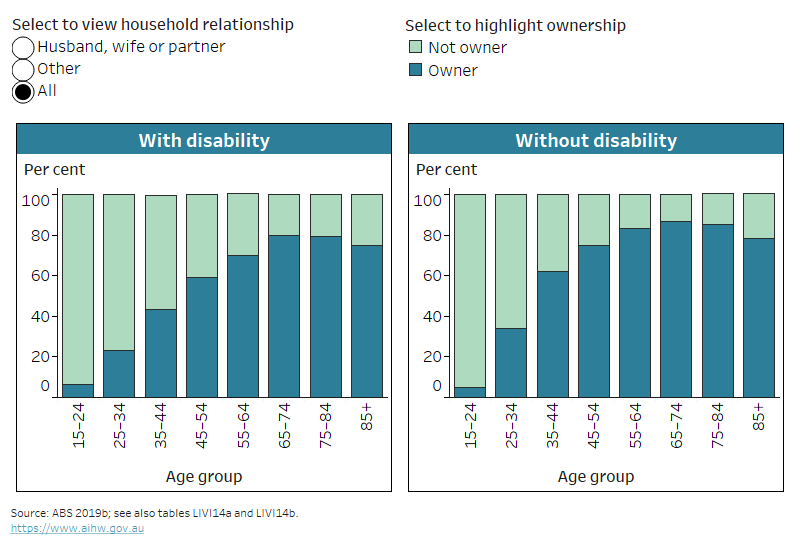
Notes:
* Relative standard error of 25–50% and should be used with caution.
- Data are for non-dependent people (aged 15 and over) living in households.
- ‘Owner’ includes owners with and without mortgage.
- ‘Other’ relationship includes lone parent, non-dependent child, other related person, unrelated person, and lone person.
- Proportion of home owners among people with disability and ‘other’ household relationship aged 15–24 is not shown, as it has a relative standard error greater than 50% and is considered too unreliable for general use.
Source data tables: Data tables – Living arrangements. View data tables
Landlords
Who a person rents from provides additional information on housing security for people with disability. For example, renting from a state or territory housing authority may provide more security than renting in the private rental market. It may also hint at rental affordability and access issues, with the private rental market generally more competitive and expensive than social housing schemes. For more information on social housing, see ‘Housing assistance’.
Rental affordability
Rental affordability, especially in the private rental market, can be an issue for people with disability. For example:
- 33% of income units receiving Commonwealth Rent Assistance (CRA) (at June 2022) who had at least one member receiving the Disability Support Pension (DSP) were in rental stress after receipt of CRA (that is, paid more than 30% of their gross household income on rent); without CRA, 74% of these income units would be in rental stress. This compares with 44% in rental stress after receipt of CRA and 72% in rental stress without CRA for all income units receiving CRA (AIHW 2023).
- An Anglicare report on affordable housing found that only 0.1% (or 66) of 45,895 rental properties advertised in Australia on a selected weekend in March 2023 were affordable and appropriate for single people aged 21 and over receiving the DSP, compared with 0.8% (or 345) for a single person on minimum wage (Anglicare 2023).
The most common types of landlords for people with disability, living in households who have a landlord, are:
- real estate agent – 42% (or 525,000) compared with 63% (or 4.2 million) without disability
- state or territory housing authority – 16% (or 198,000) compared with 4.1% (or 272,000)
- parent or other relative living in the same dwelling – 12% (or 150,000) compared with 8.1% (or 531,000)
- other person not in same dwelling – 12% (or 148,000) compared with 12% (or 777,000) (ABS 2019b).
This suggests that, while many people with disability do rent in the private rental market, they are much less likely to do so than people without disability. They are far more likely to be living in social housing.
Compared with others with disability, people with severe or profound disability are:
- less likely to have a real estate agent as their landlord – 36% (or 149,000) compared with 46% (or 377,000)
- more likely to have a parent or other relative in the same dwelling as their landlord – 19% (or 78,000) compared with 8.6% (or 71,000)
- slightly more likely to have a state or territory housing authority as their landlord – 17% (or 71,000) compared with 15% (or 127,000) (ABS 2019b).
Those with disability aged under 65 living in Outer regional and remote areas are less likely (31% or 32,000) to have a real estate agent as their landlord than those living in Major cities (48% or 309,000) or Inner regional areas (48% or 107,000) (ABS 2019b).
Dependent children and students
The landlord type of dependent children and students is that of the parent (or other person) they depend upon.
Dependent children or students with disability, living in households who have a landlord, are:
- less likely (58% or 107,000) to rent from a real estate agent (compared with 67% or 1.2 million without disability)
- more likely (11% or 20,000) to rent from a state or territory housing authority (compared with 6.2% or 110,000) (ABS 2019b).
Non-dependent people aged 15 and over
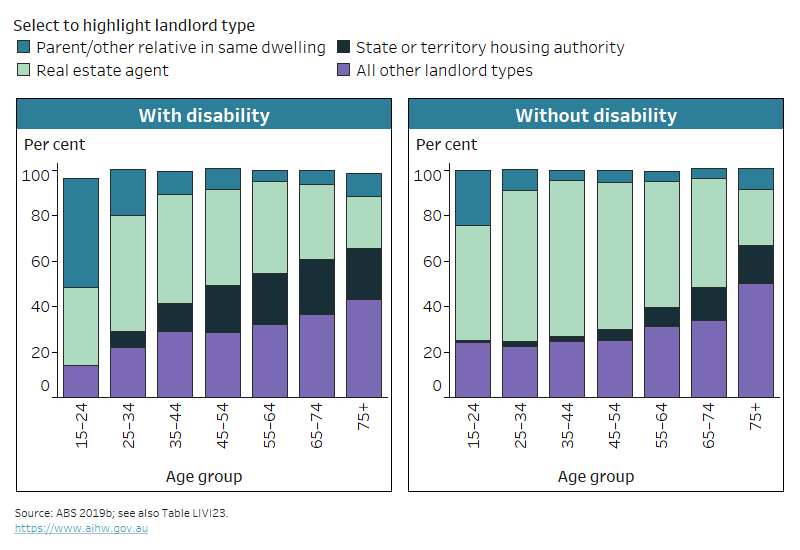
The type of landlord a person has varies by age (Figure LIVING.5). For example, non‑dependent people with disability aged 25–34 most commonly rent from a real estate agent, but, from that age on, the proportions renting from a real estate agent decline, while renting from a state or territory housing authority becomes more common.
Figure LIVING.5: Landlord type for non-dependent people, by disability status and age group, 2018
The chart shows that a higher proportion of people with disability rent from a state or territory housing authority than those without disability.
Notes:
* Relative standard error of 25–50% and should be used with caution.
- Data are for non-dependent people (aged 15 and over) living in households.
- Proportion of people with disability aged 15–24 renting from state or territory housing authority is not shown, as it has a relative standard error greater than 50% and is considered too unreliable for general use.
- Figures are rounded and discrepancies may occur between sums of the component items and totals because of ABS confidentiality and perturbation processes.
Source data tables: Data tables – Living arrangements. View data tables
The type of landlord differs by disability group for non-dependent people aged 15–64 living in households, who have a landlord:
- Those with physical disability (45% or 224,000) or sensory disability (42% or 63,000) are more likely to have a real estate agent as their landlord than those with psychosocial disability (33% or 100,000), head injury, stroke or acquired brain injury (32% or 27,000), or intellectual disability (26% or 40,000).
- Those with intellectual disability (30% or 46,000) or psychosocial disability (22% or 67,000) are more likely to have a parent or other relative living in the same dwelling as their landlord than those with sensory disability (14% or 22,000) or physical disability (12% or 59,000) (ABS 2019b).
Economic resources in area of residence
Data note
Data in this section are sourced from the 2021 Household, Income and Labour Dynamics in Australia (HILDA) Survey. For more information about HILDA, including the concepts of disability, disability severity, disability groups, and remoteness categories used by HILDA, see ‘Data sources’.
Index of Economic Resources
The Index of Economic Resources is one of the Socio-Economic Indexes for Areas (SEIFA) and focuses on the financial aspects of relative socioeconomic advantage and disadvantage (ABS 2013). A low score indicates a relative lack of access to economic resources in general. For example, an area may have a low score if there are:
- many households with low income, or many households paying low rent
- few households with high income, or few owned homes.
For the AIHW analysis of HILDA 2021 data, people living in an area with an Index of Economic Resources in the lowest 30% of areas are referred to as people living in disadvantaged areas.
People with disability aged 15–64 are more likely to live in economically disadvantaged areas than those without disability – 33% compared with 24% in 2021. This was especially true for those with severe or profound disability, with 43% living in disadvantaged areas (DSS and MIAESR 2022). In 2021, the proportions of people with disability living in disadvantaged areas did not differ between males and females, or by age group.
People aged 15–64 with disability in Major cities were less likely (29%) to live in disadvantaged areas than those in Inner regional areas (37%), or Outer regional, remote and very remote areas (46%). Among people aged 15–64 with intellectual disability or sensory disability, 41% lived in disadvantaged areas, compared with 34% of people with physical and 32% of people with psychosocial disability (DSS and MIAESR 2022).
ABS (Australian Bureau of Statistics) (2013) Census of Population and Housing: Socio-Economic Indexes for Areas (SEIFA), Australia, 2011, ABS cat. no. 2033.0.55.001, ABS, accessed 15 October 2021.
ABS (2019a) Disability, ageing and carers, Australia: summary of findings, 2018, ABS, accessed 30 July 2021.
ABS (2019b) Microdata: disability, ageing and carers, Australia, 2018, ABS cat. no. 4430.0.30.002, ABS, AIHW analysis of TableBuilder data, accessed 21 September 2020.
AIHW (Australian Institute of Health and Welfare) (2023) Australian Government Housing Data Set 2022, AIHW customised data request, AIHW.
Anglicare Australia (2023) Rental Affordability Snapshot – national report 2023, Anglicare Australia, accessed 11 September 2023.
DSS (Department of Social Services) and MIAESR (Melbourne Institute of Applied Economic Social Research) (2022) The Household, Income and Labour Dynamics in Australia (HILDA) Survey, General Release 21, wave 21, doi:10.26193/KXNEBO, ADA Dataverse, V3, AIHW analysis of unit record data, accessed 7 December 2022.