Crime rates for sexual assault
Incidents of sexual assault may be reported to police. Examining crime rates for sexual assault makes it possible to compare how often police are engaged in response to incidents of sexual assault over time and across different population groups in the Australian community. Data on crime rates for sexual assault in Australia are drawn from the ABS Recorded Crime - Victims collection, which is based on crimes reported to police in each state and territory.
The visualisation below allows users to explore the number and rate of sexual assaults recorded by police per 100,000 people since 2010, by sex of victim and the state and territory the sexual assault was recorded, over time. Between 2010 and 2021, sexual assault victimisation rates were consistently higher for females compared to males. During this time the victimisation rate for sexual assault for females increased by 43% from 143.8 to 205.4 per 100,000 females with a 15% increase between 2020 and 2021. Rates also increased by 31% for males between 2010 and 2021 from 26.1 to 34.1 per 100,000. This increase is generally consistent across jurisdictions, although the rate and pattern of increase varied. Changes in crime rates may be due to changes in reporting behaviour, increased awareness about forms of violence, changes to police practices, and/or an increase in incidents.
Victims of sexual assault, by sex and location, 2010 to 2021
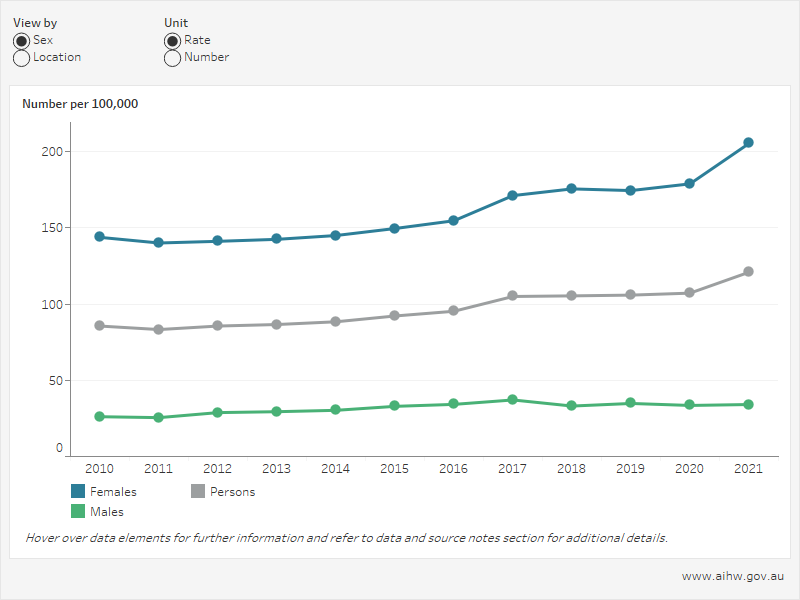
Source data: Crime rates for sexual assault tables (87KB XLSX)
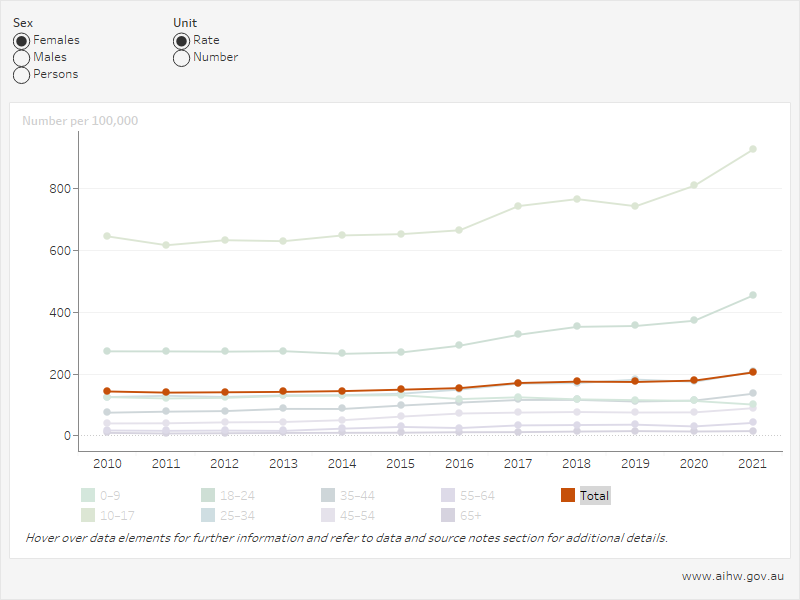
Examining the age profile of victims of sexual assault provides insight into which groups are most affected by sexual assault.
The visualisation below allows users to explore the number and rate of sexual assaults recorded by police per 100,000 Australians since 2010, by sex of victim and age group, over time. Between 2010–2021, the victimisation rate for sexual assault increased across all age groups, except 0–9 years. Between 2020 and 2021, there was an almost 13% increase amongst those aged 10–17 and over 21% increase amongst those aged 18–24.
Victims of sexual assault, by age at report, 2010 to 2021
The visualisation below shows the number and rate of Aboriginal and Torres Strait Islander victims of sexual assault per 100,000 Indigenous Australians, over time, for states and territories with available data. Between 2010 and 2021, Indigenous victimisation rates for sexual assault varied between states and territories and over time. Since 2018, Indigenous rates for sexual assault were lowest for the Northern Territory, compared with New South Wales, Queensland and South Australia.
Indigenous victims of sexual assault for select state and territories, 2010 to 2021
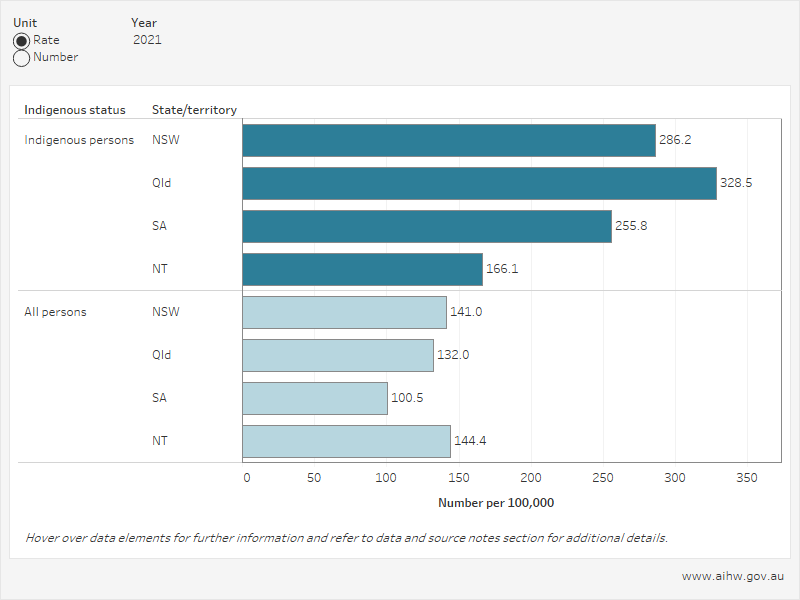
Source data: Crime rates for sexual assault tables (87KB XLSX)
The visualisation below allows users to explore the number and proportion of sexual assault victims, by type of assault, time to report, setting where crime occurred, use of weapon, and outcome of investigation. Consistently over time, most sexual assaults were aggravated sexual assaults, and most did not involve the use of a weapon. Sexual assaults in a residential setting were consistently more common than in the community.
Characteristics of sexual assault, 2010 to 2021
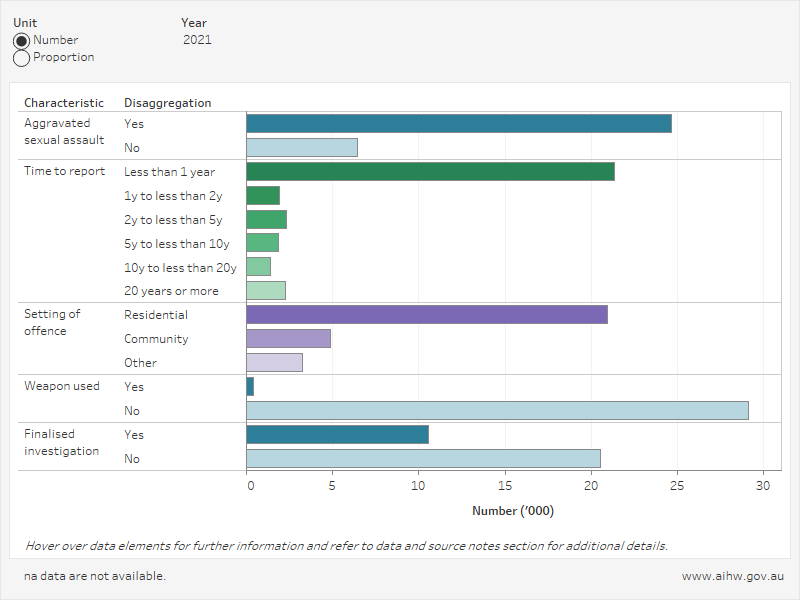
Source data: Crime rates for sexual assault tables (87KB XLSX)
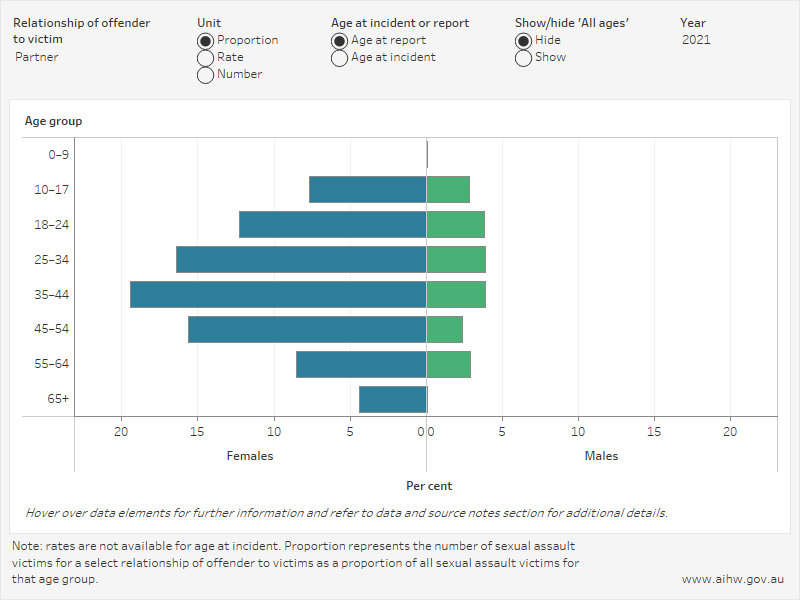
The visualisation below allows users to explore the number and proportion of sexual assaults recorded by police, by sex of victim, relationship to offender, and across age groups (at report or incident). In 2021, the sexual assault offender was most commonly a family member for males and females aged 0–9 at the time of the incident. For all other male age groups at incident, the offender was most commonly a known person who was not a family member. For other female age groups, the offender was most commonly a family member for those in the middle age groups (25–34 to 45–54) and a known person who was not a family member for the remaining age groups.
Sexual assaults by relationship of offender to victim, 2020 and 2021
Source data: Crime rates for sexual assault tables (87KB XLSX)
Notes
- Victims data does not reflect unique people. If a person is the victim of multiple incidents recorded by police throughout the reference period, each unique incident is counted. Where incidents include multiple offences that fall under different ANZSOC offence categories, each different offence category is counted once per incident.
- Sexual assault refers to any physical contact, or intent of contact, of a sexual nature directed toward another person where that person does not give consent, gives consent as a result of intimidation or deception, or consent is unable to be given because of youth, temporary/permanent (mental) incapacity or familial relationship. Sexual assault includes aggravated sexual assault and non-aggravated sexual assault.
- Total for age-specific visualisations includes victims for whom age was not specified.
- Based on an ABS data quality assessment, Indigenous status data from the Recorded Crime – Victims collection is available for national reporting across 4 states and territories (New South Wales, Queensland, South Australia and the Northern Territory). However, the proportion of victims with an Indigenous status of ‘not stated’ varies by jurisdiction and offence. For more information, see the ABS’ Recorded Crime – Victims methodology.
- Aggravated sexual assault includes: Incest, rape, intent/attempt to commit rape, administering of drugs with intent to rape, unlawful sexual intercourse, unlawful fellatio/cunnilingus, carnal knowledge and assault with the intent to commit a sexual act. Non-aggravated sexual assault includes: threat of sexual assault and indecent assault not including aggravating circumstances.
- A weapon is defined as any object that can be used to cause injury or fear of injury in the commission of a crime. It also includes imitation weapons and implied weapons (e.g. where a weapon is not seen by the victim but the offender claims to possess one). Parts of the body such as fists and feet are not included as a weapon.
- An investigation is finalised when the case is no longer considered open and an offender has been proceeded against through court action or non-court action, or an offender was not proceeded against as a result of either the circumstances of the alleged offender, or because the offence could not be verified. Cases where the investigation has not been finalised and no offender has been proceeded against at the time of recording the outcome includes cases where the investigation is ongoing or pending/suspended.
- Relationship data is not available for Western Australia. Data presented by relationship is based on data from all other states and territories.
- Family member total includes partner, ex-partner, other family member and other family member not further defined.
- Partner includes de-facto, spouse, boyfriend and girlfriend.
- Ex-partner includes separated partner, ex-spouse, ex-boyfriend and ex-girlfriend.
- Other family member includes parent, child, sibling, uncle, aunt, nephew, niece, cousins, grandparents and other family member not elsewhere classified.
- Non-family member total includes all persons known to the victim who were not included in the family total, e.g., friend, teacher, etc
- A weapon is defined as any object that can be used to cause injury or fear of injury in the commission of a crime. It also includes imitation weapons and implied weapons (e.g. where a weapon is not seen by the victim but the offender claims to possess one). Parts of the body such as fists and feet are not included as a weapon.
- An investigation is finalised when the case is no longer considered open and an offender has been proceeded against through court action or non-court action, or an offender was not proceeded against as a result of either the circumstances of the alleged offender, or because the offence could not be verified. Cases where the investigation has not been finalised and no offender has been proceeded against at the time of recording the outcome includes cases where the investigation is ongoing or pending/suspended.
-
For more information see Methods, Glossary and Data sources.