Clients exiting custodial arrangements
This section highlights findings in relation to clients who have recently exited custodial settings, including correctional facilities, youth justice detention centres and immigration detention centres (see Technical information for client definition). People who exit custodial settings are recognised as being at increased risk of homelessness; they are also less likely to exit homelessness [1]. The ability to secure stable housing may reduce the likelihood of reoffending [2].
Key findings in 2015–16
- In 2015–16, 7,804 clients (3% of all clients of specialist homelessness clients) were identified as clients exiting from a custodial setting, an increase of 14% compared with 2014–15 and a higher rate of growth than the general SHS population. The majority of additional clients were from New South Wales (73%).
- The majority of clients were exiting adult correctional facilities (84%).
- The majority of clients who exited custodial settings in 2015–16 were male (77%) and aged between 25 and 44 (58%).
- Support was provided, on average, over shorter periods but more often than in 2014–15 (Table Exit Trends.1).
- 2 in 3 (66%) clients were living alone when they sought assistance from homelessness services, the highest rate of all SHS client groups.
Clients exiting custodial arrangements: 2011–12 to 2015–16
About 8 in 10
clients seeking assistance from homelessness agencies between 2011–12 and 2015–16 were male.
Since the beginning of the SHS collection in 2011–12 the number of people exiting custodial arrangements and seeking assistance from specialist homelessness services has been increasing. Key trends identified in this client population over these 5 years are:
- The number of clients who recently exited custodial arrangements is growing on average 11% each year and this annual growth rate is higher for females than males (15% compared with 10%).
- Both the proportion of clients receiving accommodation and the length of their accommodation (median) have declined (Table Exit Trends.1).
- Housing outcomes at the end of support for this client group have not improved over time; around 2 in 5 clients ended support in institutional settings and about 1 in 5 clients ended support housed in short-term emergency accommodation each year. The proportion of clients in these groups combined, has remained the same over time.
- The proportion of these clients achieving all case management goals was consistently lower than the general SHS population every year (see Tables Exit Trends.1 and Client Trends.1) and this group was one of the least likely to achieve all case management goals each year.
| 2011–12 | 2012–13 | 2013–14 | 2014–15 | 2015–16 | |
|---|---|---|---|---|---|
| Number of clients (proportion of all clients) | 5,132 (2) | 6,399 (3) | 6,756 (3) | 6,866 (3) | 7,804 (3) |
| Rate (per 10,000 population) | 2.3 | 2.8 | 2.9 | 2.9 | 3.3 |
| Housing situation at the beginning of first support period (proportion of all clients) | |||||
| Homeless | 33 | 36 | 27 | 31 | 31 |
| At risk of homelessness | 67 | 64 | 73 | 69 | 69 |
| Length of support (median number of days) | 34 | 46 | 53 | 46 | 44 |
| Average number of support periods per client | 1.7 | 1.8 | 1.8 | 1.8 | 1.9 |
| Proportion receiving accommodation | 45 | 41 | 40 | 41 | 38 |
| Median number of nights accommodated | 31 | 29 | 28 | 27 | 26 |
| Proportion of a client group with a case management plan | 53 | 58 | 53 | 50 | 52 |
| Achievement of all cases management goals (per cent) | 15 | 10 | 11 | 16 | 17 |
Notes
- Rates are crude rates based on the Australian estimated resident population (ERP) at 30 June of the reference year.
- The denominator for the proportion achieving all case management goals is the number of client groups with a case management plan. Denominator values for proportions are provided in the relevant National supplementary table.
Source: Specialist Homelessness Services Collection 2011–12 to 2015–16.
Clients exiting custodial arrangements 2015–16
Services needed and provided
- Of those with an identified need for short-term or emergency housing (48%, or nearly 4,000), almost 2 in 3 (65%) were provided it.
- Of the nearly 3,000 clients exiting custodial arrangements needing assistance to sustain tenancy or prevent tenancy failure or eviction, 85% received this assistance.
- Clients leaving custodial settings were more likely to need assistance with drug/alcohol counselling (11%) than the general SHS population (4%).
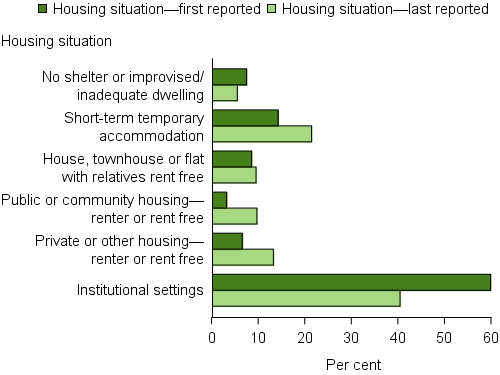
Housing outcomes
- At the beginning of support, the majority of clients exiting custodial settings were living in institutions (60%), short-term or emergency accommodation (14%) or living in a house, townhouse or flat with no tenure, known as ‘couch surfing’ (9%).
- The proportion of clients exiting custodial arrangements who reported living in institutional settings decreased to 40% at the end of support.
- One in 5 clients (21%) were housed in short-term temporary accommodation at the end of support, up from 14% at the beginning of support.
Figure EXIT.1: Clients exiting custodial arrangements, by housing situation at beginning of support and end of support, 2015–16
Notes
- The SHSC classifies clients living with no shelter or improvised/ inadequate dwelling, short-term temporary accommodation, or in a house, townhouse, or flat with relatives (rent free) as homeless. Clients living in public or community housing (renter or rent free), private or other housing (renter or rent free), or in institutional settings are classified as housed.
- Proportions include only clients with closed support at the end of the reporting period.
Source: Specialist Homelessness Services 2015–16, National supplementary table EXIT.4.
Reference
- Johnson, G., Scutella, R., Tseng, Y., Wood, G. (2015) Entries and exits from homelessness: a dynamic analysis of the relationship between structural conditions and individual characteristics, AHURI Final Report No. 248, Australian Housing and Urban Research Institute Limited, Melbourne.
- Australian Government 2008. The road home: a national approach to reducing homelessness. Canberra: Commonwealth of Australia.