Specialist homelessness services client pathways: analysis insights:
Specialist homelessness services client pathways: Young clients presenting alone in 2015–16
Web article
Last updated:
Topic: Homelessness services
Citation
AIHW
Australian Institute of Health and Welfare (2022) Specialist homelessness services client pathways: Young clients presenting alone in 2015–16, AIHW, Australian Government, accessed 20 April 2024.
APA
Australian Institute of Health and Welfare. (2022). Specialist homelessness services client pathways: Young clients presenting alone in 2015–16. Retrieved from https://www.aihw.gov.au/reports/homelessness-services/shs-young-people-2015-16
MLA
Specialist homelessness services client pathways: Young clients presenting alone in 2015–16. Australian Institute of Health and Welfare, 07 June 2022, https://www.aihw.gov.au/reports/homelessness-services/shs-young-people-2015-16
Vancouver
Australian Institute of Health and Welfare. Specialist homelessness services client pathways: Young clients presenting alone in 2015–16 [Internet]. Canberra: Australian Institute of Health and Welfare, 2022 [cited 2024 Apr. 20]. Available from: https://www.aihw.gov.au/reports/homelessness-services/shs-young-people-2015-16
Harvard
Australian Institute of Health and Welfare (AIHW) 2022, Specialist homelessness services client pathways: Young clients presenting alone in 2015–16, viewed 20 April 2024, https://www.aihw.gov.au/reports/homelessness-services/shs-young-people-2015-16
PDF | 1000Kb
Study cohort – Specialist homelessness services: Young clients presenting alone in 2015–16
Introduction
Youth homelessness remains a persistent social problem in Australia and as such children and young people are a priority homelessness cohort (see Children and young people).
Longitudinal analyses have been undertaken for a cohort of younger clients (aged 15 to 24 years) who presented to SHS agencies alone (that is, not as part of a family group) at some time. These analyses are designed to examine SHS service usage patterns for a cohort of service users that can be tracked for a relatively similar period in the past and into the future.
See Introduction to the SHS longitudinal data for details on the longitudinal analysis undertaken.
The Young people presenting alone cohort (Young 2015–16) was defined as SHS clients that met the following conditions in any of the support periods in 2015–16:
- They were aged between 15 and 24 years (inclusive) at the time of presenting to an SHS agency in 2015–16.
- They presented alone (not as part of a couple or family group) while aged 15 to 24 years. This criterion limits the cohort to clients that attend SHS for their own needs. This is because the longitudinal analyses focus on pathways for individual clients, whereas children accessing services because of their parents or carers may need support for of issues that are unrelated to them directly.
The above is consistent with the approach used in other AIHW SHS publications such as the 2020–21 SHS annual report (AIHW 2021).
A comparison cohort (non-Young cohort) was also created, comprising clients aged 15 and over who did not meet the criteria for inclusion in the Young cohort. These clients were either young (aged 15 to 24) but did not present alone for services at any time during 2015–16, or they were aged 25 and over (no account was made of whether they presented alone or not). More information on the how comparison cohorts were derived can be found in the Methodology section.
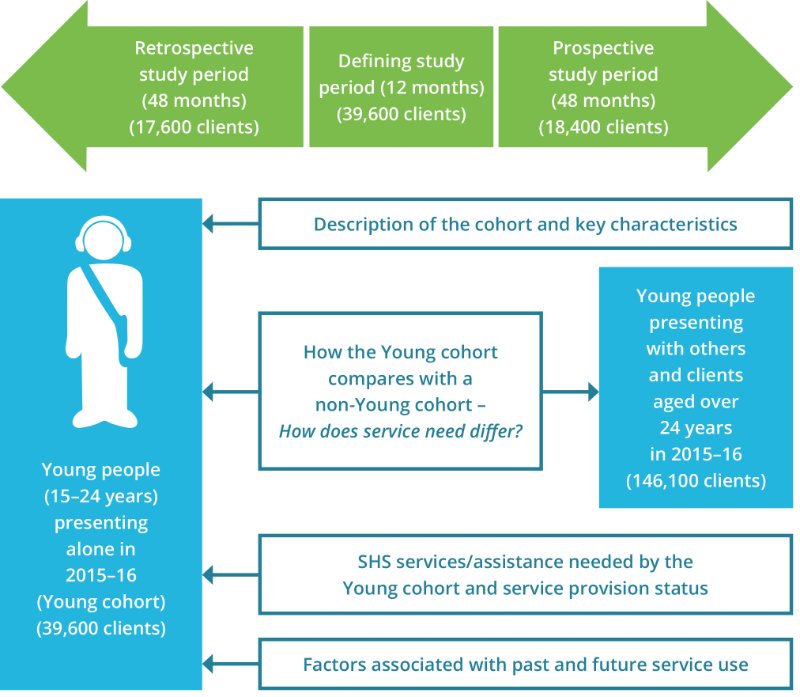
The longitudinal SHS data for the period 2011–21 were used to (Figure Young.1):
- examine characteristics of young clients (the Young cohort) compared with the comparison cohort (the non-Young cohort)
- examine outcomes for the Young cohort in terms of historical and future service use.
The retrospective study period for this cohort is the 48 months before the start of the defining study period (that is, the 12 months from the start of their first mental-health related support period in 2015–16). The prospective study period is the 48 months after the end of each client’s 12 month defining study period.
Figure Young.1: Young people presenting alone cohort, longitudinal analysis overview
Source: AIHW analysis of SHS longitudinal data 2011–21, Table Young1516.1.
Key characteristics of the Young 2015–16 cohort
There were nearly 40,000 clients in the Young 2015–16 cohort; these clients had the following key characteristics (Table Young1516.1):
- One quarter of younger clients (10,100) were aged 15 to 17 years at the time of their first support period in 2015–16; the remaining 29,500 clients were aged 18 to 24 years.
- Around 11,000 clients (28%) were Indigenous.
- Nearly 4,400 clients (11%) were born overseas.
- Over half of clients (51%; 20,400 clients) had only one support period during the defining study period and 27% (10,600) had 3 or more support periods.
- Around 44% had used services previously; that is, 17,600 clients had used services in the 48-month retrospective period that preceded the defining study period.
- Around 46% of clients (18,400) continued to use services into the future; that is, they received support in the 48 months after the 12-month defining study period.
Service engagement profiles
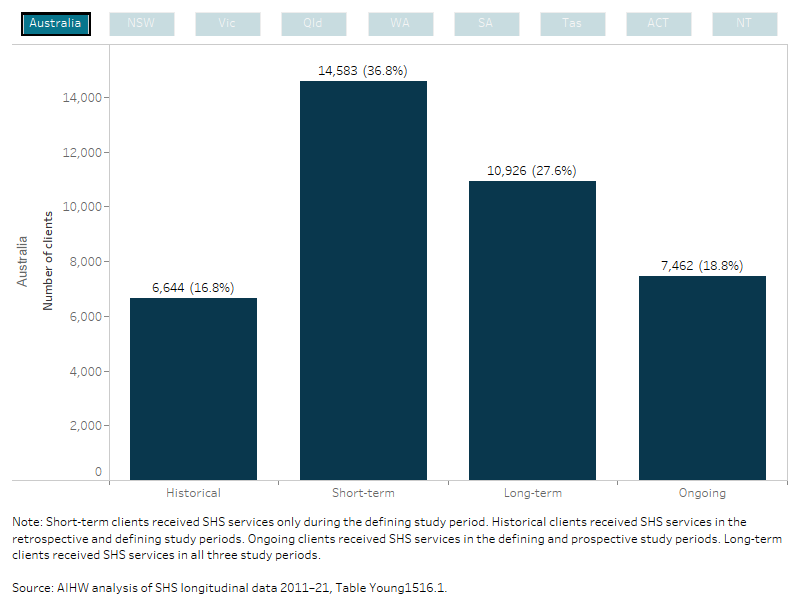
Service use patterns of the Young cohort over the entire longitudinal period (2011–21) were examined. Over a third (14,600 or 37%) of the Young cohort were short-term clients (they only used services during the 12-month defining study period) (Figure Young.2, Table Young1516.1).
Figure Young.2: Young 2015–16 client cohort, service engagement profiles
This interactive bar chart shows service use patterns of the Young cohort over the entire longitudinal period (2011–21). Support information was combined from the discrete study periods into four service engagement profile groups (historical, short-term, long-term and ongoing). Engagement profiles for all states and territories and Australia can be selected and displayed. Nationally, of the 39,600 clients that made up the study period cohort, over a third (14,600 or 37%) of the Young cohort were short-term clients (they only used services during the 12-month defining study period). For VIC clients, 32% were short-term clients and had used SHS support during the defining period only and a similar proportion (33%) were long-term clients (used services in all study periods).
|
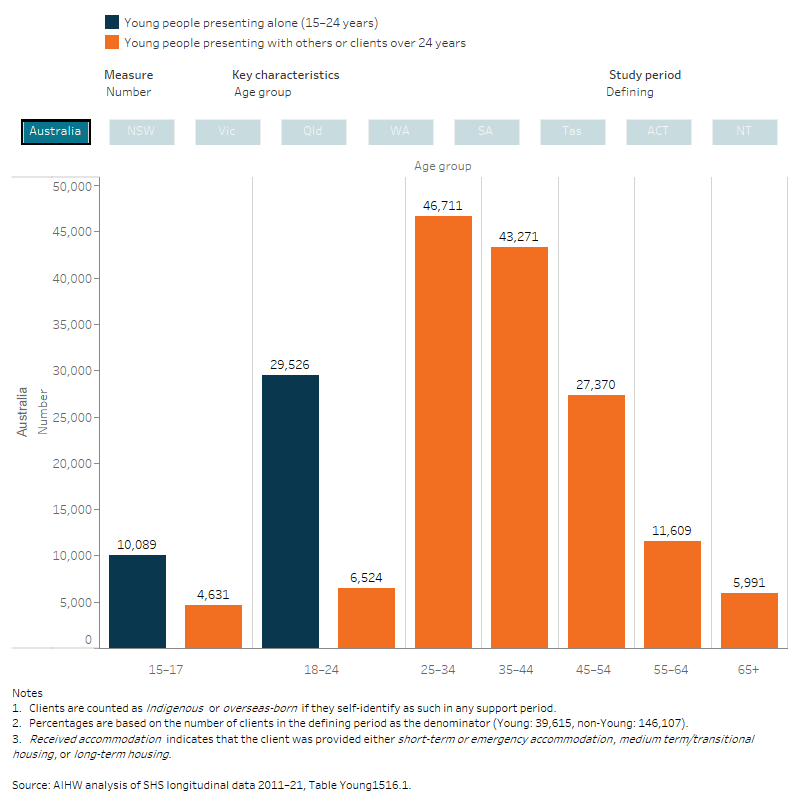
This interactive bar chart shows a comparison between the Young and non- Young cohorts, in terms of key characteristics and across all study periods (defining, retrospective and prospective). A radio button allows selection for the individual state/territory and Australia. For Australia, Young cohort clients were more likely to be Indigenous (28% compared with 21%) and less likely to be born overseas (11% compared with 18%). They were more likely to have had mental health issues (39% compared with 33%) during the defining study period. |
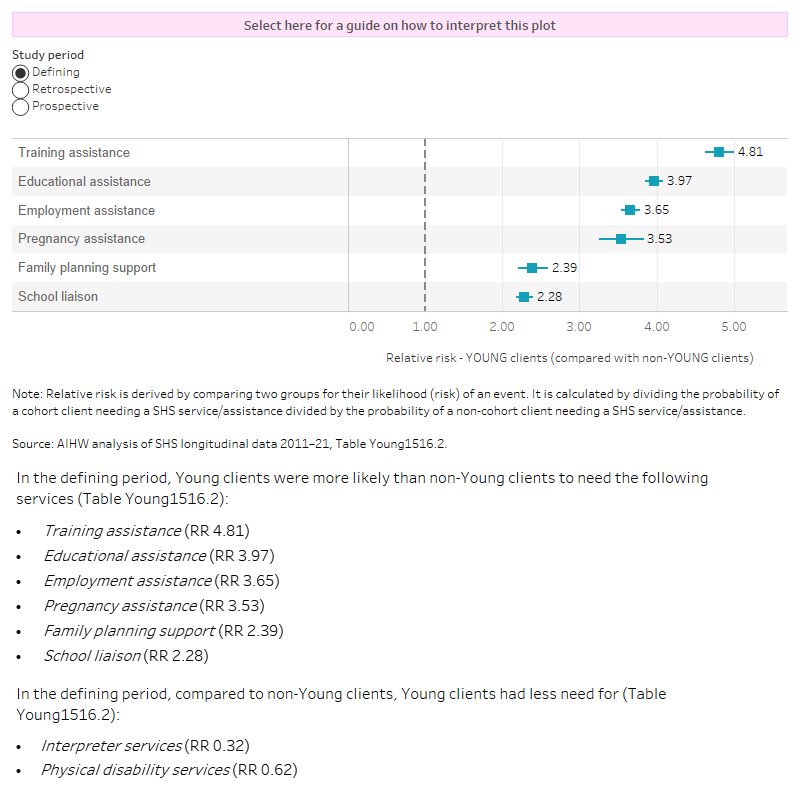
The interactive risk ratio plot shows the differences in service need between Young and non- Young clients receiving SHS support in each study period, these associations are presented as relative risks. The top 6 services more likely to be needed by Young cohort clients compared with non- Young clients (that is, those with the largest relative risk) have been shown in the figure. A radio button allows selection of the services and relative risks for each of the study periods (defining, retrospective and prospective). Younger clients were nearly 5 times more likely to need training assistance (relative risk (RR) 4.81) during the 2015–16 defining study period than non-Young clients. Young clients were also 2 to 3 times more likely to need pregnancy, employment and education assistance in all study periods.
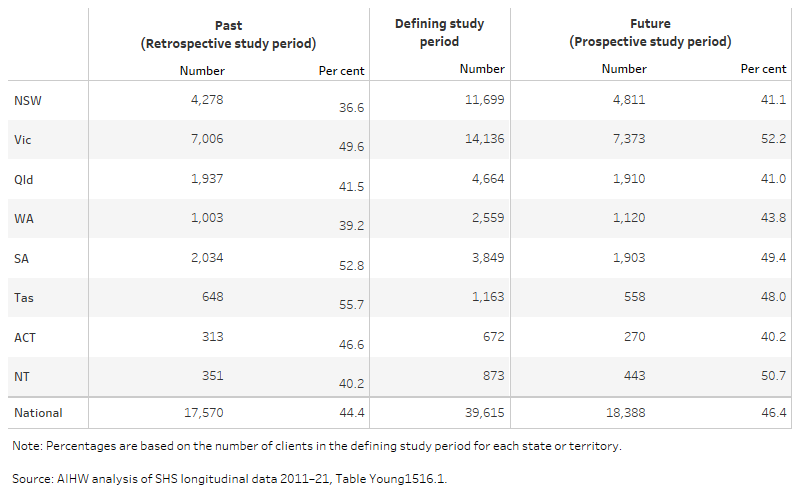
The table shows the number and per cent of Young cohort clients within each study period for each state and territory and Australia. Over one-third (36%; 14,100) of clients received their first support period in 2015–16 in Victoria, followed by 30% in New South Wales and 12% in Queensland. The proportion of clients that used services in the past ranged from 37% of the defining cohort in New South Wales to 50% in Victoria. The proportion of clients that received SHS support in the future (after the defining study period) ranged from 40% in the ACT to 52% in Victoria.
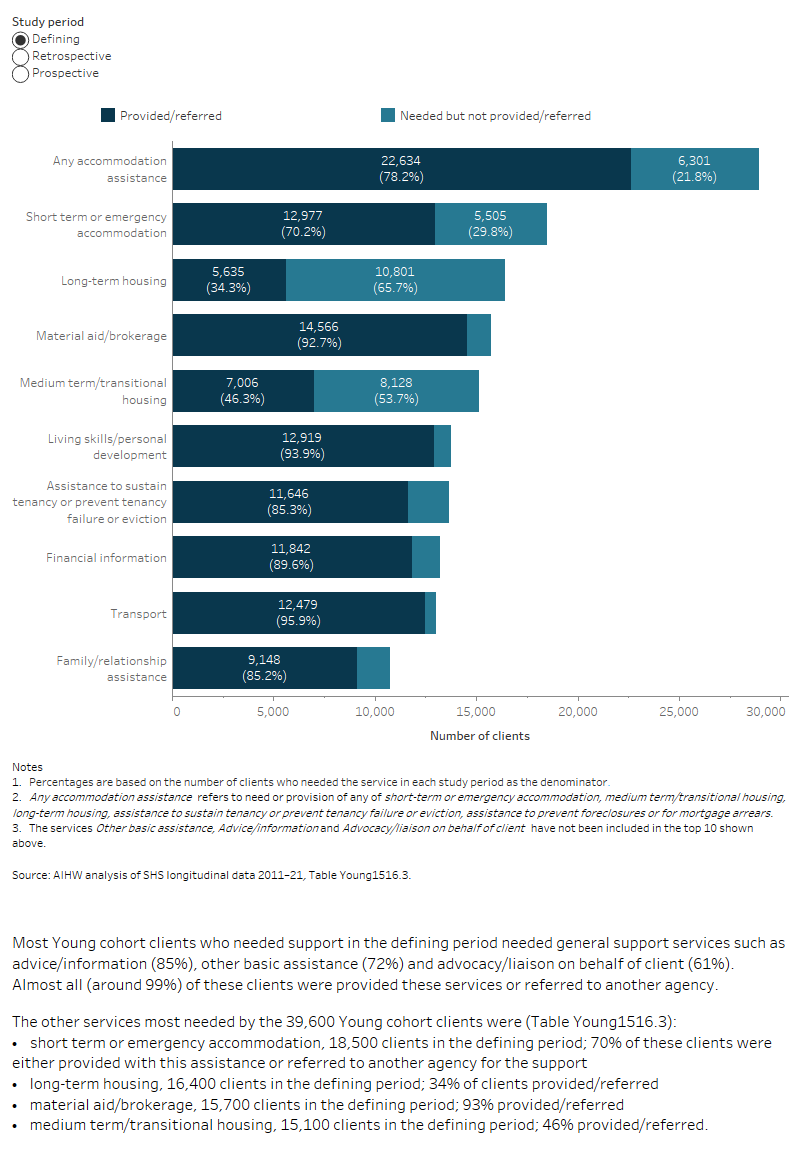
The interactive stacked horizontal bar graph shows the select top 10 services needed and the provision/referral status for the Young cohort clients (39,600 clients) that used services in the retrospective, defining and prospective study periods. Patterns of service need differed for Young SHS cohort clients across the three study periods. For example, the proportion of clients with a need for long-term housing was 42% in the defining period, 61% in the prospective period and 54% in the retrospective period. Similarly, a much smaller proportion of clients in the defining period needed assistance to sustain tenancy or prevent tenancy failure or eviction (35%) compared with 52% of clients in the prospective period and 44% in the retrospective period.
The interactive risk ratio plot shows the characteristics or circumstances that are associated with the Young cohort clients use of SHS services in the past (retrospective) or future (prospective period), these associations are presented as relative risks. Relative risks for all states and territories and Australia can be selected and displayed. Although associations vary in magnitude between states and or territories, females were more likely to have a history of SHS support (16% greater likelihood in the national data). Being not employed and being an Indigenous Australian was strongly associated with a history of service use as well as ongoing service use.
