Access to hospitals
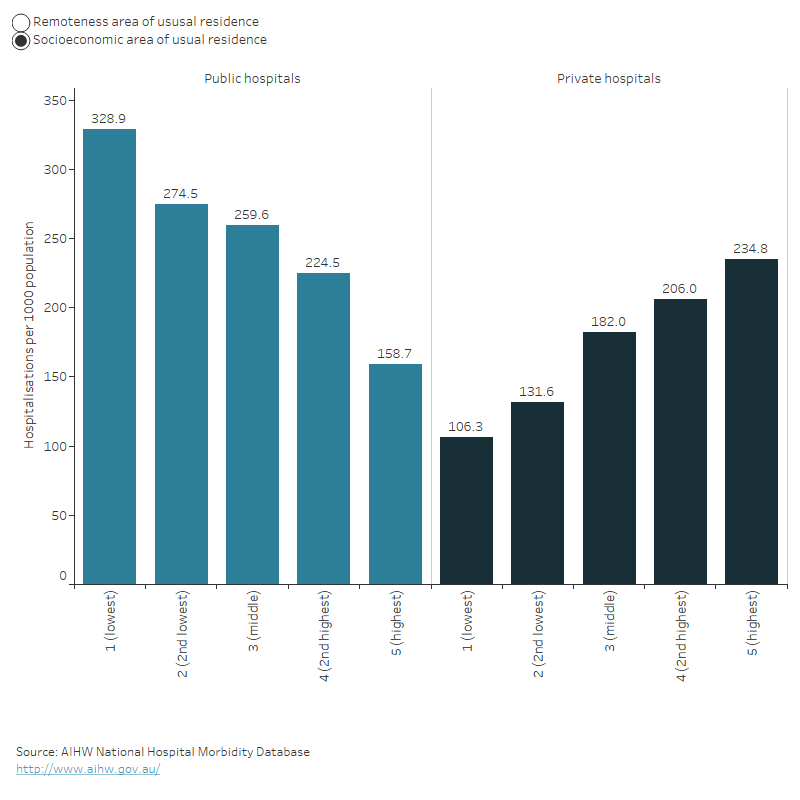
The bar chart shows the number of hospitalisations for public and private hospitals by socioeconomic status and remoteness in 2021–22. Generally, the number of hospitalisations per 1000 population decreased for public hospitals and increased for private hospitals as the level of disadvantage decreases. Also, the number of hospitalisations per 1000 population generally increased for public hospitals and decreased for private hospitals as the level of remoteness increases.
Access to emergency department care
Waiting times
How long people wait in the emergency department before they receive care (waiting time) can be used as a measure of the accessibility of emergency department care.
Waiting time statistics are presented here as:
- the 50th percentile (median) waiting time, which represents the time before which half of people are seen
- proportion seen on time.
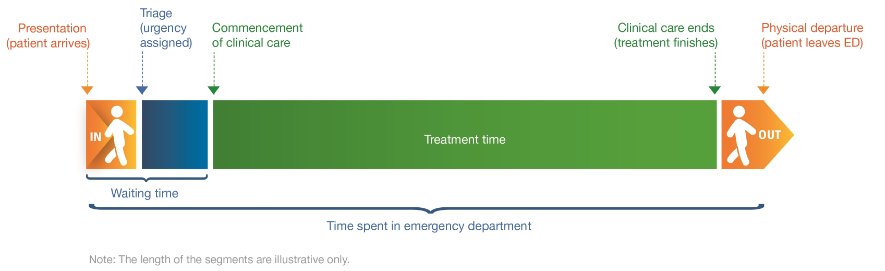
Emergency department waiting time measures represent the time elapsed from presentation to commencement of clinical care.
Diagram: Time spent in emergency department
In 2022–23, 50% of patients were seen within 20 minutes.
This has stayed relatively consistent since 2018–19, when 50% of patients were seen within 19 minutes.
In 2022–23, 65% of presentations to emergency departments were ‘seen on time’ (down from 67% in 2021–22).
This percentage ranged from 100% of patients requiring immediate care (Resuscitation) to 58% of patients who needed care within 30 minutes (Urgent).
In 2022–23, 50% of emergency department presentations were completed within 3 hours and 39 minutes, and 90% were completed within 10 hours and 32 minutes.
For patients who were not subsequently admitted to hospital, 90% completed their care within 7 hours and 19 minutes, but for patients subsequently admitted to hospital, 90% completed their care within 18 hours and 23 minutes.
The time spent in the emergency department for 90% of patients also varied by triage category – ranging from 4 hours and 54 minutes for patients who needed care within 120 minutes (Non-urgent) to 15 hours and 30 minutes for patients requiring immediate care (Resuscitation).
Access to surgery
People can be admitted to hospital for emergency surgery, or for less urgent procedures they can be booked in as part of an ‘elective’ admission to hospital (elective in this context refers to there being some flexibility around the timing of the procedure, not whether the procedure itself is optional.). Access to surgical services can be affected by issues such as the person’s geographical location, the availability of other healthcare services, and how many people are on public hospital elective surgery waiting lists.
Emergency hospitalisations involving surgery
In 2021–22, 374,000 hospitalisations were emergency admissions that involved surgery.
Eighty-six per cent (321,000) were in public hospitals and 14% (52,500) were in private hospitals.
The three most common reasons for emergency admissions involving surgery were appendicitis, fractured femur, and heart attack.
People living in Very remote areas were twice as likely to have an emergency admission involving surgery as people living in Major cities (26 compared with 13 hospitalisations per 1,000 population).
Elective hospitalisations involving surgery
In 2021–22, 2.3 million hospitalisations were elective admissions involved surgery.
Seventy per cent (1.6 million) were in private hospitals and 30% (672,000) were in public hospitals.
The three most common reasons for elective admissions involving surgery were cataracts, skin cancer and procreative management.
People living in Major cities were nearly one and a half times as likely to have an elective admission involving surgery as people living in Very remote areas (79 compared with 53 hospitalisations per 1,000 population).
Admissions from public hospital elective surgery waiting lists
Removal of cataracts was the most common procedure (10.3%), followed by Cystoscopy (7.5%). The most common surgical specialty was General surgery (20%), followed by Urological surgery (15%) and Ophthalmology surgery (14%).
For the 25 most common intended procedures in 2021, people living in Remote areas had the highest rate of admissions from public hospital elective surgery waiting lists (32 hospitalisations per 1,000 population) followed by people in Very remote and Outer regional areas (28 and 27 hospitalisations per 1,000 population respectively). People living in Major cities had the lowest rate of admissions from public hospital elective surgery waiting lists (18 hospitalisations per 1,000 population).
Waiting times for admission to elective surgery
In 2022–23:
- 50% of patients admitted to hospital from public hospital elective surgery waiting lists waited for 49 days or less, and 90% waited for 361 days or less
- 9.6% of people admitted for surgery waited more than 365 days compared to 6.3% just a year before
- 50% of Indigenous Australians were admitted to hospital within 56 days, whereas 50% of Other Australians were admitted within 49 days.
In 2021–22:
- the time within which 50% of patients were admitted for their awaited procedure ranged from 34 days in Remote areas to 48 days in Outer regional areas for the 25 most common intended procedures
- the time within which 50% of patients were admitted ranged from 30 days for patients living in the least disadvantaged areas to 44 days for people living in the most disadvantaged socioeconomic areas for the 25 most common intended procedures.
The 50th percentile waiting time increased from 41 days in 2018–19 to 49 days in 2022–23. The 90th percentile waiting time increased from 279 days in 2018–19 to 361 days in 2022–23.