Eye examinations among those tested for diabetes (MBS data)
There are 6 separate charts for this measure showing the proportion of those who had a diabetes test who had an eye examination by an optometrist or ophthalmologist, for Indigenous and non-Indigenous Australians by age and over time.
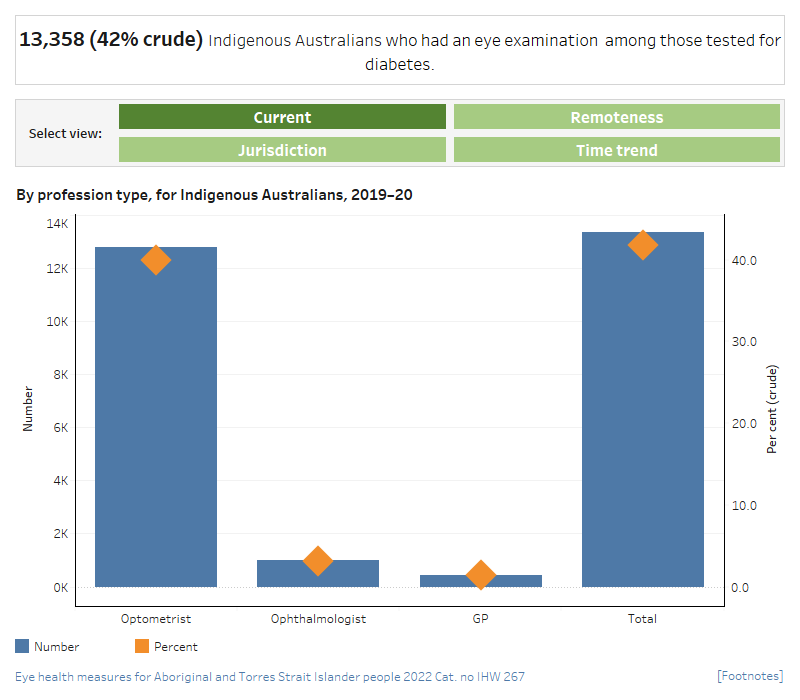
Number and proportion of Indigenous Australians who had a diabetes test who also had an eye examination by profession type, 2019–20
This dual axis vertical bar chart and scatter plot displays the number and proportion of Indigenous Australians screened for diabetes who had had an eye examination by an optometrist, ophthalmologist or GP. The chart shows that in 2019–20, an estimated 40% had an eye examination by an optometrist, 3.1% by an ophthalmologist and 1.4% by a GP.
Proportion of Indigenous Australians who had a diabetes test who also had an eye exam by region, 2019–20
This vertical bar chart shows the proportion of Indigenous Australians screened for diabetes who had an eye examination in 2019–20, by remoteness. While the proportion is highest in Inner regional areas (47%), in general it decreases with remoteness—with the lowest rate in Very remote areas (29%).
Proportion of Indigenous Australians who had a diabetes test who also had an eye exam by jurisdiction, 2019–20
This vertical bar chart shows the proportion of Indigenous Australians screened for diabetes who had an eye examination in 2019–20, by jurisdiction. The jurisdictions with the highest proportions were Victoria and Tasmania (48% and 46%, respectively), and the lowest was the Northern Territory (29%).
Proportion of Australians who had a diabetes test who also had an eye exam, by Indigenous status, 2005–06 to 2019–20
This line graph shows the age standardised proportion of those screened for diabetes who had an eye examination between 2005–06 and 2019–20, by Indigenous status. The chart shows that the estimated proportion of Indigenous Australians with diabetes who had an eye examination increased from 26.9% in 2005–06 to 37.3% in 2018–19 before declining to 35.5% in 2019–20.
Proportion of Indigenous Australians who had a diabetes test who also had an eye exam by age, 2005–06 to 2019–20
This line graph shows the proportion of Indigenous Australians screened for diabetes who had an eye examination from 2005–06 to 2019–20, by age group. The chart shows that the proportion has risen across all years from 2005–06 to 2018–19 before declining for the older age groups (35–44, 45–54, 55–64 and 65 and over) in 2019–20.
Proportion of non-Indigenous Australians who had a diabetes test who also had an eye exam by age, 2005–06 to 2019–20
This line graph shows the proportion of non-Indigenous Australians screened for diabetes who had an eye examination from 2005–06 to 2019–20, by age group. The chart shows that the proportion has risen over time, with proportions rising with age across all years from 2005–06 to 2018–19 before declining for all age groups from 2018–19 to 2019–20.