Number and rate of optometrists
There are 4 separate charts for this measure showing the number and rate of full-time equivalent (FTE) optometrist per 100,000 population, by various characteristics.
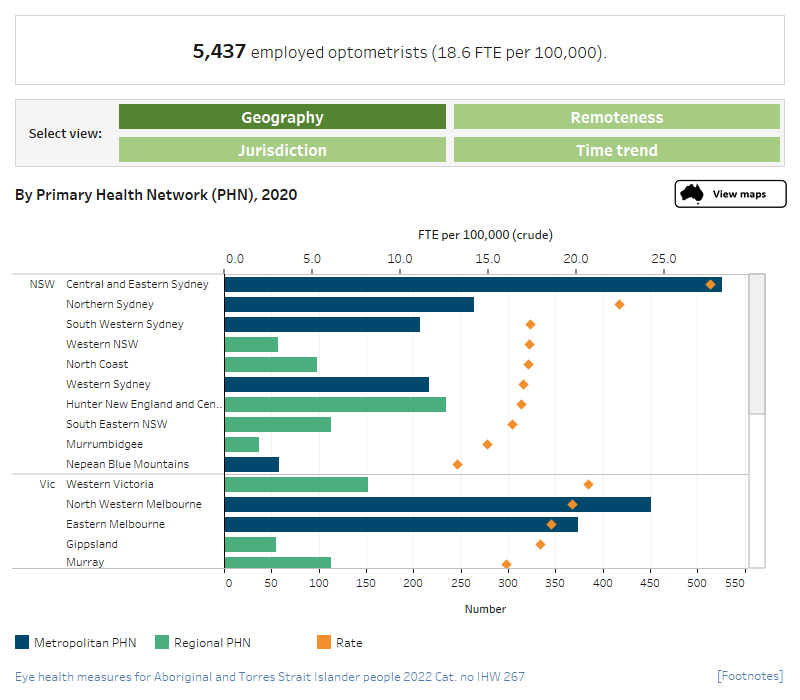
Number and FTE per 100,000 persons, optometrists, primary health network, 2020 (bar chart)
This dual axis combined horizontal bar chart and scatter plot presents the number and FTE rate of optometrists in 2020, by PHN. PHNs have been grouped by state and are ranked from highest to lowest FTE rate within each state grouping. In NSW the PHN with the highest rate of employed optometrists was Central and Eastern Sydney (28 FTE per 100,000). Nepean Blue Mountains had the lowest rate in NSW (13 FTE per 100,000). In Victoria the PHN with the highest rate of employed optometrists was Western Victoria (21 FTE per 100,000). South Eastern Melbourne had the lowest at 16 FTE per 100,000.
Number and FTE per 100,000 persons, optometrists by region, 2020
This dual axis combined vertical bar chart and scatter plot presents the number and FTE rate of optometrists in 2020, by remoteness. The chart shows that Major cities had the highest number (4,267) and rate (20 FTE per 100,000) of employed optometrists. This was followed by Inner regional areas (859, or 18 FTE per 100,000) and Outer regional areas (276, or 13 FTE per 100,000). The numbers and rates of optometrists were lowest in Remote and Very remote areas.
Number and FTE per 100,000 persons, optometrists, by jurisdiction, 2020
This dual axis combined vertical bar chart and scatter plot presents the number and FTE rate of optometrists in 2020, by jurisdiction. The chart shows that the Northern Territory had the lowest number (33, or 13 FTE per 100,000) of employed optometrists. New South Wales had the highest number (1,823) and rate (20 FTE per 100,000) of employed optometrists.
Number and FTE per 100,000 persons, optometrists, 2013 to 2020
This dual axis combined vertical bar chart and scatter plot presents the number and FTE rate of optometrists, from 2013 to 2020. The chart shows that, between 2013 and 2020, the number and rate of optometrists has increased. In 2013 there were 4,219 employed optometrists (17 FTE per 100,000) and, by 2020, this had increased to 5,437 (19 FTE per 100,000).