Occasions of eye health services – Combined outreach programs
There are 2 charts for this measure showing the number occasions of service for all outreach services, by various characteristics.
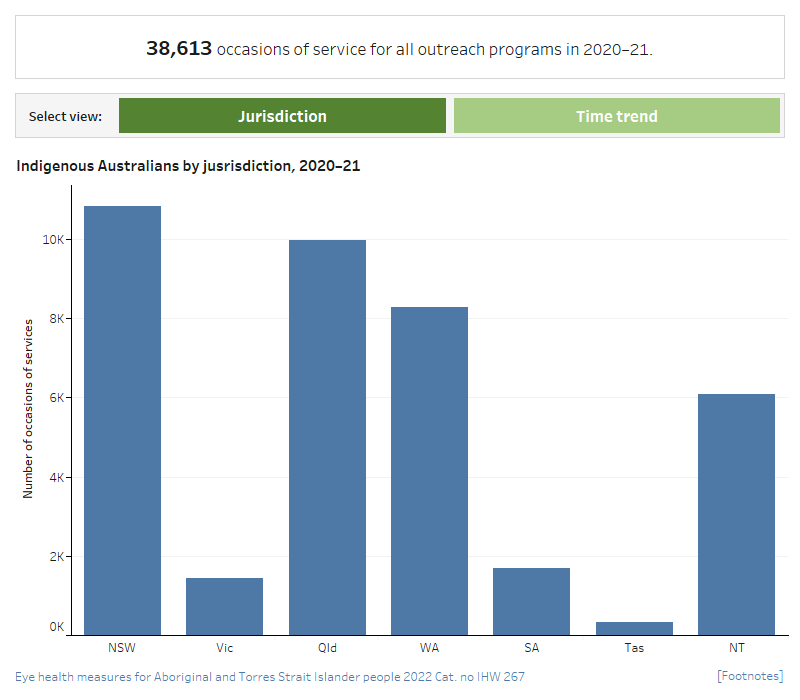
Occasions of service – Combined outreach services 2020–21 (jurisdiction)
This vertical bar chart presents the number of occasions of service for all outreach programs combined, by jurisdiction. The chart shows that the highest number of occasions of service provided by an eye health professional was in NSW (10,816) and the lowest number was in Tasmania (331).
Occasions of service – Combined outreach services 2014–15 to 2020–21 (Time trend)
This line chart shows trends in the number of occasions of service for Indigenous Australians in all outreach programs from 2014–15 to 2020–21. Lines are presented for each of the 3 outreach program types (VOS, RHOF and MOICDP) and a line for total number of occasions of service for all outreach combined is also presented. In 2014–15 there were 27,269 occasions of service for all outreach programs. This peaked in 2017–18 at 39,020 and has since declined to 38,613 in 2020–21.