Kidney function test – type 2 diabetes and/or CVD (PI18 and PI19)
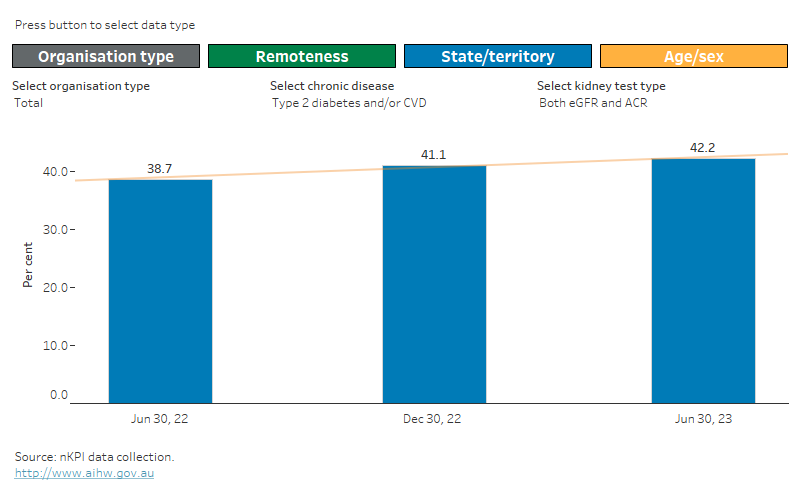
Kidney function test type – type 2 diabetes and/or CVD, by reporting period and kidney test type
This Tableau visualisation shows the percentage of First Nations regular clients aged 18 and over with type 2 diabetes and/or CVD who had a kidney function test recorded in the last year by test type (select for ACR, eGFR, both ACR and eGFR, or neither) and reporting period from June 2022 to June 2023 for either:
- organisation type (ACCHO, non-ACCHO)
- remoteness area (Major cities, Inner regional, Outer regional, Remote, Very remote)
- state/territory (NSW/ACT, Vic, Qld, WA, SA, Tas, NT)
- age/sex group (male, female with age group 18–34, 35–44, 45–54, 55–64, 65+).
Data supporting this visualisation are available in Excel supplementary data tables at Data.
Kidney function test result (risk category) – type 2 diabetes and/or CVD - by reporting period
This Tableau visualisation shows the percentage of First Nations regular clients aged 18 and over with type 2 diabetes and/or CVD who had both and ACR and eGFR test result to determine CKD risk category (select for normal, low, moderate or high) from June 2022 to June 2023 for either:
- organisation type (ACCHO, non-ACCHO)
- remoteness area (Major cities, Inner regional, Outer regional, Remote, Very remote)
- state/territory (NSW/ACT, Vic, Qld, WA, SA, Tas, NT)
- age/sex group (male, female with age group 18–34, 35–44, 45–54, 55–64, 65+).
Data supporting this visualisation are available in Excel supplementary data tables at Data.
