Effect of including multiple causes of death codes in case selection
Data in this report and in other recent reports in this series were analysed using MCoD codes, whereas data in earlier reports in this series were analysed using UCoD codes.
Figure 2.6 compares the number of injury deaths in 2016–17 that would have been included in this report using only UCoD codes with the number deaths included using MCoD codes.
Use of MCoD codes resulted in a large increase in counts for fall-related deaths and deaths involving poisoning by substances other than pharmaceuticals. There were less marked increases in counts for other external cause groups, and little difference in counts for suicides and homicides. Patterns were similar for the other years covered in this report.
Figure 2.6: Comparison of deaths for underlying cause of death codes and multiple causes of death codes, by external cause group, 2016–17
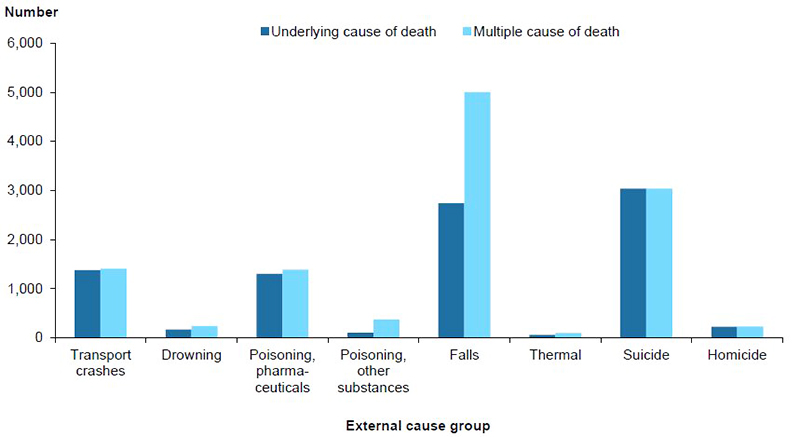
Source: AIHW NMD.
How have the causes of injury mortality varied over time?
All injury deaths
Table 2.8 shows changes in the age-standardised rates of external causes of injury between 1999–00 and 2016–17. Although counts for 2014–15 to 2016–17 are subject to revision, there are relatively small differences between unrevised and revised counts for most major external cause groups for deaths registered in 2012 and after (see Appendix C). More information on trends in each of the causes of injury listed in the table is available in subsequent sections of this report.
Rates of injury deaths declined from 1999–00 to 2016–17, by 3.7% per year for transport injury, 2.6% per year for drowning and 2.3% for homicide.
Rates of poisoning deaths involving pharmaceuticals fell sharply to 2001–02, then rose by 2.7% per year to 2016–17.
Rates of fall injury deaths, poisoning deaths involving other substances, and thermal injury deaths did not show a significant trend, despite a large peak in thermal injury deaths in 2008–09 as a result of the 2009 Victorian bushfires.
Rates of suicide deaths declined to 2004–05 and rose until 2014–15, but this rise was not statistically significant.
Table 2.8: Trends in age-standardised rates of injury deaths, by cause of injury, 1999–00 to 2016–17
|
External cause |
Trend | Annual change (%)(a) |
Percentage of all injury deaths 2016–17)(a) |
Comments |
|---|---|---|---|---|
|
Unintentional injuries |
||||
| Transport | ↓ |
–3.7 |
10.7 |
|
| Drowning | ↓ | –2.6 | 1.8 | |
| Poisoning, pharmaceuticals | ∼ | 2.7(d) | 10.6 |
Declined to 2001–02 then rose |
| Poisoning, other substances | ∼ | . . | 2.8 | |
| Falls | ↔ | . . | 38.1 | |
| Smoke, fire, heat and hot substances | ∼ | . . | 0.8 |
Large peak in 2008–09 |
| Intentional injuries | ||||
| Intentional self –harm (suicide) | ↔ | . . | 23.1 |
Declined to 2004–05 then rose |
| Assault (homicide) | ↓ | –2.3 | 1.8 | |
Notes:
- Average annual change for 1999–00 to 2016–17.
- Percentage does not add to 100%, as deaths due to Other unintentional injury are not included.
- Direction of trends varied during the study period.
- Average percentage change per year calculated for 2001–02 to 2016–17.
- Average percentage change per year did not differ significantly from 0 (p ≤ 0.05 or less).
Source: AIHW NMD.
Aboriginal and Torres Strait Islander people
Table 2.9 shows changes in age-standardised rates of injury for major external causes for Aboriginal and Torres Strait Islander people between 2001–02 and 2016–17.
Over this period, rates of injury deaths declined by 3.2% per year for transport injury, rose by 6.8% per year for poisoning deaths involving pharmaceuticals, and rose by 2.8% per year for suicides.
Rates for all other external causes either did not change significantly, or had annual case counts that were too small for any meaningful change to be calculated.
Table 2.9: Trends in age-standardised rates of injury deaths for Indigenous Australians, by cause of injury, 2001–02 to 2016–17
|
External cause |
Trend | Annual change (%) | Percentage of all injury deaths 2016–17)(a) |
|---|---|---|---|
|
Unintentional injuries |
|||
| Transport | ↓ |
3.2 |
16.6 |
| Drowning(b) | n.p | . . | 2.7 |
| Poisoning, pharmaceuticals | ↑ | 6.8 | 15.6 |
| Poisoning, other substances | ↔(c) | . . | 6.4 |
| Falls | ↔(c) | . . | 8.6 |
| Smoke, fire, heat and hot substances(b) | n.p | . . | 1.4 |
| Intentional injuries | |||
| Intentional self –harm (suicide) | ↑ | 2.8 | 36.3 |
| Assault (homicide) | ↔(b) | . . | 7.0 |
Notes:
- Percentage does not add to 100%, as deaths due to Other unintentional injury are not included.
- Annual cases counts were too small for meaningful change in rates over time to be calculated.
- Average percentage change per year did not differ significantly from 0 (p ≤ 0.05 or less).
Source: AIHW NMD.