Health – service use
Key findings
Most (95%) older Australians see a general practitioner.
Key findings
In 2019–20, 241,200 older people accessed Medicare- subsidised mental health-specific services, with older people using services at relatively low rates compared with younger people.
Key findings
Older people account for 16% of the population but more than 1 in 5 (22%) emergency department visits.
Key findings
People aged 85 and over have the highest rate of Pharmaceutical Benefits Scheme prescriptions dispensed.
Key findings
Older people account for 3 in 4 of total palliative care hospitalisations.
There are many programs and services available to support the health of older Australians. Health services include those provided by medical practitioners, specialists and other health professionals in hospitals and clinics. Older people’s access to these services may vary according to where they live, their access to transport, their health and cultural background, as well as socioeconomic factors (AIHW 2020e; van Gaans and Dent 2018).
Cancer screening programs are an important component of health service use. In Australia, there are three national screening programs:
- BreastScreen Australia
- National Bowel Cancer Screening Program (NBCSP)
- National Cervical Screening Program (NCSP).
These programs test for signs of cancer or pre-cancerous conditions in populations without obvious symptoms. They target specific populations and/or age groups where evidence shows screening to be most effective. Cancer screening is not included in this page; for more information on cancer screening in Australia, see Cancer screening.
Throughout this page, ‘older people’ refers to people aged 65 and over. Where this definition does not apply, the age group in focus is specified. The Older Aboriginal and Torres Strait Islander people feature article defines older people as aged 50 and over. This definition does not apply to this page, with Indigenous Australians aged 50–64 not included in the information presented.
Primary care
General practitioners
General practitioners (GPs) are part of the front line of Australia’s health care system. GPs treat a broad range of health issues and are often the first point of contact many people have with the health system. They can be critical in reducing the number of potentially avoidable hospital visits and improving the health of the population (AIHW 2020k).
Most older Australians see a GP. The 2019–20 Australian Bureau of Statistics (ABS) Patient Experience Survey estimated that, in 2019–20, 3.7 million older people (aged 65 and over) saw a GP at least once (95% of all older people). Over half (58%) of these older people were aged 65–74. An estimated 8 in 10 (80%) people aged 15–64 saw a GP at least once (ABS 2020).
In 2019–20, there were 43 million Medicare claims for unreferred GP attendances for people aged 65 and over – 30% of the total 141 million claims for unreferred GP attendances.
Unreferred GP usage was greater for those of older ages. The rates of service use per 100,000 population were:
- 1.5 million by people aged 85 and over
- 1.1 million by those aged 75–84
- 0.8 million by those aged 65–74.
In comparison, the service use for those aged 45–54 was 0.5 million per 100,000 (Services Australia 2021).
ABS data for 2018–19 show that the majority of older people self-reported that they had acceptable waiting times to get an appointment with a GP. For those accessing GP services in the last 12 months, this included:
- 86% of those aged 65–74
- 90% of those aged 75–84
- 89% of those aged 85 and over (AIHW 2020k).
GP visits during COVID-19
During the coronavirus disease 2019 (COVID-19) pandemic, the Australian Government expanded Medicare-subsidised telehealth (telephone and videoconference) services for all Australians and increased Practice Incentive Payments. The new Medicare Benefits Schedule (MBS) items allowed Australians to access essential primary health services, such as GP visits from home, to limit the potential exposure of patients, practice staff and medical practitioners to the virus (AIHW 2020b).
Specialists
Specialists provide diagnostic and treatment services in a specific area of medicine, generally for a particular disease or body system. They also support patients in managing health conditions. Commonly referred specialties across all age groups include: dermatology, cardiology, gynaecology, neurology, oncology and rheumatology.
Medicare-subsidised specialist consultations
There were 14.6 million specialist attendances processed through Medicare in 2019–20 for people aged 65 and over. Almost 1 in 2 specialist attendance claims (46%) were for these older people (Services Australia 2021).
Older people received more Medicare-subsidised specialist consultations outside hospital than younger people. In 2017–18, a higher percentage of older people had at least one Medicare-subsidised referred specialist consultation outside hospital (64% compared with 26% of those under 65) (AIHW 2020g).
Estimates from the 2019–20 ABS Patient Experience Survey showed that older people (aged 65 and over) are more likely to see a medical specialist than younger people. In 2019–20, people aged 85 and over were more than twice as likely to have seen a medical specialist in the last 12 months as those aged 15–24 (59% compared with 20%, respectively) (ABS 2020).
Older people who report seeing a medical specialist, across both age and sex comprised:
- 57% of men and 53% of women aged 65–74
- 61% of men and 61% of women aged 75–84
- 61% of men and 58% of women aged 85 and over (ABS 2020).
Older people were less likely to delay seeing or to not see a medical specialist compared with younger people – 1 in 10 people aged 65 and over (11%) compared with 1 in 4 people aged 15–24 (27%).
Most older people reported that a medical specialist:
- always listened carefully to them (85%)
- always showed them respect (88%)
- always spent enough time with them (86%) (ABS 2020).
Allied health professionals
Allied health services include those delivered by audiologists, chiropractors, diabetes educators, dietitians, exercise physiologists, occupational therapists, optometrists, orthoptists, osteopaths, physiotherapists, podiatrists, psychologists, social workers and speech pathologists.
Overall, older people (aged 65 and over) use allied health services more than younger people. In 2018–19, 65% of Australians aged 65–79 and 72% of people aged 80 and over received an allied health service, whereas 32% of Australians aged 64 or under received a service (AIHW 2020g). For more information on older Australians’ health, see Health – selected conditions.
There were around 10 million non-admitted patient service events provided to people aged 65 and over in 2019–20; that is, allied health services provided to public patients in public hospital outpatient clinics. While people aged 65 and over accounted for 16% of the total population, they represented 34% of these non-admitted patient service events (AIHW 2020i).
For more information, see Medicare-subsidised GP, allied health and specialist health care across local areas: 2013–14 to 2017–18.
Mental health services
As for all Australians, older people may access mental health services through various pathways, including hospital, residential and community-based services, emergency departments, GPs, medical specialists and/or allied health professionals. Due to the diversity of mental health support services available, there is no single, overarching data collection that can be used to report on the mental health care being accessed by older Australians.
In 2019–20, 241,200 older people (aged 65 and over) accessed over 1.0 million Medicare-subsidised mental health-specific services. These services represented 8.3% of the total 12.4 million mental health-related services subsidised by Medicare in that year (AIHW 2021a). Compared with younger people, a relatively low percentage of older people received Medicare-subsidised mental health-specific services (Table 3D.1).
|
Age group (years) |
Number of services |
Number of patients |
Rate (% of the population) |
|---|---|---|---|
|
18–24 |
1,641,488 |
361,634 |
15.3 |
|
25–34 |
2,497,812 |
553,374 |
14.5 |
|
35–44 |
2,224,281 |
483,525 |
14.1 |
|
45–54 |
1,906,883 |
403,860 |
12.5 |
|
55–64 |
1,429,588 |
294,977 |
10.0 |
|
65–74 |
714,261 |
157,596 |
6.8 |
|
75–84 |
261,029 |
65,965 |
5.2 |
|
85 and over |
60,253 |
17,650 |
3.4 |
Note: In the last 12 months.
Source: AIHW 2021a.
Of the 241,200 older people accessing Medicare-subsidised mental health-specific services, most accessed these services provided by GPs (186,300 people). Psychiatrists were the next most common provider (50,900), followed by psychologists –other psychologist services (44,800) and clinical psychologist services (35,100) (AIHW 2021a). Note people can receive services from multiple providers but are counted only once in the total number of patients. As such, the total number of patients will not be a sum of the provider types.
Some older people (aged 65 and over) seeking help for their mental health are admitted for overnight care. In 2018–19, 54,300 older people had a separation from an overnight admitted mental health service. Most of these were without specialised psychiatric care (70%, 38,200). Over time, there has been an increase in the percentage of separations without specialised psychiatric care, particularly for people aged 85 and over (average annual change of 9.3% from 2008–09 to 2018–19). In contrast, separations with specialised psychiatric care for people aged 85 and over had an average annual decrease of 0.8% from 2008–09 to 2018–19 (AIHW 2021a).
For more details about older people with mental health conditions, see Health – selected conditions, and for more information on mental health services in general see Mental health services in Australia.
Dental services
Dental services are provided to improve oral health and reduce disease. Dental services are commonly delivered by dental practitioners (such as dentists and dental surgeons). Services range from routine and preventive care to treatment of dental problems and emergencies. Services can be accessed privately or through public dental clinics or the Department of Veterans Affairs (based on eligibility). As more people are retaining more of their teeth into old age, this is also likely to increase older people’s need for dental services. For more about older Australians’ dental health, see Health – selected conditions.
According to the 2017–18 National Survey of Adult and Oral Health, almost 3 in 5 older people saw a dentist in the last 12 months (AIHW 2021b) (Table 3D.2).
|
|
55–74 |
75 and over |
|---|---|---|
|
Males |
57.4% |
54.8% |
|
Females |
61.3% |
56.9% |
|
Total |
59.4% |
56.0% |
Notes
- In the last 12 months.
- `Older Australians’ refers to people aged 55 and over.
According to the 2019–20 ABS Patient Experience Survey, over half of older Australians who visited a dental professional in the last 12 months had between 2 to 3 dental visits (52%), with 35% having one visit and 13% having 4 or more (ABS 2020).
Publicly funded dental care is targeted towards low-income groups, with aged pensioners and unemployed people eligible for services at minimal or no cost to the patient. Waiting times for services, and their availability, can be problematic and lead to poorer outcomes for people reliant on these services. According to the 2019–20 ABS Patient Experience Survey:
- 1 in 7 (14%) older people aged 65 and over received public dental care.
- 1 in 12 (8.3%) older people were placed on a public dentistry waiting list (ABS 2020).
The cost of dental services is often reported as a barrier to accessing services. In 2017–18, of people aged 75 and over:
- 22% avoided or delayed dental care due to cost.
- 18% reported they would have difficulty paying a $200 dental bill.
- 9.8% reported cost prevented dental treatment (AIHW 2021b).
For more information, such as to compare with younger age groups or explore financial barriers to dental care by selected characteristics, see Oral health and dental care use in Australia.
Hospitals
Emergency departments
Emergency departments (EDs) are an essential component of Australia’s health care system. Many of Australia’s public hospitals have purpose-built EDs, staffed 24 hours a day, providing care for patients who require urgent medical, surgical or other attention. Between February and June 2020, a number of travel, business, social interaction and border control restrictions were introduced to prevent and reduce the spread of COVID-19. A number of other changes during this time may have impacted ED health care, and the provision of health-care services more generally. Compared with 2018–19, ED presentations in 2019–20 decreased by 1.4% (AIHW 2020d).
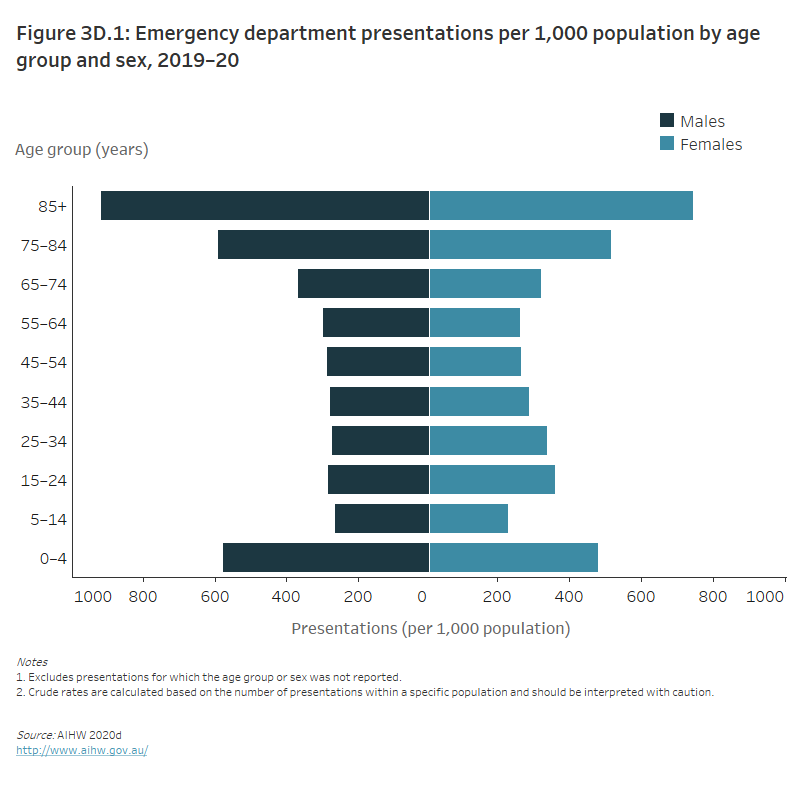
In 2019–20, older people – who made up about 16% of the population – accounted for 22% (1.8 million ED presentations) of the 8.2 million ED presentations over the year. Across the older age groups, men had higher rates of presentation than women, with ED presentations per 1,000 population, respectively, of:
- 366.2 compared with 320.3 for those aged 65–74
- 589.8 compared with 516.1 for those aged 75–84
- 918.7 compared with 744.7 for those aged 85 and over (AIHW 2020d).
Taking account of the size of the population, presentations were highest for men and women aged 85 and over (Figure 3D.1).
Figure 3D.1: Emergency department presentations per 1,000 population by age group and sex, 2019–20
The butterfly chart shows that emergency department presentations are highest among older age groups. The highest numbers of emergency department presentations for men and women were in older people aged 85 and over (918.7 presentations per 1,000 men and 744.7 presentations per 1,000 women).
Patients presenting at EDs are triaged into 1 of 5 categories on the Australasian Triage Scale. For older people, most ED presentations in 2019–20 were of an urgent or semi-urgent nature:
- 44% (808,800 presentations) were assigned to the urgent triage category
- 29% (532,100) were semi-urgent
- 19% (354,600) were emergency
- 5.7% (104,100) were non-urgent
- 1.3% (23,800) were resuscitation (AIHW 2020d).
While a similar percentage of ED presentations in 2019–20 for people aged 45–64 was of an urgent or semi-urgent nature (72% compared with 74% for older people), the split between urgent and semi-urgent presentations differed:
- 37% (624,700 presentations) were assigned to the urgent triage category
- 35% (583,600) were semi-urgent
- 17% (294,900) were emergency
- 10% (168,000) were non-urgent
- 0.9% (15,500) were resuscitation (AIHW 2020d).
In 2019–20, the top 3 reasons for people aged 65 and over presenting to an ED were:
- symptoms, signs and abnormal findings
- injury and poisoning
- cardiovascular diseases (such as heart disease and stroke) (AIHW 2020d).
Following an ED presentation in a public hospital, 1 in 2 of those aged 65 and over (54% or almost 1.0 million people) were admitted to hospital (AIHW 2020d).
COVID-19 and hospitalisations
In 2019–20, there were 2,600 hospitalisations involving a COVID-19 diagnosis. Around 1 in 3 (33%) of these hospitalisations were for an older person (aged 65 and over). Of hospitalisations for an older person involving a COVID-19 diagnosis:
- More than 1 in 8 (13%) involved an intensive care unit (ICU) stay.
- Around 1 in 9 (11%) had a separation mode indicating the patient died in hospital.
- Around 1 in 10 (9.4%) involved continuous ventilatory support.
In comparison, of hospitalisations for a person aged 25–64 involving a COVID-19 diagnosis:
- Around 1 in 13 (7.5%) involved an ICU stay.
- Around 1 in 25 (3.7%) involved continuous ventilatory support.
- Around 1 in 200 (0.6%) had a separation mode indicating the patient died in hospital.
For more information, see Admitted patient activity (AIHW 2020a).
Hospitalisations
In 2019–20, older people (aged 65 and over) were more likely to be hospitalised than younger age groups. For older people, the rate of hospitalisations per 1,000 population ranged from 981 to 1,469, compared with hospitalisation rates for age groups 0–64 ranging from 84 to 598 per 1,000 population (AIHW 2020a). Older men were more likely to be hospitalised than older women, with hospitalisation rates per 1,000 population, respectively, of:
- 1,089 compared with 878 for those aged 65–74
- 1,689 compared with 1,241 for those aged 75–84
- 1,814 compared with 1,255 for those aged 85 and over.
During 2019–20, older people had:
- 4.8 million hospitalisations with over half (56%) in public hospitals (39% of the total 11.1 million)
- 2.7 million same-day hospitalisations (43% of the total 6.4 million)
- 1.6 million overnight hospitalisations (41% of the total 3.8 million) (AIHW 2020a).
In 2018–19, the main reason older people went to hospital was other factors influencing their health status (this includes examinations, investigations, observation, evaluation and other health management), followed by cancer and musculoskeletal conditions (AIHW 2020b) (Table 3D.3).
| Males | Females | Total | |
|---|---|---|---|
|
1 |
Other factors influencing health status |
Other factors influencing health status |
Other factors influencing health status |
|
2 |
Cancer |
Musculoskeletal system diseases |
Cancer |
|
3 |
Diseases of the circulatory system |
Symptoms, signs and abnormal findings |
Musculoskeletal conditions |
Note: `Older people’ refers to people aged 65 and over.
Source: AIHW 2020b.
Between 2015–16 and 2019–20, hospitalisations for people:
- aged 65–74 increased by 11% – an average increase of 2.7% each year
- aged 75–84 increased by 12% – an average increase of 3.0% each year
- aged 85 and over increased by 5.1% – an average increase of 1.3% each year (AIHW 2020a).
The increase for older people aged 75–84 was the largest across all age groups. All age groups under 25 saw a decrease in hospitalisations between 2015–16 and 2019–20 (AIHW 2020a).
At the end of a hospitalisation, most older people are discharged to their place of usual residence, while some enter residential aged care. Excluding those whose usual place of residence was residential aged care, less than 2% of hospital separations (76,200 in 2016–17) for older people were to residential aged care (AIHW 2019).
Hospitals and aged care
Using a linked data set for Queensland and Victoria, in 2016–17, 1 in 10 (10%) overnight hospital stays for older people involved higher levels of aged care use after hospital than before it, and the percentage increased regardless of what aged care program had been used before the hospital stay (AIHW 2020f).
Overall, hospital stays that originated for those already using aged care (community-based aged care, transition care and residential aged care) were more likely to be somewhat longer than hospital stays without preceding aged care use. The median length of stay for overnight hospital stays was under one week for all but those hospital stays that were preceded by transition care (AIHW 2020f).
For more information, see Interfaces between the aged care and health: movements between aged care and hospital 2016–17 and GEN Aged Care Data website.
Potentially preventable hospitalisations
Potentially preventable hospitalisations (PPHs) can be used as a measure to assess the effectiveness of primary care such as GPs. PPHs are specific hospital admissions that potentially could have been prevented by timely and adequate health care in the community. Older people, along with Indigenous Australians and people who live in remote or disadvantaged areas, are more likely to be hospitalised for potentially preventable reasons; for more information see Disparities in potentially preventable hospitalisations across Australia: exploring the data.
In 2017–18, nearly half (46%) of PPHs were for people aged 65 and over. Among this age group, the most common reasons for hospitalisation included chronic obstructive pulmonary disease (COPD), congestive cardiac failure and urinary tract infections (AIHW 2020c).
For more information on hospital use, see MyHospitals.
Pharmaceutical use
In 2017–18, Pharmaceutical Benefits Scheme (PBS) prescriptions were dispensed to 17.0 million Australians of all ages (69% of the population). Population dispensing rates increased with age:
- Young people aged 0–14 had the lowest rates of dispensed prescriptions (173 per 100 people).
- The highest rates were among those aged 85 and over (6,077 prescriptions per 100 people).
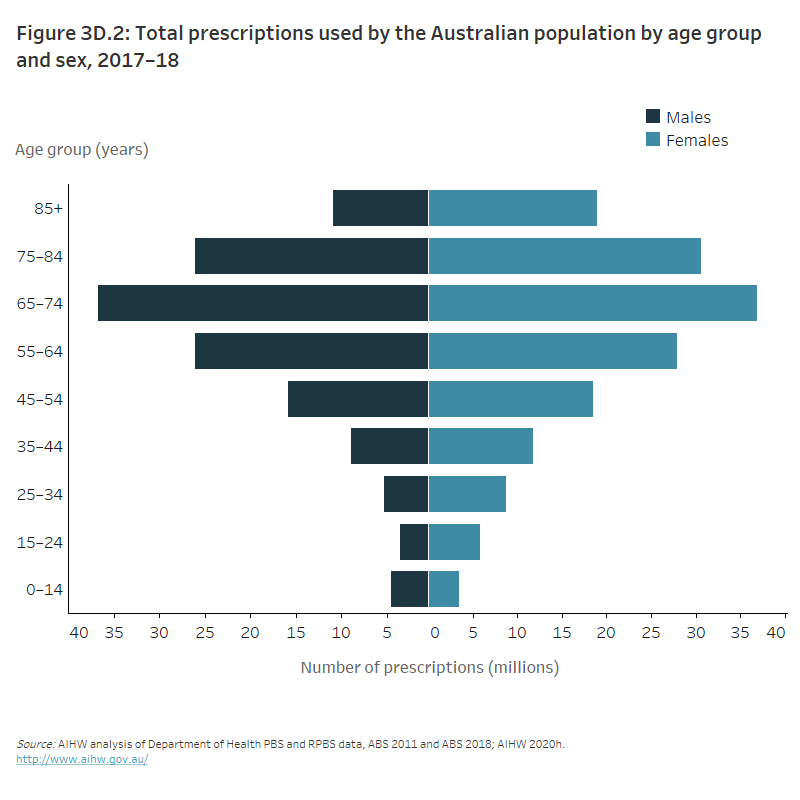
Among older Australians (aged 65 and over), similar prescription patterns were seen for both men and women (Figure 3D.2).
Over half of PBS and Repatriation Schedule of Pharmaceutical Benefits medicines were dispensed to people aged 65 and over (53%). Within specific age groups, people aged 65–74 had the highest number of dispensed prescriptions and accounted for the highest Australian Government expenditure on subsidised prescription pharmaceuticals (AIHW 2020h).
Figure 3D.2: Total prescriptions used by the Australian population by age group and sex, 2017–18
The butterfly chart shows that a large number of dispensed prescriptions are for older Australians aged 65 and over. The greatest number of prescriptions for men and women was for people aged 65–74 (approximately 74 million prescriptions in total).
Antipsychotic medicines
Antipsychotic medicines are used to manage psychotic disorders such as schizophrenia, and the psychotic symptoms of mood disorders. While these medicines may be appropriate for adults with severe mental health issues or long‑term mental illness, there is concern that they are being prescribed inappropriately for people aged 65 and over for their sedative effects; that is, as a form of chemical restraint for people with psychological and behavioural symptoms of dementia or delirium (ACSQHC 2018).
Analysis of data from 2013–14 to 2016–17 suggests there has been little change in the overall use of antipsychotic medications by older people during those 4 years. Whilst prescriptions have decreased over these 4 years, the volume of these medicines supplied on any given day has remained relatively stable (ACSQHC 2018). Whether parts of the older population are more at risk of such medication is still to be seen.
For more information, see Fourth Australian Atlas of Healthcare Variation.
Palliative care
The World Health Organization (WHO) describes palliative care as an approach that improves the quality of life of patients and their families facing the problems associated with life-limiting illness, through the prevention and relief of suffering (WHO 2020). This involves early identification and correct assessment and treatment of pain and other problems, physical, psychosocial and spiritual (AIHW 2021c).
In 2018–19, there were 64,100 palliative care-related hospitalisations reported from public acute and private hospitals in Australia for people aged 65 and over. Almost 3 in 5 (57%, 36,800 hospitalisations) of these were palliative care and 27,300 were other end-of-life care hospitalisations. Older people accounted for 3 in 4 of the total palliative care hospitalisations (77%) and of the total other end-of-life care hospitalisations (77%). The average patient age at admission was 73.9 for palliative care hospitalisations and 74.1 for other end-of-life care hospitalisations. This was considerably older than the average age at admission of 56.0 for hospitalisations for all reasons (AIHW 2021c).
Palliative care-related services provided by palliative medicine specialists are included in the MBS. Of these MBS-subsidised services processed in 2019–20 (services may have been provided in a different year), 3 in 4 (74%) patients were older people (aged 65 and over) and 3 in 4 services (75%) were to older people. People aged 65–74 had the highest number of services per person (5.5) (AIHW 2021c).
Palliative care can be provided in other settings, such as at home and in hospices outside of the hospital system. Based on Palliative Care Outcomes Collaboration data from 2019, 3 in 4 (77%) palliative care episodes in community settings were for older people (aged 65 and over) (AIHW 2021).
Palliative care can also be provided in residential aged care. Data on palliative care in residential aged care comes from claims using the Aged Care Funding Instrument (ACFI). The ACFI is used to determine Australian Government subsidies for people living in permanent residential aged care and there are limitations in using these data. It is accepted that the number of ACFI claims involving palliative care is lower than the number of recipients in residential aged care that require palliative care (AIHW 2021c). For more information on the context for interpreting palliative care data from the ACFI, see Palliative care services in Australia.
In 2019–20, 1 in 77 aged care residents had an ACFI appraisal indicating a need for palliative care (1.3%). This need increased with age; 1 in 15 appraisals indicating a need for palliative care were for people aged under 70 (6.7%), and around 1 in 2 were for people aged 85 and over (55%). While around 1 in 3 people in residential aged care were male (35%), 1 in 2 appraised needs for palliative care were for males (51%) (AIHW 2021c).
Health service use by older people with dementia in their last year of life
A recent AIHW study provides a greater understanding of health service use by people with dementia in their final year of life (12 months before 2013). It found that in the last year of life of people who died aged 65 or over, GP services were the most common health service type, used by 90% of people with and without dementia. Other than GP services, people with dementia who died aged 65 or over used health services less in their last year of life than people without dementia. The greatest difference was seen in the use of specialist services. Women with dementia were found to have used health services the least (AIHW 2020j).
The report also showed that in their last year of life, for people with dementia who died aged 65 or over:
- 66% had a hospital admission
- an average of 21 GP services were used
- an average of 59 prescriptions were dispensed (AIHW 2020j).
For more information, see Patterns of health service use by people with dementia in their last year of life: New South Wales and Victoria.
Where do I go for more information?
For more information on older people’s health service use, see:
- AIHW Australia’s health
- AIHW Australia’s welfare
- AIHW Cancer screening
- AIHW Dementia in Australia compendium
- AIHW Palliative care services in Australia
Information about health conditions can be found on the page Health – selected conditions.
ABS (Australian Bureau of Statistics) 2020. Patient Experiences in Australia: Summary of findings, 2019–20. ABS cat. no. 4839.0. Canberra: ABS. Viewed 2021.
ACSQHC (Australian Commission on Safety and Quality in Health Care) 2018. Atlas of Healthcare Variation: 5.5 Antipsychotic medicines dispensing, 65 years and over. Viewed 27 September 2021.
AIHW (Australian Institute of Health and Welfare) 2019. Older Australia at a glance. Cat. no. AGE 87. Canberra: AIHW. Viewed 15 November 2021.
AIHW 2020a. Admitted patients 2019–20. Canberra: AIHW. Viewed 9 June 2021.
AIHW 2020b. Australia’s hospitals at a glance 2018–19. Cat. no. HSE 247. Canberra: AIHW. Viewed 2021.
AIHW 2020c. Disparities in potentially preventable hospitalisations across Australia, 2012-13 to 2017-18. Cat. no. HPF 50. Canberra: AIHW. Viewed 2021.
AIHW 2020d. Emergency department care . Canberra: AIHW. Viewed 9 June 2021.
AIHW 2020e. Health of older people. Canberra: AIHW. Viewed 8 April 2021.
AIHW 2020f. Interfaces between the aged care and health systems in Australia—movements between aged care and hospital 2016–17. Cat. no. AGE 104. Canberra: AIHW. Viewed 2021.
AIHW 2020g. Medicare-subsidised GP, allied health and specialist health care across local areas: 2013–14 to 2017–18. Cat. no. PHC 4. Canberra: AIHW.
AIHW 2020h. Medicines in the health system. Canberra: AIHW. Viewed 8 April 2021.
AIHW 2020i. Non-admitted patients 2019–20. Canberra: AIHW. Viewed 9 June 2021.
AIHW 2020j. Patterns of health service use by people with dementia in their last year of life: New South Wales and Victoria. Cat. no. AGE 102. Canberra: AIHW. Viewed 2021.
AIHW 2020k. Primary health care. Canberra: AIHW. Viewed 8 April 2021.
AIHW 2021a. Mental health services in Australia. Canberra: AIHW. Viewed 30 March 2021.
AIHW 2021b. Oral health and dental care in Australia. Cat. no. DEN 231. Canberra: AIHW.
AIHW 2021c. Palliative care services in Australia. Viewed 9 June 2021.
Van Gaans D & Dent E 2018. Issues of accessibility to health services by older Australians: a review. Public Health Reviews 39:20. Viewed 2021.
Services Australia 2021. Medicare Australia statistics, MBS Group by patient demographics reports. Canberra: Services Australia. Viewed 8 June 2021.