Age at death
In 2021, there were 171,469 deaths registered in Australia (89,401 males; 82,068 females). The majority of deaths in Australia, like other developed countries, occur among older people (Figure 2.1). Sixty-seven per cent of deaths registered in Australia in 2021 were among people aged 75 or over (61% for males and 73% for females). The median age at death was 79 years for males and 85 years for females (Table S2.1).
Figure 2.1: Deaths in Australia by sex and age group, 2021
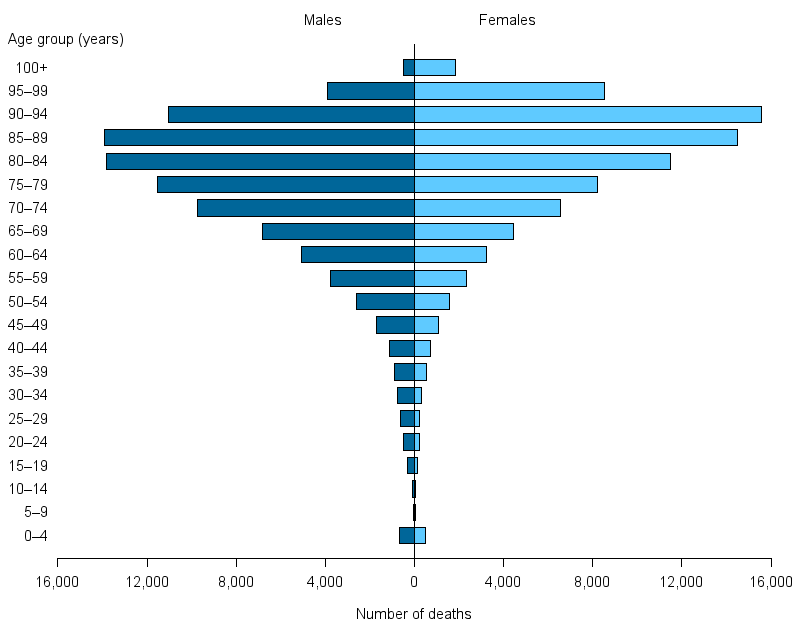
Source: AIHW National Mortality Database; Table S2.1.
Child deaths
Deaths in early childhood have reduced substantially over the past 100 years. In 1907, child deaths (aged 0–4 years) accounted for 26% of all deaths compared to 0.7% in 2021.
Child death rates presented here are calculated as the number of deaths among young children (aged 0–4) divided by the population of the same age and expressed as per 100,000 population.
In 2021, there were 77 child deaths per 100,000 population – 16% lower than a decade earlier (2011) and 97% lower than in 1907 when recording began (Figure 2.2). The death rate was higher for boys than girls (84 and 70 deaths per 100,000 population respectively).
The drop in child deaths in Australia mostly reflects a decline in infant deaths (aged less than 1), which is linked to:
- improved access to and quality of neonatal health care
- increased community awareness of risk factors for infant and child deaths
- improved sanitation and hygiene
- reductions in vaccine-preventable diseases through universal immunisation programs.
Figure 2.2: Child (aged 0–4) death rates in Australia by sex, 1907–2021
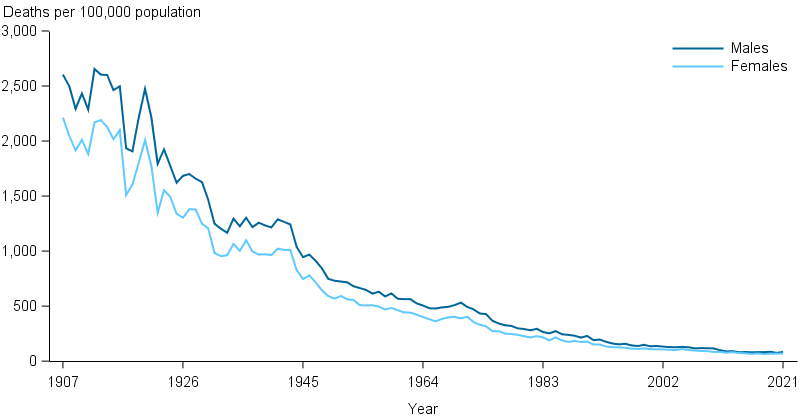
Source: AIHW National Mortality Database; Table S2.2.
Other measures of deaths in early childhood and infancy are also commonly used to describe the health status of a population:
- Infant mortality rate is defined as the number of deaths of infants (aged less than 1) divided by the number of live births (and usually expressed per 1,000 live births). For more information on infant deaths, see Australia's Children.
- Perinatal deaths are deaths of babies who die before birth (stillbirth or fetal death) or within the first 28 days of life (neonatal deaths). For more information on perinatal deaths, see Mothers and babies.
- Under-five death rates are defined as the number of child (aged 0–4) deaths divided by the number of live births, rather than dividing by the population aged 0–4, and expressed per 1,000 live births. For more information on under-five deaths, see World Health Organization.
Potentially avoidable deaths
Potentially avoidable deaths are deaths among people younger than 75 that are potentially avoidable within the present health care system. They include deaths from conditions that are potentially preventable through individualised care and/or treatable through existing primary or hospital care.
In 2021, there were 26,967 potentially avoidable deaths: half (48%) of all deaths for people aged less than 75. Of these deaths, 63% were male and 37% were female.
Potentially avoidable age-standardised death rates fell by 41% between 2001 and 2021 (from 162 to 96 deaths per 100,000 population). While the rates among both males and females have decreased (by 41% and 40% respectively) in the past 20 years (from 210 to 124 deaths per 100,000 males and from 114 to 68 per 100,000 females), rates of potentially avoidable deaths have consistently remained higher among males than females throughout this period (Figure 2.3).
Figure 2.3: Age-standardised death rates of potentially avoidable deaths in Australia among people aged less than 75 by sex, 1998–2021
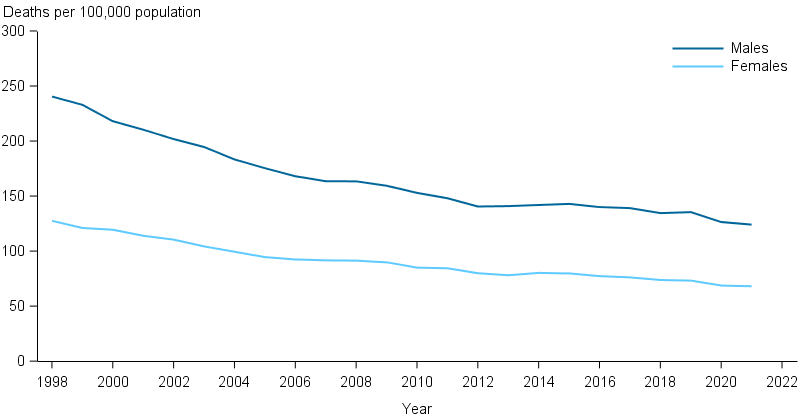
Source: AIHW National Mortality Database; Table S2.3.
Potentially avoidable deaths are classified using nationally agreed definitions based on cause of death for people aged less than 75. Historical data may differ from previous reports as the nationally agreed revisions to the definition of potentially avoidable deaths in 2021 have been applied.
Data on potentially avoidable deaths by small geographical areas are available as an indicator within the Australia's health performance framework and the AIHW Mortality Over Regions and Time (MORT) books.
Potential years of life lost
Premature deaths can be summarised in terms of potential years of life lost (PYLLs). This measure considers only deaths that occur before a specified arbitrary age. For example, if dying before the age of 75 is considered premature then a person dying at age 40 would have lost 35 potential years of life.
Using the age of 75 as the cut-off, there were 893,170 PYLLs in Australia in 2021. This is 43% lower than the PYLLs in 1907 (1,576,383 PYLLs). Expressed another way, in 1907 there were 382 PYLLs per 1,000 population and in 2021 this figure was 38 PYLLs per 1,000 population; a decrease of 90%.
Males are more likely than females to experience premature death, however, the difference between the sexes is narrowing (Figure 2.4). In 1980, there were 109 PYLLs per 1,000 males compared to 58 PYLLs per 1,000 females: a difference of 51 PYLL per 1,000. This gap decreased to 29 PYLL in 2000 (66 PYLLs per 1,000 males and 37 PYLLs per 1,000 females) and 19 PYLL in 2021 (47 PYLLs per 1,000 males and 28 PYLLs per 1,000 females).
Figure 2.4: Potential years of life lost in Australia by sex, 1907–2021
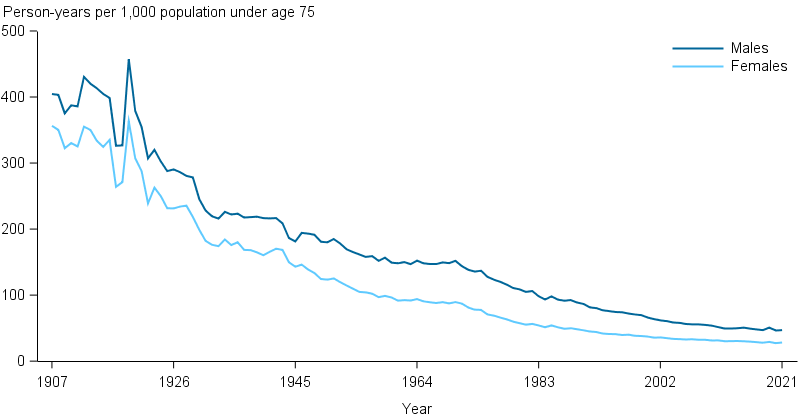
Source: AIHW National Mortality Database; Table S2.4.
PYLLs can be used to estimate the burden of mortality, which is the loss associated with early death. On this basis it is sometimes used as an indicator of the social and economic impact of premature deaths. Burden of disease measures include a component of years of life lost that is weighted according to the remaining life expectancy at that age of death, rather than using the age of 75 as the cut-off.
For more information, see Burden of disease.