Open the following sections for summary information and explore more detailed information via the links at the bottom of the page.
Admitted patient care hospitalisations in public and private hospitals
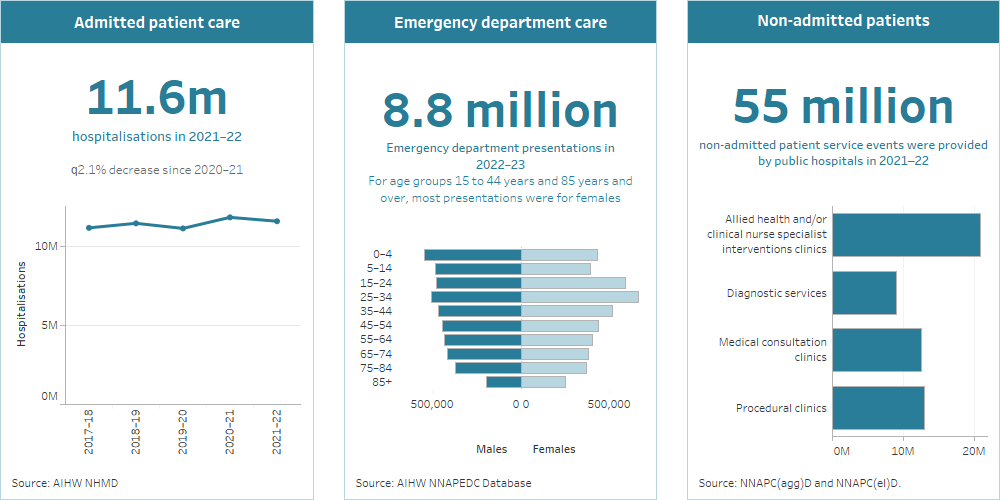
In 2022–23:
- there were 12.1 million hospitalisations, a 4.6% increase from 11.6 million in 2021–22
- there were 33.2 million days of patient care, a 4.5% increase from 31.8 million in 2021–22
- 59% (7.1 million) of hospitalisations were in public hospitals, accounting for 69% of days of patient care (22.8 million)
- 41% (5.0 million) of hospitalisations were in private hospitals, accounting for 31% of days of patient care (10.4 million)
- 63% (7.7 million) of hospitalisations were same-day and 37% (4.4 million) included an overnight stay.
For more information, see the Admitted patient care activity page.
Emergency department presentations
In 2022–23, there were 8.80 million presentations (24,100 daily average) to public hospital emergency departments, slightly more than in 2021–22 (8.79 million) – an increase of 0.1%.
From 2020–21 to 2021–22, presentations to emergency department decreased by 0.2% after an increase of 6.9% between 2019–20 and 2020–21. Overall, emergency department presentations have increased from 330 per 1,000 population in 2018–19 to 334 in 2022–23.
For more information, see the Emergency department care activity page.
Non-admitted patient services
Non-admitted patient services are provided by outpatient clinics in Australia’s public hospitals. These services include patients attended to by specialist medical practitioners or allied health practitioners or having diagnostic or other procedures.
In 2022–23, 41.1 million services were provided in outpatient clinics. Of these:
- Allied health and/or clinical nurse specialist intervention clinics provided 48% (19.6 million)
- 31% (12.8 million) were provided in Medical consultation clinics
- Diagnostic services clinics provided 13% (5.3 million)
- 8.1% (3.3 million) were provided in Procedural clinics.
For more information, see the Non-admitted patient care activity page.
Admissions from elective surgery waiting lists
In 2022–23, the number of admissions from elective surgery waiting lists was higher compared with the last reporting year and lower than five years ago.
In 2022–23:
- 735,500 patients were admitted for surgery from public hospital elective surgery waiting lists – an 18.1% increase compared with 2021–22, and 0.8% decrease compared with 2018–19
- the most common types of elective surgery after being on a waiting list were for general surgery (20%), urological surgery (15%) and ophthalmology surgery (14%).
For more information, see the Elective surgery activity page.