
Our working lives
Being employed provides income, but it also has important benefits for a person's health, social and emotional wellbeing. For example, having a job can help a person to stay connected with society, develop skills and provide a sense of self-worth.
Not having a job can negatively affect an individual's feelings of self-worth, their skill development or retention (further reducing employability) and their connection with society. It is also an important consideration in providing welfare services and supports.
Almost three-quarters (72%) of people aged 15-64 were employed in 2017, with rates higher for males than females:
- 77% males
- 67% females
The unemployment rate was much higher for young people than for all people in the labour force, with 12.6% of 15–24 year-olds unemployed in 2016:
- 5.7% people in labour force
- 12.6% young people
Nearly one-third of jobs are part time
The Australian labour market has undergone substantial changes over the past 50 years. One of the biggest changes has been the rise of part-time work—31% of all jobs in 2016 involved part-time hours, compared with just 10% in 1966.
Part-time employment in Australia is high by international standards. Of all countries in the Organisation for Economic Co-operation and Development, only the Netherlands and Switzerland had higher rates of part-time employment than Australia in 2015.
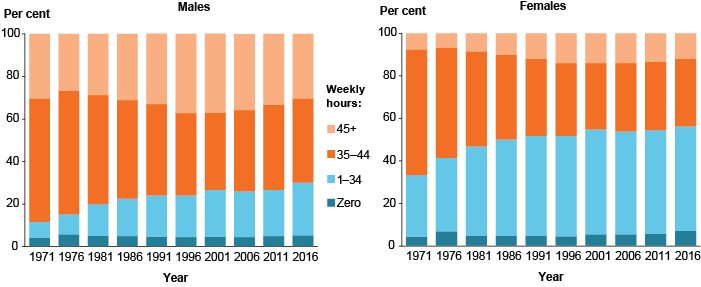
Fewer employed people are working a 'standard length' week (35-44 hours), and both males and females are more likely to work part-time hours than in the past. For example, the proportion of employed males working part time more than tripled between 1971 and 2016 (from 7.4% to 25%).
Composition of employment by weekly hours actually worked, by sex, 1971–2016
Find out more: Chapter 4.1 ‘The changing nature of work and worker wellbeing’ in Australia’s welfare 2017.
Working-time mismatch and job security affects worker wellbeing
The underemployment rate is at its highest level since the 1970s, accounting for 9.3% of all employed people. However, this rise has been offset by a decline in overemployment.
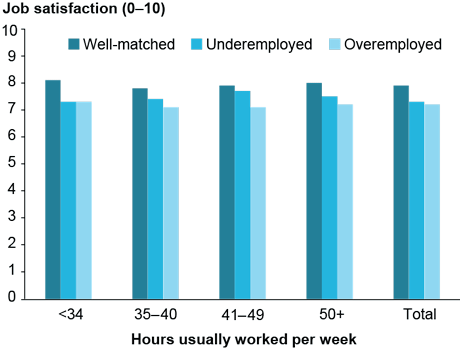
Our wellbeing does not vary much with the number of hours we usually work in a week. What really matters is whether the number of hours worked aligns with our preferences for how long we want to work. Underemployed and overemployed workers report lower levels of life and job satisfaction, and worse mental health, than people whose work hours are matched with their preferences. For example, for job satisfaction, underemployed and overemployed workers had mean scores of 7.3 and 7.2 (on a 10-point satisfaction scale) respectively, compared with 7.9 for people who were well matched.
’Underemployed’—the proportion of employed people who are part-time workers who want to work more hours than they do or full-time workers who work less than 35 hours a week due to economic reasons.
‘Overemployed’—employed people who want to work fewer hours each week than they currently do, as a proportion of all employed people.
Job satisfaction (mean scores), by usual weekly hours worked and working-time mismatch, 2001 to 2015 (pooled)
Workers who perceive their jobs to be secure (regardless of their contractual arrangement; for example whether they are permanent or casual) report not only much higher satisfaction with job security, but also higher levels of job and life satisfaction and better mental health.
Find out more: Chapter 4.1 'The changing nature of work and worker wellbeing' in Australia's welfare 2017.
Education is key for employment
Jobs are increasingly becoming higher skilled. In turn, this is increasing the demand for a more educated and qualified workforce. In 2016, 2 in 3 (66%) people in the labour force had a non-school qualification, compared with 36% in the late 1970s.
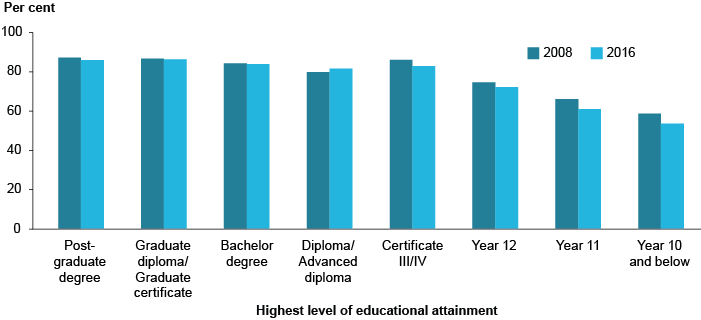
In 2016, people with higher levels of educational attainment were more likely to be employed: more than 80% of people with a non-school qualification were employed compared with 54% of people whose highest qualification was Year 10 or below.
There was generally no change over time in the proportion of those with higher levels of education who were employed; however, people with lower levels of educational attainment (particularly Year 12 or below) were less likely to be employed in 2016 than they were in 2008.
Employment rate by highest level of education, 2008 and 2016
Find out more: Chapter 4.2 ‘Key employment trends’ in Australia’s welfare 2017.
Seniors' workforce participation more than doubled over 30 years
Australians are living longer than in the past, and many remain healthy and active past retirement age. This means they can continue to work, or re-enter the workforce.
The employment rate has increased among people aged 65 and over, from 5.1% in 1986 to 13% in 2016, with the unemployment rate remaining relatively steady at around 1.4%.
Employment rate, people aged 65 and over, by sex, June 1986 to June 2016
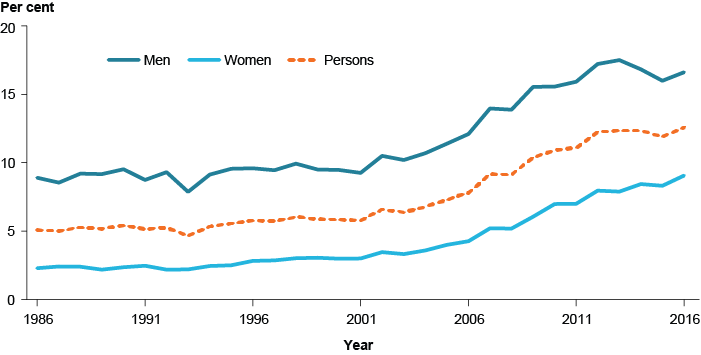
There has also been a growth in part-time work and a decline in full-time work over the last 3 decades for people aged 65 and over. Between 1986 and 2016, the proportion of employed older people working part time increased from 49% to 59%. In 2016, three-quarters (76%) of employed women and nearly half (48%) of employed men aged 65 and over worked part time.
Find out more: Chapter 4.3 ‘Seniors in the workforce’ in Australia’s welfare 2017.
Around one-third of us volunteer, but the rates are declining
Volunteers provide an invaluable service to the community and organisations.
In 2014, there were around 5.8 million people aged 15 and over (or 31% of the population) who had volunteered in the last 12 months. However, the proportion of people who volunteered declined between 2006 and 2014, from 34% to 31%.
In 2014, the proportion of volunteers was highest among people:
- born in Australia (34%)
- aged 15-17 (42%)
- living in Outer regional / Remote areas (39%)
- working part time (38%)
- with a Bachelor degree or above (41%)
- from the highest income households (39%)
Find out more: Chapter 4.4 'Working for free—volunteers in Australia' in Australia's welfare 2017.