How much burden
On this page:
Total burden
Total burden is measured using the summary metric of DALY. In 2019, Australians lost 145,703 years of healthy life due to suicide and self-inflicted injuries, at a rate of 5.7 DALY per 1,000 population (Table S1). This represents around 3% of the total burden of disease and injury in Australia (based on data from the 2018 ABDS).
Three-quarters of the total burden of suicide and self-inflicted injuries in 2019 occurred in males (109,144 DALY) at a rate of 8.7 per 1,000 population, accounting for an estimated 4% of total burden among males. In contrast, suicide and self-inflicted injuries were responsible for 36,558 DALY in females in 2019 at a rate of 2.9 per 1,000, accounting for an estimated 1.5% of total burden among females.
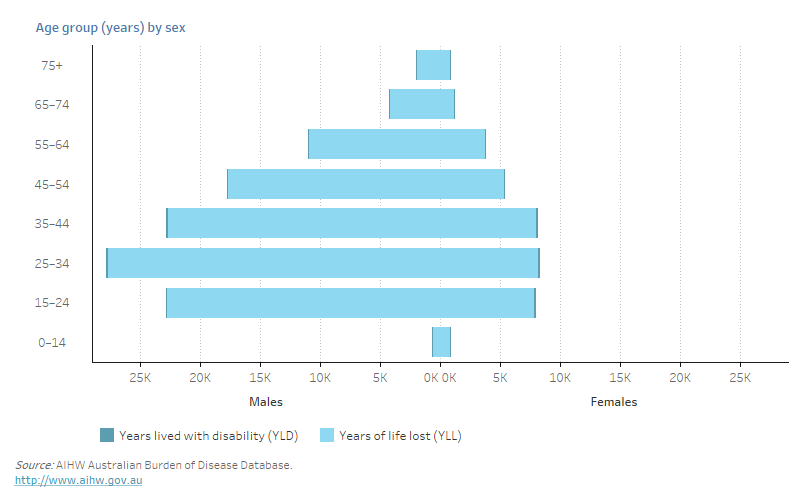
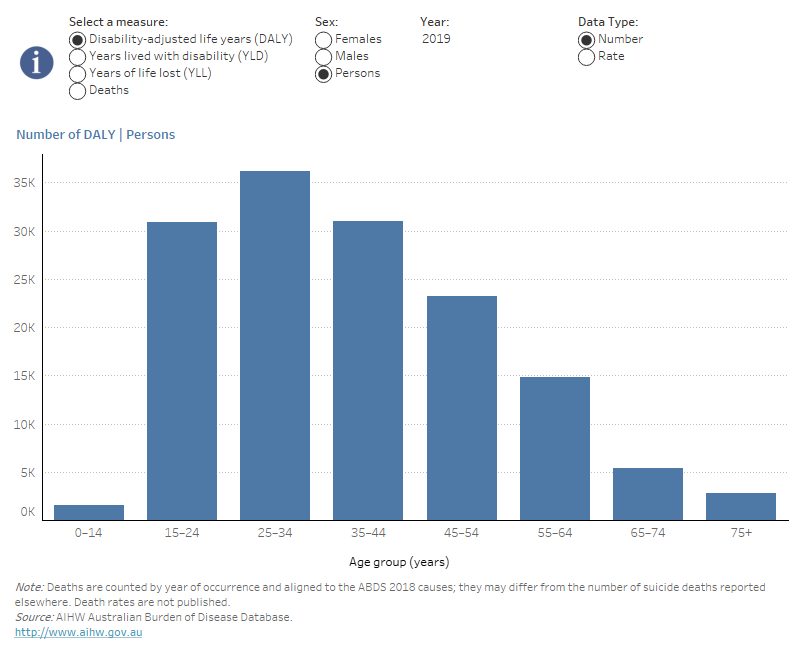
Among those aged 15 and over, males suffered a higher burden (and rate) of suicide and self-inflicted injuries than females in each age group (figures 1 and 2).
Figure 1: Burden (YLL and YLD number) due to suicide and self-inflicted injuries, by age group and sex, 2019
This figure presents the age and sex structure of the overall burden of suicide and self-inflicted injuries in Australia in 2019. It compares the proportion and number of fatal and non-fatal burden by sex and age groups. Males have a higher burden of suicide and self-inflicted injuries compared to females for all age groups among those aged 15 years and over.

Overall, the proportion of total burden due to suicide and self-inflicted injuries was highest among people aged 25–34 (25%), followed by those aged 15–24 and 35–44 (both 21%).
Fatal burden represented almost all (99%) of the total burden due to suicide and self‑inflicted injuries in 2019. Non-fatal burden represented 0.9% of total burden and was slightly higher for females and those aged 25–34 (figures 1 and 2).
Figure 2: Number and rate of burden (DALY, YLL, YLD and deaths) due to suicide and self-inflicted injuries, by age group and sex, 2003, 2011, 2015, 2018 and 2019
Figure 2 presents the number and age-specific rate of total, fatal and non-fatal burden and the number of deaths by sex and age group in each reference year from 2003 to 2019. For each year and sex, a bar chart is used to describe the pattern of total, fatal and non-fatal burden by age group, while a line chart displays the age-specific rates of total, fatal and non-fatal burden. In 2019, total burden of suicide and self-inflicted injuries was highest among those aged 25–34, after that, the total burden of suicide and self-inflicted injuries decreased with increasing age.

Fatal burden
Fatal burden, known as ‘years of life lost’ (YLL), is measured against an ideal life expectancy.
Suicide and self-inflicted injuries were responsible for 144,407 years of life lost due to premature death in 2019. It is estimated to account for around 6% of the total fatal burden of disease and injury in Australia (based on 2018 ABDS data). When compared with other diseases and injuries using data from the 2018 ABDS, suicide was the third leading cause of fatal burden (second for males) and the leading cause of fatal burden for males and females aged 15–44 (AIHW forthcoming 2021a).
Total YLL for suicide equated to a crude rate of 5.7 YLL per 1,000 population in 2019 (Table S1). The average number of years of life lost per death due to suicide in 2019 was 41.8 years, which was lower than the average of 44.3 years in 2003 (Table S2). These data were similar by sex: males lost an average of 41.9 years due to dying from suicide and self‑inflicted injuries in 2019 compared with 44.4 in 2003, and females lost an average of 41.6 years in 2019 compared with 43.7 in 2003. This suggests that the average age for suicide deaths is increasing over time (as fewer years of life are lost the older one gets and the closer they are to the ideal life expectancy).
The age and sex pattern of fatal burden due to suicide reflects that for the total burden due to suicide and self-inflicted injuries; that is, 75% of fatal burden occurred in males and both the YLL number and rate were highest among those aged 25–34 (Figure 1).
Non-fatal burden
Non-fatal burden, known as ‘years lived with disability’ (or YLD), is measured using information on incidence, prevalence, duration and severity of the disease or injury. YLDs for suicide and self-inflicted injuries are primarily based on data from the NHMD and the NNAPEDCD, which are weighted for severity (AIHW forthcoming 2021b). As not all suicide attempts and cases of self-harm are reported in these 2 databases, estimates of the non-fatal burden of suicide and self-inflicted injuries reported here are likely to be underestimates.
In 2019, Australians lost 1,296 years of healthy life (YLD) due to living with the impact of suicide and self-inflicted injuries. This equated to a crude rate of 0.05 YLD per 1,000 population (Table S1). It is estimated that suicide and self-inflicted injuries accounted for 0.05% of all non-fatal burden in Australia (based on 2018 ABDS data).
Contrasting with fatal burden, 55% of non-fatal burden occurred in females (711 YLD) compared with 45% in males (585 YLD).
By age, non-fatal burden was highest in those aged 25–34 (314 YLD; 24% of YLD due to suicide and self-inflicted injuries) followed by those aged 15–24 (307 YLD; 24%) (Figure 1).


