Australian Capital Territory
A range of health data sets were utilised to assess the effects of the 2019–20 bushfire season on respiratory health, including Pharmaceutical Benefits Scheme (PBS) and IQVIA (privately provided pharmaceutical sales) data.
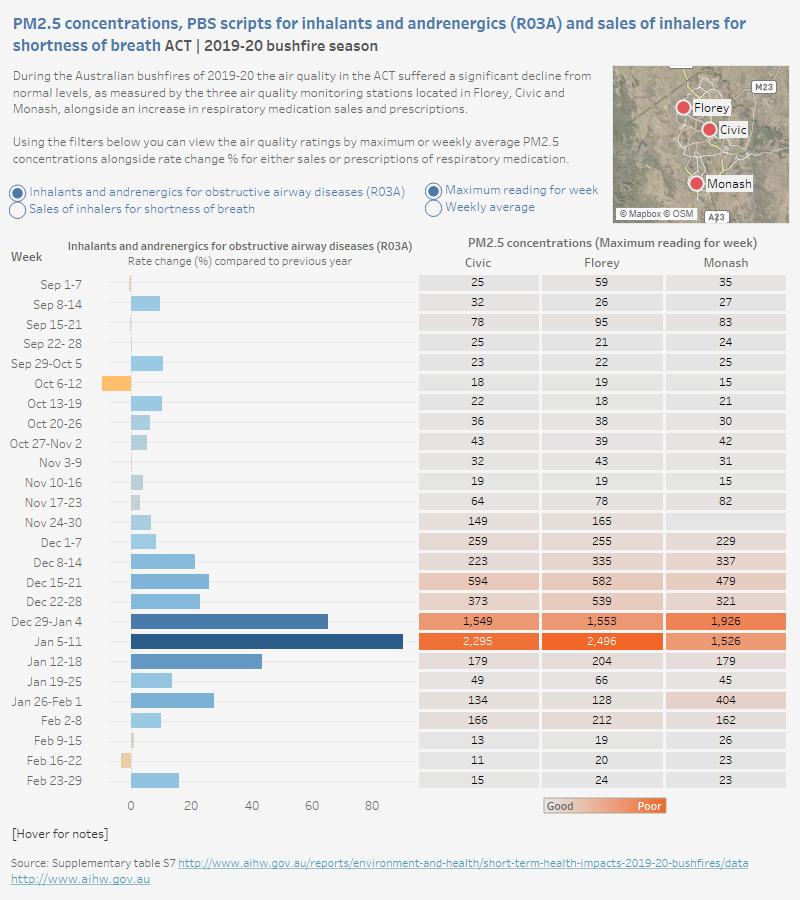
For the Australian Capital Territory, detailed air quality data from three monitoring stations were also utilised. The interactive graphs below allow you to explore how rates of respiratory-related prescription dispensing and sales of inhalers for shortness of breath (prescription and over-the-counter) changed over each week of the bushfire period, compared with rates from the previous year. Air quality data (PM2.5) are also shown.
You can explore different aspects of the data by selecting either PBS respiratory-related prescriptions dispensed or sales of inhalers for shortness of breath, and by selecting the weekly average or highest measure of air quality (PM2.5).
The figure shows a bar chart of percentage changes in sales of inhalers for shortness of breath or PBS salbutamol prescriptions dispensed in the 2019–20 bushfire season, by week, compared with the same week the previous year. On the right, PM2.5 concentrations in the ACT for each monitoring station (either a weekly average or the highest reading for the week) are displayed in a tile chart for the corresponding weeks in the bushfire season.
Higher PM2.5 readings generally corresponded to larger percent changes in salbutamol prescriptions dispensed (R03A) or sales of inhalers for shortness of breath. Both PM2.5 readings and per cent changes in salbutamol scripts dispensed and sales of inhalers for shortness of breath peaked in the weeks of 29 December 2019–4 January 2020 and 5–11 January 2020. In the week of 5–11 January 2020, a 204% per cent increase of inhalers for shortness of breath sales corresponds with PM2.5 readings of over 2,000 µg/m3 at both the Civic and Florey air quality monitoring stations.


