Feature topic: New clients accessing Specialist Homelessness Services


The characteristics of first-time specialist homeless services (SHS) clients are explored in this feature topic article, specifically, the cohort of new clients who received specialist homelessness services in 2018–19 is compared with the 2022–23 cohort. These two time points compare new clients prior to the COVID-19 pandemic with the post-pandemic cohort experiencing cost of housing pressures.

Key findings

  • Less SHS clients supported in 2022–23 were new clients compared with 2018–19.
  • New clients in 2022–23 had a broadly similar age and sex profile to those in 2018–19.
  • New clients in 2022–23 were more likely to experience homelessness at the start of support and less likely to be housed at the end of their support compared with new clients in 2018–19.
  • Financial difficulties were the most common reason for seeking assistance, however, housing affordability stress has increased as a reason for seeking support among new adult SHS clients.
  • Lone person was the most common usual living arrangement among new SHS clients aged 18 and older at the beginning of support in both 2018–19 and 2022–23.

The data in this feature topic article are mostly drawn from the Specialist Homelessness Services Collection data cubes 2011–12 to 2022–23 (AIHW 2024). For 2022–23 data, to minimise the risk of identifying individuals, a technique known as perturbation was applied to randomly adjust cells with small numbers. For this reason, discrepancies may occur between the sum of component items and totals, and data may not exactly match other published data.

Defining new clients

New clients are defined as clients who have received a service from a Specialist Homelessness Services Collection (SHSC) agency in the financial year for the first time, having never received support in any previous year since the collection began on 1 July 2011.

New SHS clients: 2018–19 compared with 2022–23

Less SHS clients in 2022–23 were new clients, compared with 2018–19.

The number of new clients assisted by specialist homelessness agencies decreased to almost 101,000 (or 37% of all SHS clients) in 2022–23 from 126,000 (43%) in 2018–19; a drop of around 6 percentage points between the two time periods (Figure 1). Similar declines in the proportion of new clients were observed in each state/territory (4–9 percentage point decline; data not shown). It is important to note that the SHSC data provide a measure of the service response directed to those experiencing housing insecurity, and therefore do not provide a measure of the extent of homelessness in the community.

Figure 1: Number of SHS clients by new/returning status and sex, 2018–19 and 2022–23

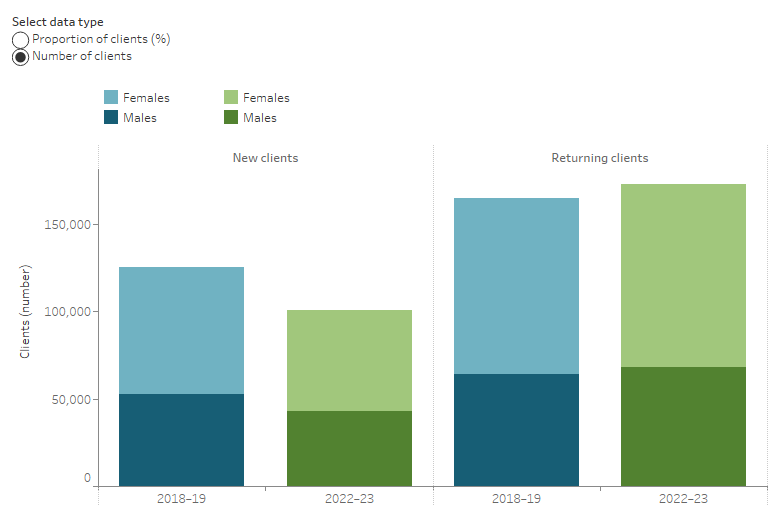
The interactive stacked bar graph shows the proportion of SHS clients by new and returning client status and sex, in both time periods.

Notes:

For 2022–23 data, to minimise the risk of identifying individuals, a technique known as perturbation has been applied to randomly adjust cells. For this reason, discrepancies may occur between sums of the component items and totals, and data may not match other published sources.

Source: Specialist Homelessness Services Collection data cubes 2011–12 to 2022–23 (AIHW 2024).

New clients in both 2018–19 and 2022–23 were more likely to be female than male, consistent with the overall profile of SHS clients (Figure 1). The number of new clients declined nationally, and in all states and territories, for females and males; the number of clients also declined for most age groups, except the older age groups.

Age and sex

New clients in 2022–23 had a broadly similar age and sex profile to new clients in 2018–19.

As a proportion of all clients, the distribution of new clients by age and sex was broadly consistent between 2018–19 and 2022–23 (Figure 2). Among new clients:

  • There were generally more females in all age groups in both time periods, except among those aged under 10.
  • More than one-third were aged under 18 (37% in both time periods); more than 2 in 10 were aged under 10 (22% in both time periods).
  • Among adult age groups, the largest group was aged 25–34; 16% in 2018–19 and 15% in 2022–23.
  • The largest increase in the proportion of new clients by age group was clients aged 65 years and over (4.8% in 2022–23, an increase from 3.6% in 2018–19).

Figure 2: New SHS clients by age and sex, states and territories, 2018–19 and 2022–23

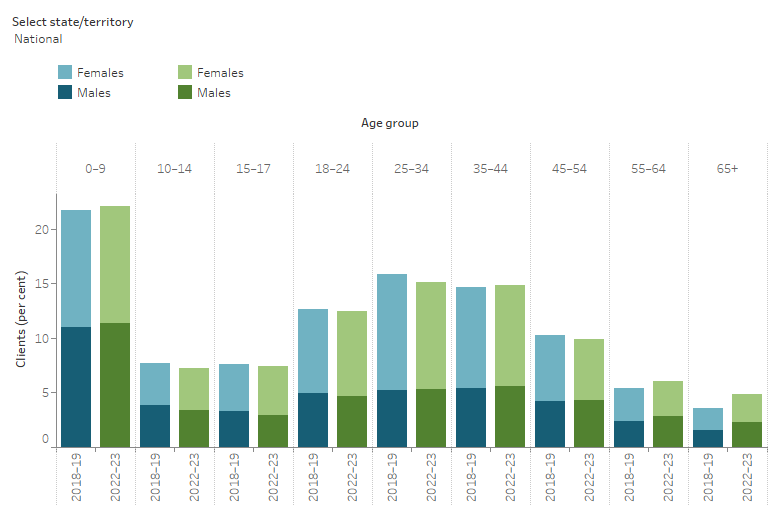
The interactive stacked bar graph shows the proportion of new SHS clients by sex and age group for each state and territory, in both time periods. Clients aged under 10 were the largest group of new clients.

Notes:

Age is not published (n.p.) for some clients in 2018–19. Totals for individual age groups may not match those in other AIHW publications due to this suppression. Age was suppressed for clients who have unusual combinations of certain sensitive variables (e.g. sex, age group, Indigenous status, year, jurisdiction).

Source: Specialist Homelessness Services Collection data cubes 2011–12 to 2022–23 (AIHW 2024).

States and territories

The largest number of new SHS clients were in Victoria (45,900 in 2018–19 and 33,100 in 2022–23), followed by New South Wales (34,400 in 2018–19 and 27,900 in 2022–23) and Queensland (19,800 in 2018–19 and 18,100 in 2022–23). New clients were more likely to be female in all states/territories in both 2018–19 and 2022–23.

Between 2018–19 and 2022–23, there was a decline in the number of new clients across all states and territories.

It is important to note that clients may have accessed services in more than one state or territory, that is, when data are presented at the state/territory level, a new client might be counted in more than one jurisdiction.

Indigenous status

Among all new clients, 2 in 10 (23%) identified as Aboriginal and/or Torres Strait Islander in 2018–19, increasing by 1 percentage point to 24% in 2022–23. The number of new Indigenous clients decreased from around 25,300 new clients to 22,100 between the two time periods.

It is important to note that changes in the number of Indigenous clients over time may also reflect improved Indigenous status data among people receiving SHS support. That is, there has been a substantial decrease in the proportion of new SHS clients with ‘not stated’ Indigenous status over time, from 11% (13,900 new clients) in 2018–19 to 7.1% (7,200 new clients) in 2022–23.

Across most of the states and territories, there was an increase in the proportion of new clients identifying as Indigenous, except in Queensland, South Australia and the Australian Capital Territory.

Housing situation at first presentation and at the end of support

New clients in 2022–23 were more likely to be experiencing homelessness at the start of support and less likely to be housed at the end of their support compared with new clients in 2018–19. More than half of new clients sleeping rough at the start of support were still sleeping rough at the end of support in 2018–19 and 2022–23.

Among new clients whose housing situation was known at the beginning of their first support period:

  • Around 4 in 10 (40%) clients were experiencing homelessness at the start of support in 2018–19; this increased to 43% in 2022–23.
  • Around 8.8% of new clients were couch surfing at the start of their support in 2018–19, which had increased to 11% in 2022–23 (Figure 3).
  • At the end of support two-thirds (67%) of new clients in 2018–19 were housed, which decreased to 64% in 2022–23.
  • Clients sleeping rough at the start of support were less likely to be housed in private rental accommodation at the end of support in 2022–23 (12%) compared with 2018–19 (16%).

Figure 3: New SHS clients by known housing situation at start and end of support, states and territories, 2018–19 and 2022–23

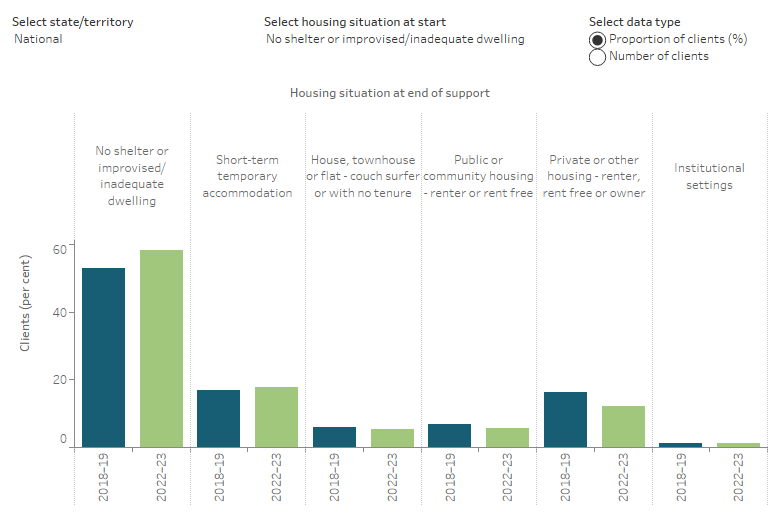
The interactive bar graph shows the number and proportion of new SHS clients by known housing situation at the start and the end of their support for each state and territory, in both time periods. The largest proportion of new clients who were sleeping rough at the start of support were also sleeping rough at the end of support.

Source: Specialist Homelessness Services Collection data cubes 2011–12 to 2022–23 (AIHW 2024).

Selected vulnerabilities

Less new clients in 2022–23 reported experiencing one or more selected vulnerabilities compared with 2018–19.

Many SHS clients face additional challenges that may make them more vulnerable to experiencing homelessness. The selected additional vulnerabilities presented here include family and domestic violence, experiencing a current mental health issue and/or problematic drug and/or alcohol use and are limited to clients aged 10 years and over. Clients may have one or any of these additional selected vulnerabilities.

Just under 6 in 10 (57%) of new clients aged 10 years and over reported experiencing one or more selected vulnerabilities in 2018–19; fewer (55%) new clients in 2022–23 were experiencing these vulnerabilities.

Among new clients aged 10 years and over (Figure 4):

  • More than one-third (37%) reported experiencing family and domestic violence in 2018–19; 35% in 2022–23.
  • 3 in 10 (30%) reported a current mental health issue in 2018–19; 31% in 2022–23.
  • Problematic drug and/or alcohol use was the least common vulnerability (1.7% in 2018–19 and 1.3% in 2022–23).
  • Very few new clients reported experiencing all 3 vulnerabilities (1.8% in both periods).
  • Just over 4 in 10 (43%) new clients experienced none of these vulnerabilities in 2018–19, increasing to 45% in 2022–23.

Figure 4: New SHS clients by selected vulnerability characteristics, states and territories, 2018–19 and 2022–23

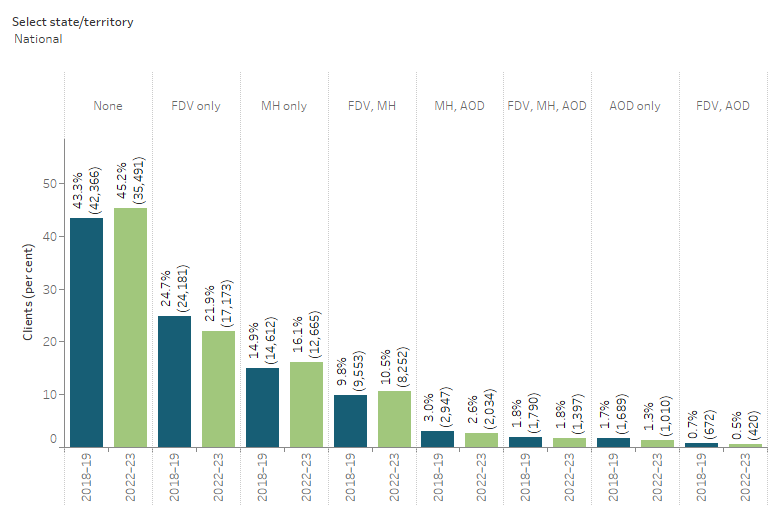
The interactive bar graph shows for each state and territory the number and proportion of new SHS clients that experienced one or more of the additional selected vulnerabilities, as well as combinations of vulnerabilities, including family and domestic violence, experiencing a current mental health issue and problematic drug and/or alcohol use.

Key FDV: Family and domestic violence; MH: Current mental health issue; AOD: Problematic drug or alcohol use

Notes:

  • Clients are assigned to one category only, based on their vulnerability profile.
  • Totals may not sum due to rounding.
  • Only includes new clients aged 10 years and over.

Source: Specialist Homelessness Services Collection data cubes 2011–12 to 2022–23 (AIHW 2024).

New adult clients

The housing situation, housing outcomes and reasons for seeking assistance are generally more likely to relate to the life circumstances of adults than children. To understand changes in these life circumstances among new clients between 2018–19 and 2022–23, the following analyses are restricted to clients aged 18 and over at the start of their first support period in each of the time periods.

There were 78,500 new clients aged 18 years and older in 2018–19; 63,700 in 2022–23.

Housing status at first presentation

Females at risk of homelessness was the most common adult housing status among new clients in both periods.

New adult SHS clients (45%) in 2022–23 were more likely to be experiencing homelessness at the start of their first support period than those in 2018–19 (42%) (Figure 5).

The number of new clients who were experiencing homelessness at the start of their first support period was similar for males and females in both periods.

Similar findings were observed across most of the states and territories.

Figure 5: Proportion of new adult SHS clients by first reported housing status and sex, states and territories, 2018–19 and 2022–23

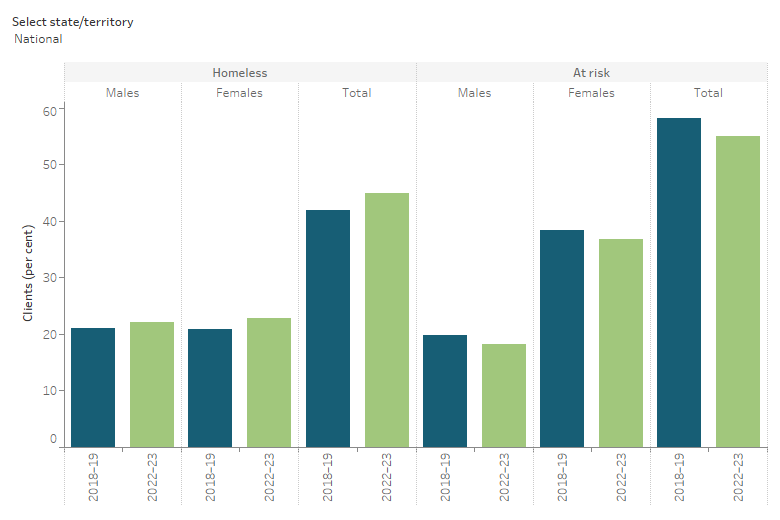
The interactive bar graph shows for each state and territory the proportion of new adult SHS clients by housing status first reported and sex, in both time periods.

Notes:

  • The denominator for the proportions excludes new clients whose housing status at first presentation was not stated.
  • Only includes new clients aged 18 years and over.

Source: Specialist Homelessness Services Collection data cubes 2011–12 to 2022–23 (AIHW 2024).

Reasons for seeking assistance

Financial difficulties was the most common reason for seeking assistance over time among new adult SHS clients, however, housing affordability has increased as a reason for seeking support.

SHS clients can identify a number of reasons for seeking assistance, reflecting the range of situations that contribute to housing instability. SHS agencies also record a single main reason for clients seeking assistance.

Domestic and family violence (24%), housing crisis (21%) and financial difficulties (12%) were the most common main reasons for seeking support among new adult SHS clients at the start of their first period of SHS support in 2022–23, similar to the top 3 main reasons in 2018–19 (Table 1).

Financial difficulties was the most common reason for seeking assistance in both time periods (41% in 2018–19 and 39% in 2022–23). The proportion of new adult clients seeking support because of housing affordability stress increased from 27% of new adult clients in 2018–19 to 33% in 2022–23 (Table 2).

Table 1: Proportion of new adult SHS clients by the 5 most common main reasons for seeking assistance (%), 2018–19 and 2022–23

2018–192022–23

Domestic and family violence

28

24

Housing crisis

20

21

Financial difficulties

13

12

Inadequate or inappropriate dwelling conditions

9.7

10

Housing affordability stress

6.7

8.7

Table 2: Proportion of new adult SHS clients by the 5 most common reasons for seeking assistance (%), 2018–19 and 2022–23

2018–192022–23

Domestic and family violence

35

31

Housing crisis

34

36

Financial difficulties

41

39

Inadequate or inappropriate dwelling conditions

22

23

Housing affordability stress

27

33

Notes:

Only includes new clients aged 18 years and over.

Source: AIHW unpublished analysis of the Specialist Homelessness Services Collection and Specialist Homelessness Services Collection data cubes (AIHW 2024).

Services needed and provided

New adult clients in 2022–23 needed similar services and similar proportions were provided with these services in 2018–19.

The services needed and provided for new adult SHS clients were broadly similar in both time periods. More than half of new adult clients needed assistance with accommodation provision, increasing by 2 percentage points from 54% in 2018–19 to 56% in 2022–23. Assistance with sustaining housing tenure was also relatively common, with more than a quarter of new clients needing assistance in both time periods (29% in 2018–19 and 26% in 2022–23).

New adult SHS clients needed (Figure 6):

  • short-term or emergency accommodation (36% in 2018–19 and 38% in 2022–23), with almost half of those needing this service receiving this service in both time periods (49% in 2018–19 and 48% in 2022–23).
  • material aid/brokerage (31% in both time periods), with more than 8 in 10 receiving this service (84% in 2018–19 and 86% in 2022–23).
  • assistance to sustain tenancy or prevent tenancy failure or eviction (29% in 2018–19 and 26% in 2022–23), with similar proportions receiving this service in both time periods (77% in 2018–19 and 76% in 2022–23).
  • assistance for family/domestic violence (27% in 2018–19 decreasing to 23% in 2022–23), with similar proportions receiving this service in both time periods (86% in 2018–19 and 87% in 2022–23).

Figure 6: New SHS clients by services needed and provided, 2018–19 and 2022–23

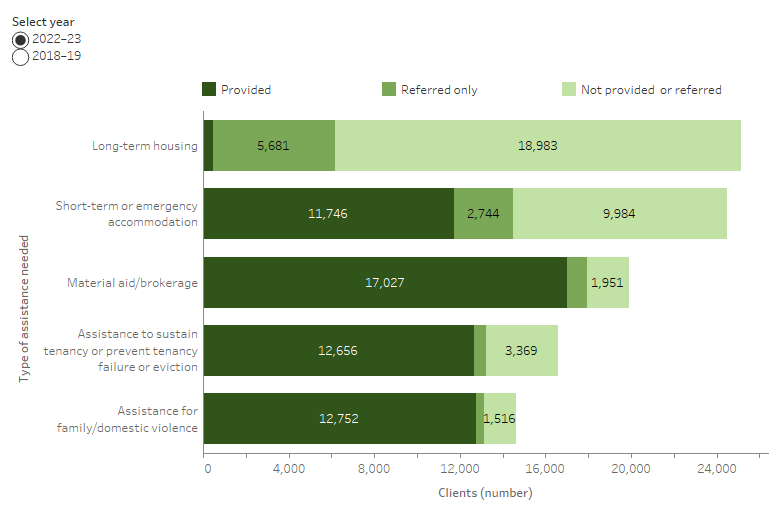
The interactive stacked bar graph shows the services needed by new SHS clients in both time periods. Assistance for family/domestic violence were the most provided services. Long-term housing was the least provided service.

Notes:

  • Only includes new clients aged 18 years and over.
  • Excludes ‘Other basic assistance’, ‘Advice/information’ and ‘Advocacy/liaison on behalf of client’.
  • ‘Short-term accommodation’ includes temporary and emergency accommodation.

Source: AIHW unpublished analysis of the Specialist Homelessness Services Collection.

Living arrangements

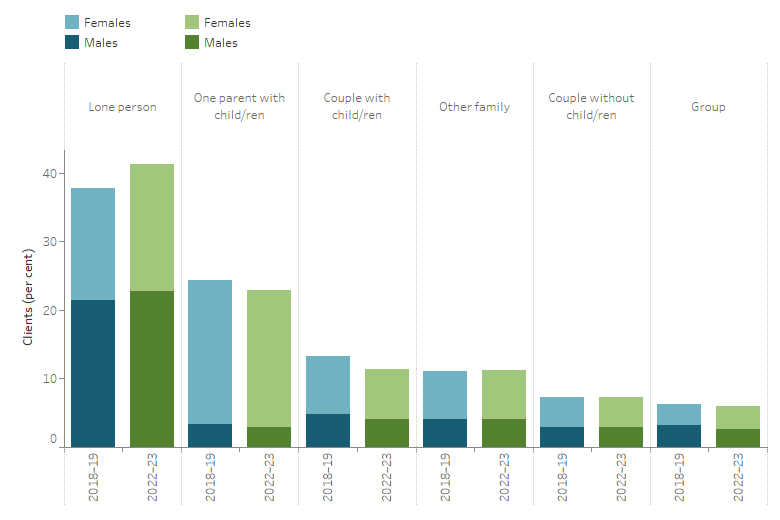
The most common living arrangement reported by new adult SHS clients at the beginning of support in both time periods was lone person.

The most common usual living arrangement among new SHS clients aged 18 and older at the beginning of support in 2018–19 was lone person (38%), increasing to 41% in 2022–23, followed by one parent with one or more children (24% in 2018–19 and 23% in 2022–23) (Figure 7).

Around 1 in 3 females were living as a single parent with one or more children compared with 1 in 13 males; broadly similar in the two time periods.

Figure 7: Proportion of new adult SHS clients by living arrangement first reported and sex, 2018–19 and 2022–23

The stacked bar graph shows the proportion of new adult SHS clients by living arrangement first reported and sex, in both time periods.

Notes:

  • Only includes new clients aged 18 years and over.
  • The living arrangement at the beginning of support. This data item indicates the group of people with whom the new client lives.
  • The denominator for the proportions excludes new clients whose living arrangement at first presentation was not stated.

Source: Specialist Homelessness Services Collection data cubes 2011–12 to 2022–23 (AIHW 2024).

Across most states and territories, the proportion new adult clients living alone increased or remained similar for both males and females between 2018–19 and 2022–23. The exception was the Northern Territory, where the proportion of males remained at between 43–44%, and females decreased from 19% in 2018–19 to 14% in 2022–23.

Among the states and territories, New South Wales, Tasmania and the Australian Capital Territory had higher proportions of new adult SHS clients living alone than the national rate in both 2018–19 and 2022–23.

Summary

Less SHS clients in 2022–23 were new clients compared with 2018–19. New clients in 2022–23 were similar to those in 2018–19 in terms of age and sex profile, and their service needs were broadly similar. New clients in 2022–23 were more likely to experience homelessness at the start of support and less likely to be housed at the end of their support compared with new clients in 2018–19. Rough sleeping was more common among new clients in 2022–23 and they were less commonly housed in private rental accommodation at the end of support compared with new clients in 2018–19.