Tobacco smoking
Current use and trends
The long-term decline in the daily smoking rate among people aged 14 or older slowed in 2016, only declining slightly from 12.8% in 2013 to 12.2% (this fall was not statistically significant) (Table 1). The daily smoking rate has nearly halved since 1991 (24.3%).
Across all age groups, males were more likely to smoke daily than females (13.8% of males aged 14 or older smoked daily compared with 10.7% for females) (Table 2).
Between 2013 and 2016, the proportion of people who have never smoked (never smoked 100 cigarettes) increased from 60% to 62% (Figure 1).
Figure 1: Tobacco smoking status, people aged 14 years or older, 1991 to 2016 (per cent)
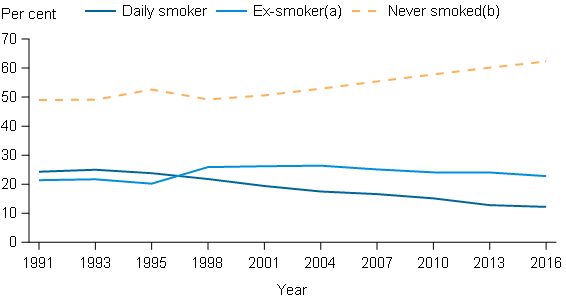
- Smoked at least 100 cigarettes (manufactured and/or roll-your-own) or the equivalent amount of tobacco in their life, and reports no longer smoking.
- Never smoked 100 cigarettes (manufactured and/or roll-your-own) or the equivalent amount of tobacco.
Source: National Drug Strategy Household Survey (NDSHS) 2016 preliminary findings (Data tables).
The rate of improvement varies by age group
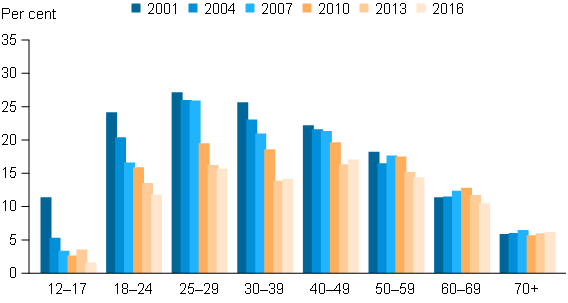
Considerable progress towards reducing the smoking rate in the general population has been made over the last 15 years with the daily smoking rate declining by over 40% for people in their 20s and 30s and by over 20% for people in their 40s and 50s (Table 3). However, little improvement has been made for people aged 60 or older over the same period (Figure 2).
Despite this change over the longer term, little or no improvement was made among people aged 30 or older between 2013 and 2016. People aged 40–49 continued to be the age group most likely to smoke daily (16.9%) and no improvements were seen amongst this group in 2016 (daily smoking was 16.2% among this age group in 2013).
There were more people in their 50s and 60s reporting that they never smoked 100 cigarettes in their lifetime in 2016 than in 2013. There was also a significant increase in the proportion of people in their mid-to late-20s reporting they had never smoked.
Considerable progress towards a reduction in smoking continued to be made among teenagers, with both 12–17 year olds and 18–19 year olds reporting significant declines in daily smoking between 2013 and 2016 (from 3.4% to 1.5% and 10.8% to 4.6% respectively). The daily smoking rate for teenagers has declined by approximately 80% since 2001.
Figure 2: Daily tobacco smokers, by age, 2001 to 2016 (per cent)
Source: NDSHS 2016 preliminary findings (Data tables).
More smokers are smoking roll-your-own cigarettes
Among adult smokers, smoking manufactured cigarettes has been gradually declining since 2007 and significantly declined between 2013 and 2016 (from 89% to 86%). In contrast, smoking roll-your-own cigarettes has been steadily increasing—from 26% in 2007, to 33% in 2013 and to 36% in 2016 (Table 5).
The increase in roll-your-own cigarettes since 2007 was most noticeable among smokers aged under 40 (increase of 82% for young adults and 70% for smokers in their 30s between 2007 and 2016). There was also a significant increase in the proportion of smokers in their 30s smoking roll-your-own cigarettes between 2013 and 2016 (from 29% to 37%).
Young adult smokers (50%) were the age group most likely to smoke roll-your-own cigarettes in 2016; use of roll-your-own cigarettes then declined as age increased.
Younger people are delaying the take up of smoking
The average age at which 14–24 year-olds smoked their first full cigarette increased from 14.3 in 2001 to 16.3 years in 2016 (significantly increased from 15.9 years in 2013) (Table 6). The age of initiation increased for males from 16 years in 2013 to 16.6 years in 2016.
No change in the average number of cigarettes smoked per week
There was a slight but non-significant decline in the average number of cigarettes smoked per week by smokers in 2016—decreasing from 96 in 2013 to 94 cigarettes in 2016 (Table 7)—but this was considerably fewer than in 2010 (average of 111 cigarettes per week).
The average number of cigarettes smoked per week increased with age until the 60–69 age group and smokers in their 60s continued to smoke the largest number of cigarettes per week on average—118 in 2016. While there was some improvement among people in their 50s between 2013 and 2016 (from 118 to 109 cigarettes per week) the decline was not significant. Smokers aged 18–24 made a significant improvement in 2016 and smoked 16 fewer cigarettes per week (down from 84 in 2013 to 68 in 2016).
Electronic cigarettes
Electronic cigarettes (also known as e-cigarettes, e-cigs or electronic nicotine delivery systems) are devices for creating aerosols, which contain nicotine and/or flavouring agents. The aerosols are then inhaled. The visual, physio-sensory and behavioural aspects of electronic cigarettes simulate the act of tobacco smoking.
The 2013 survey was the first time respondents were asked about their use of electronic cigarettes. In 2016, a number of changes were made to the questionnaire to better capture the use of electronic cigarettes, including adding questions about frequency and duration of use, and modifying the question about lifetime use and current use of electronic cigarettes (see questionnaire changes for more information).
These changes mean that 2016 and 2013 data are not fully comparable. However, data may still be used to give an indication of the change in use of electronic cigarettes between 2013 and 2016.
Lifetime use of e-cigarettes
Lifetime use of electronic cigarettes significantly increased across all age groups between 2013 and 2016 apart from the oldest age group (70 years or older). Electronic cigarettes were most commonly tried by smokers aged under 25 years with 1 in 2 trying e-cigarettes in their lifetime. Lifetime use then generally decreased with age (Table 8).
Most e-cigarette users only try them and no longer use them
Nearly one third of smokers (31%) had tried e-cigarettes in their lifetime, but the majority had only tried them once or twice (20%) and only 4.4% currently use them (the remaining 6.8% no longer use them) (Table 9).
Exposure to second-hand smoke
Dependent children were less likely to be exposed to tobacco smoke inside the home
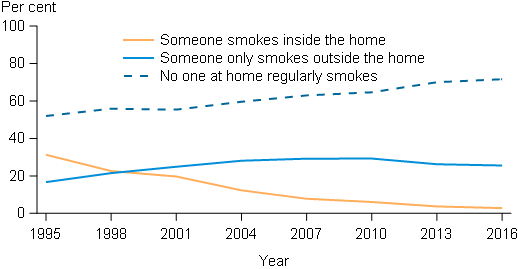
Only 2.8% of households with dependent children had a household member that smoked daily inside the home in 2016 (Figure 3), a significant decline from 3.7% in 2013—and a dramatic fall from 31% in 1995.
Figure 3: Exposure to environmental smoke in the home, households with children aged 14 years and under, 1995 to 2016 (per cent)
Source: NDSHS 2016 preliminary findings (Data tables).
Illicit tobacco
No change in the use of illicit unbranded tobacco
About 1 in 6 smokers had smoked unbranded tobacco in their lifetime and 1 in 26 currently smoke it—similar proportions to 2013 (Table 11).
Fewer smokers had seen and purchased tobacco products without plain packaging
The proportion of smokers reporting that they had seen tobacco products without plain packaging in the last 3 months declined in 2016 (from 18.5% in 2013 to 13.0%). There were also fewer smokers purchasing these products in 2016 (from 9.6% in 2013 to 5.5%) (Table 12). Revisions were made in 2016 to add 'in Australia' to the wording of the question which specifically asks about whether people have seen tobacco products which do not have the plain packaging/graphic health warnings (see questionnaire changes for further information). This change may have had an impact on these results but the extent of the impact is unclear as it is not known how many people surveyed in 2013 may have been thinking of cigarette packets they saw or purchased overseas rather than in Australia.
Policy support
Support for policies aimed at reducing harm caused by tobacco remained high, but there were small declines in reported support for the following policies between 2013 and 2016:
- Stricter penalties for sale or supply to minors (from 86% to 84%).
- Banning all additives (e.g. flavouring) in cigarettes and other tobacco products, to make them less attractive to young people (from 79% to 76%).
- Raising the legal age for sale or supply of tobacco, and making it harder to buy tobacco in shops (both declined from 65% to 64%) (Table 13).
Stricter enforcement of the law and penalties for supplying to minors continued to receive the highest level of support, but has been gradually declining since 2007 (from 90% to 86% in 2016).
Three new policy support measures about electronic cigarettes were added to the questionnaire in 2016. These new measures received relatively high support with about two-thirds supporting restrictions on the use of e-cigarettes in public places and on where and when they can be advertised. More than 3 in 4 supported prohibiting the sale of e-cigarettes to people under the age of 18 (Table 13).
Perceptions
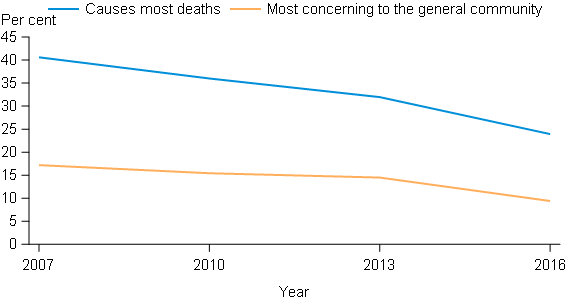
Tobacco contributes to more drug-related hospitalisations and deaths than alcohol and illicit drug use combined. However the proportion of people who perceive tobacco as the drug that causes the most deaths fell from 2013 to 2016 as did the proportion of people who perceive tobacco to be the drug of most concern (Figure 4). This change in perception is most likely driven by the substantial shift in people’s attitudes towards meth/amphetamines (see Illicit use of drugs—Attitudes and perceptions).
Figure 4: Perceptions of tobacco, people aged 14 or older, 2007 to 2016 (per cent)
Source: NDSHS 2016 preliminary findings (Data tables).