Cancer incidence and survival
Data updates
25/02/22 – In the Data section, updated data related to cancer incidence and survival are presented in Data tables: Australia’s children 2022 - Health. The web report text was last updated in December 2019.
Key findings
- During 2011–2015, an average of 714 new cases of cancer were diagnosed annually among children aged 0–14—a rate of 16 per 100,000 children.
- The most common cancer groups were leukaemia, cancer of the central nervous system (including the brain) and lymphoma
Cancer is a term used to describe diseases in which abnormal cells divide without control and can invade nearby tissues. Cancer can also spread to other parts of the body through the blood and lymph systems (AIHW 2019).
Cancers in children are often different from those observed in adults in appearance, site of origin and response to treatment (AIHW 2012). They can be caused by DNA (epigenetic) changes in cells that occur very early in life, sometimes even before birth (Cancer Australia 2019).
Leukaemia is the most common type of cancer among children. It refers to a group of cancers that affect the blood and blood-producing tissues of the body. Unlike many cancers in adults, childhood cancers are not strongly linked to lifestyle or environmental factors (Cancer Australia 2019).
Cancer causes significant illness for children. It was 1 of the leading causes of death for those aged 1–14 in 2015–2017 (see Infant and child deaths). Survival after a diagnosis of cancer provides an indication of cancer prognosis and the effectiveness of available treatments (AIHW 2019).
Box 1: Data sources and classifications for cancer
Data on new cases of cancer, and 5-year relative survival rates are derived from the AIHW Australian Cancer Database. Reporting on types of new cases and survival rates uses the International Classification of Childhood Cancer, 3rd edition (ICCC-3), a classification scheme specifically developed for childhood cancer. Note that this differs from the International Classification of Diseases 10th edition (ICD-10) used in Cancer in Australia which reports on the whole population.
Deaths data are sourced from the AIHW National Mortality Database (NMD). Types of cancer deaths are reported using the International Classification of Diseases 10th edition (ICD-10), as it is not possible to report mortality using the ICCC-3.
How many new cases of childhood cancers are there?
During 2011–2015, an average of 714 new cases of cancer were diagnosed annually among children aged 0–14 years—a rate of 16 per 100,000 children (18 and 15 per 100,000 boys and girls, respectively). More than half (55%) were diagnosed among boys.
The cancer incidence rate for very young children aged 0–4 (23 per 100,000) was almost twice that of children aged 5–9 (12 per 100,000) and 1.6 times as high as children aged 10–14 (14 per 100,000, respectively) (Figure 1).
Figure 1: New cases of cancer among children aged 0–14, by age and sex, 2011–2015
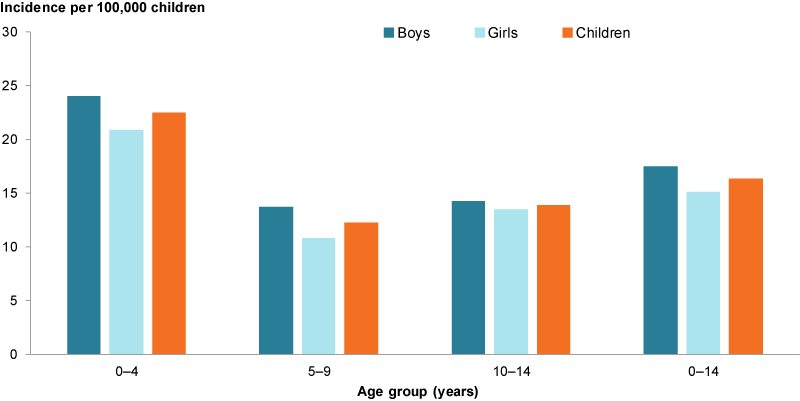
Source: AIHW Australian Cancer Database 2015.
What are the most common types of new cases of cancer?
During 2011–2015, the most common cancers among children aged 0–14 fell into 3 broad cancer groups (ICCC-3):
- leukaemias (5.8 per 100,000 or 35% of all cases), including lymphoid leukaemias (27% of all cases)
- central nervous system (including brain) cancers (2.3 cases per 100,000 children aged 0–14 or 14%)
- lymphomas (2.2 cases per 100,000 children aged 0–14 or 13%), including:
- Hodgkin lymphomas (3.8%)
- Non-Hodgkin lymphomas (except Burkitt lymphoma) (3.5%).
There were more new cases of cancer for children aged 0–4 than for older children (Figure 2).
Figure 2: Most common types of new cancers among children aged 0-14, 2011–2015
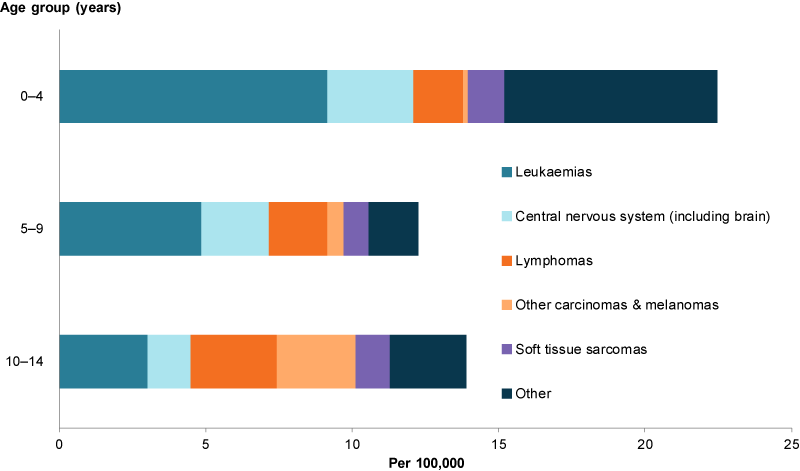
Note: For full names of the ICC-3 groups, see Technical Notes.
Source: AIHW Australian Cancer Database 2015.
Have rates of new cases of cancer changed over time?
The rates for 2011–2015 for children aged 0–14 (16.3 per 100,000) were slightly higher than for 2006–2010 (15.1 per 100,000) (Figure 3).
While rates increased for all age groups, the largest increase was for children aged 5–9 (10.3 cases per 100,000 in 2006–2010 to 12.3 cases per 100,000 in 2011–2015).
Figure 3: New cases of cancer among children aged 0–14, in 2006–2010 and 2011–2015
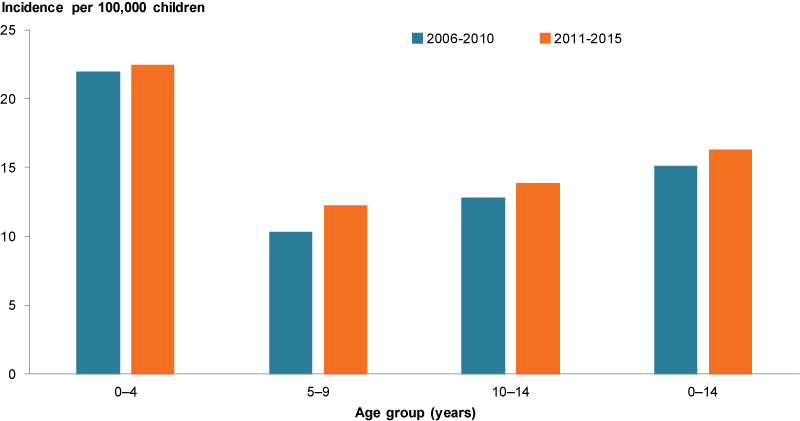
Source: AIHW Australian Cancer Database 2015.
Have 5-year relative survival rates changed over time?
Five-year relative survival refers to the probability of being alive 5 years after diagnosis compared with the general population (see Technical notes). During 2010–2015, the 5-year relative survival among children aged 0–14 was 84% for all cancers, with no statistically significant difference between boys (85%) and girls (84%).
All cancers
The 5-year relative survival rate for children aged 0–14 for all cancers steadily increased from 71% in 1986–1991 to 84% in 2010–2015 (Figure 4). However, gains were not consistent across all cancers:
- leukaemias—20 percentage point increase (rising from 70% to 90%)
- lymphomas—13 percentage point increase (rising from 80% to 93%)
- central nervous system cancers (including brain)—increase was small (4%) and not statistically significant.
Figure 4: Five-year relative survival for cancer among children aged 0–14, in 1986–1991 and 2011–2015
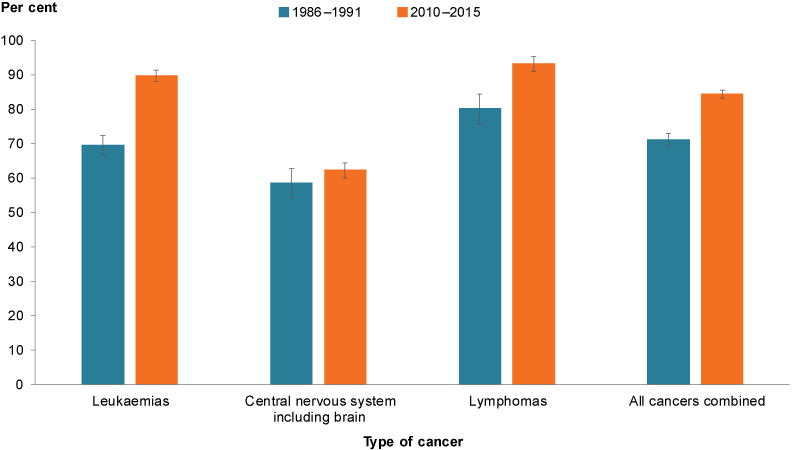
Source: AIHW Australian Cancer Database 2015.
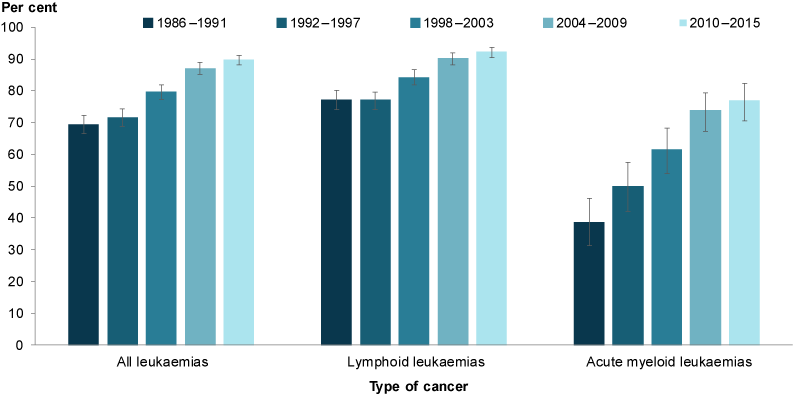
Leukaemia
Between 1986–1991 and 2010–2015, the 5-year relative survival for children aged 0–14 for all leukaemias increased from 70% to 90% (Figure 5).
Improvements were greatest for acute myeloid leukaemias, which almost doubled from 39% in 1986–1991 to 77% in 2010–2015.
In 2010–2015, the 5-year relative survival remained higher for lymphoid leukaemias (92%) than acute myeloid leukaemias (77%), a pattern that has remained consistent since 1986–1991 (Figure 5).
Figure 5: Five-year relative survival for leukaemia among children aged 0–14, from 1986–1991 to 2011–2015
Source: AIHW Australian Cancer Database 2015.
How many children die of cancer?
In this section, types of cancer deaths are reported using ICD-10 codes.
In 2015–2017, there were 275 cancer deaths among children aged 0–14. This is an average of 92 deaths a year or a rate of 2 deaths per 100,000 (Figure 6).
For children aged 1–14, cancer was the second leading cause of death, after injury deaths at 19% (see Infant and child deaths).
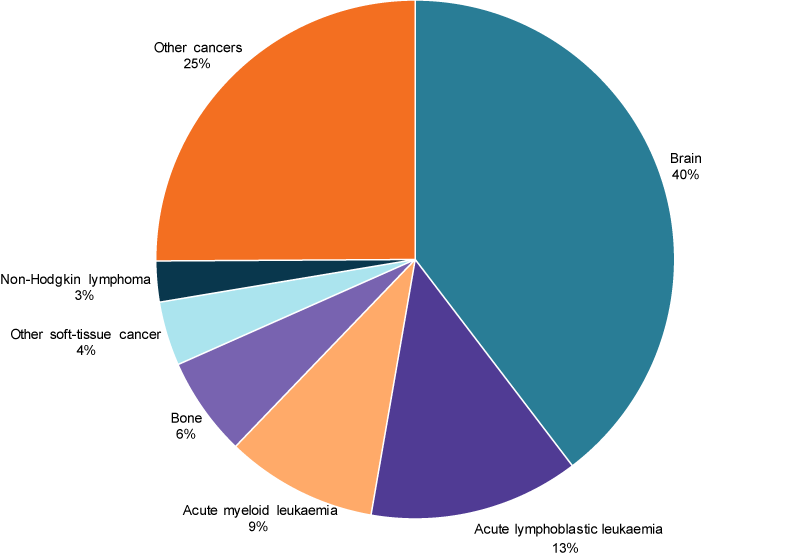
The most common cancers causing death among children in 2015–2017 were:
- brain cancer (0.8 deaths per 100,000 or 40% of all cancer deaths)
- acute lymphoblastic leukaemia (0.3 deaths or 13%)
- acute myeloid leukaemia (0.3 deaths or 9.5%).
Figure 6: Most common cancer deaths for children aged 0–14, 2015–2017
Source: Analysis of AIHW National Mortality Database.
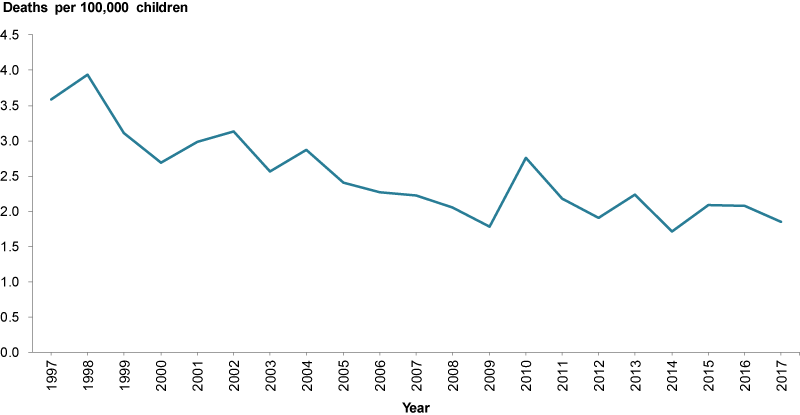
Have cancer death rates changed over time?
Death rates from cancer almost halved between 1997 and 2017—from 3.6 deaths per 100,000 children aged 0–14 to 1.9 deaths per 100,000 (Figure 7).
Figure 7: Cancer deaths among children aged 0–14, 1997–2017
Source: AIHW Australian Cancer Database 2015.
Is the rate of new cancers the same for everyone?
During 2010–2014, there was little difference in the rate of new cases of cancers diagnosed in Indigenous children aged 0–14 and non-Indigenous children (13 and 16 cases per 100,000 children, respectively) (Figure 8).
Rates in areas of greater and least socioeconomic disadvantage and between different geographical areas were similar with the greatest difference between children in Major cities and Remote and very remote areas (17 and 15 per 100,000, respectively).
Figure 8: New cases of cancer among children aged 0–14, by selected population groups, 2010–2014
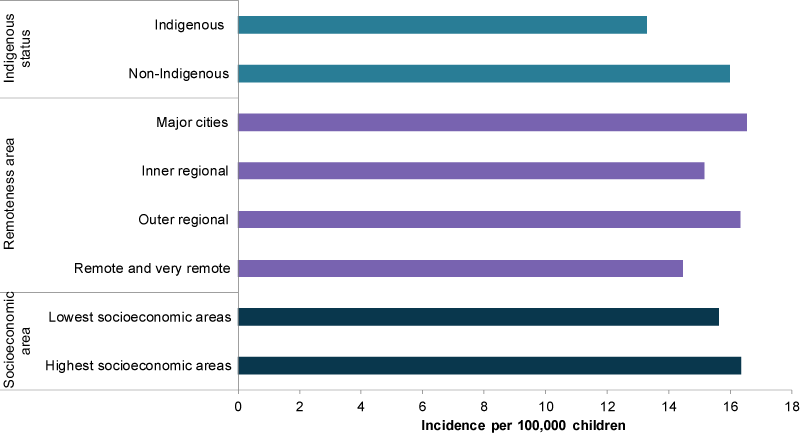
Note: 2015 data for New South Wales were not available and AIHW estimates of incidence for NSW in 2015 could not be stratified by Indigenous status, Remoteness Area or Socioeconomic Group.
Source: AIHW Australian Cancer Database 2015.
International comparisons
An international study of the incidence of cancer in 2001–10 for children aged 0–14 across 14 world regions found that the most common types of cancers in all regions combined among children aged 0–14 were:
- leukaemia
- central nervous system tumours
- lymphomas.
This ranking was observed in most world regions (Steliarova-Foucher et al. 2017). These were the same as those reported in this section for Australian children (See What are the most common types of new cases of cancer?).
The regions with the highest age-standardised rates of cancer incidence were in some predominantly white populations of North America, as well as in Europe, and Oceania (which includes Australia). From the 1980s to 2001–10, there was an increase in the world age-standardised rate for all cancer incidence in children aged 0–14. This increase was observed in all regions except sub-Saharan Africa (Steliarova-Foucher et al. 2017).
Reasons for the increase since the 1980s may include:
- improved diagnosis in high-income countries
- less under-diagnosis in some parts of world
- ongoing development of cancer registration
- more effective ascertainment techniques.
The highest incidence of all central nervous system tumours was noted in high-income countries, which is related to the wide availability of diagnostic facilities (Steliarova-Foucher et al. 2017).
Data limitations and development opportunities
Future national reporting of cancer is likely to be enhanced with the introduction of the Enduring Linked Cancer and Treatment Analysis Asset, which aims to bring together data from the Australian Cancer Database with health service, treatment and mortality data. This analysis asset is currently being developed by AIHW, in conjunction with the Australian Government and the states and territories. For more information data linkage, see Data gaps.
Where do I find more information?
For more information on:
- Australian cancer incidence and mortality (classified using the ICD-10), see: Cancer data in Australia and Cancer in Australia 2019.