Disability-free life expectancy
At birth
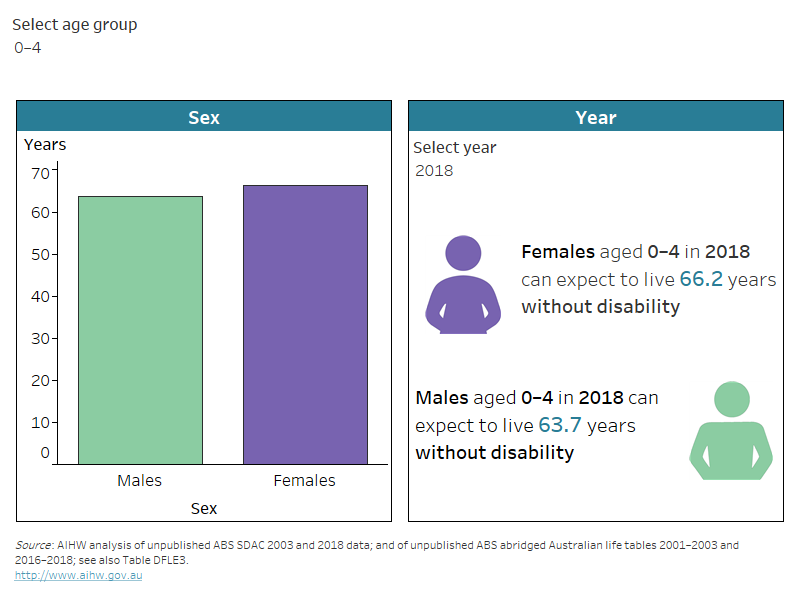
Girls born in 2018 can expect to live 22% (19 years) of their overall life expectancy with some level of disability.
Boys born in 2018 can expect to live 21% (17 years) of their overall life expectancy with some level of disability.
At age 65 – men
Men aged 65 in 2018 can expect to live 53% (11 years) of their remaining lives with some level of disability.
At age 65 – women
Women aged 65 in 2018 can expect to live 54% (12 years) of their remaining lives with some level of disability.
On this page:
Introduction
People in Australia are living longer. Our state of health in later years has important implications for population health and for Australia’s health and care systems.
Life expectancy is a valuable indicator of overall population health. It measures how many years, on average, a person at any given age can expect to live. However, life expectancy alone cannot provide insight into people's state of health during those years. For this reason, ‘health expectancy’ measures are also often used.
Health expectancy is a general term describing the expected years a person will spend in various health states – in this section, the estimated years spent living with and without disability.
Overall, the disability-free life expectancy of people in Australia – the estimated years we can expect to live without disability – has increased in recent years.
How do we measure life and health expectancy?
Life expectancy is one of the most common ways to measure and assess the population's overall health. It is expressed as the:
- number of years a newborn baby is expected to live, or
- expected years of life remaining for a person at a given age.
Life expectancy is estimated from population death rates. It is the expected number of years of life left for a person at a particular age if death rates do not change. For more information on life expectancy, see AIHW life expectancy and deaths.
The estimates of health expectancies presented in this section are expressed using 4 main measures. These are the expected years of life lived:
- with disability (all levels)
- with severe or profound disability (a subset of years of life with disability)
- without disability (all levels) – a subset of years of life without severe or profound disability
- without severe or profound disability.
These estimates have been calculated using the Sullivan Method (Sullivan 1971). Health expectancies calculated using this method are the average number of remaining years, at a particular age, a population can expect to live with different levels of disability or without disability.
For more information see AIHW Life expectancy and disability in Australia: appendixes A–C.
It is important to note that disability does not necessarily equate to poor health or illness. Also, expected years living with disability should not be considered as being of less value than years without disability. For example, in the early stages of disability associated with paraplegia, a person might also experience poor health, but once their condition is stable, they might enjoy good health, particularly if they can participate in many life areas.
Data note
On this page, unpublished ABS abridged life tables are used with unpublished age- and sex-specific disability prevalence rates from the Australian Bureau of Statistics (ABS) Survey of Disability, Ageing and Carers (SDAC). For more information about the SDAC, including the concepts of disability, disability severity, disability groups, and remoteness categories used by the SDAC, see ‘Data sources’.
At birth
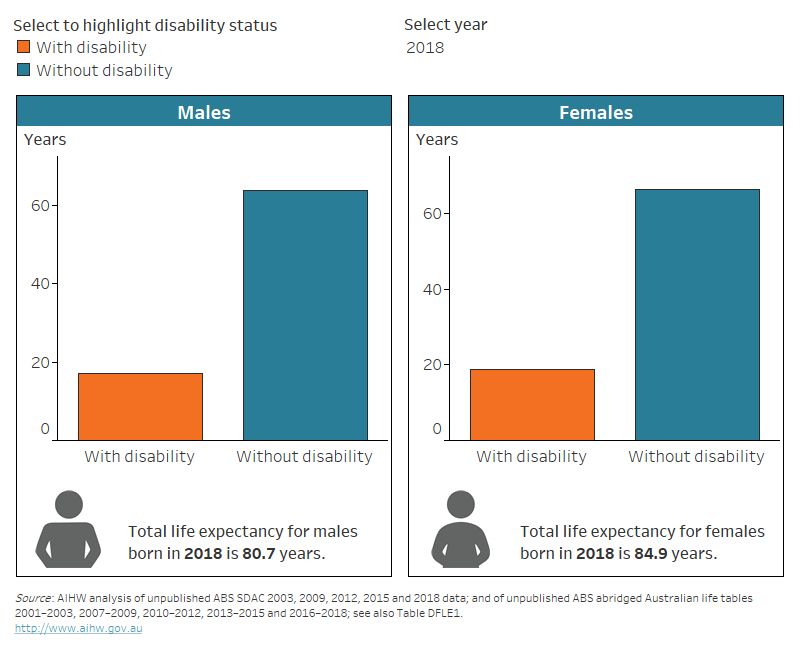
Boys born in 2018 can expect to live an average of around 81 years. Of this time, an estimated:
- 64 years will be lived free of disability (Figure LIFE EXPECTANCY.1)
- 17 years will be with some level of disability, including around 5.5 years with severe or profound disability (Figure LIFE EXPECTANCY.2).
Girls born in 2018 can expect to live an average of around 85 years. Of this time, an estimated:
- 66 years will be lived free of disability (Figure LIFE EXPECTANCY.1)
- 19 years will be with some level of disability, including around 7.2 years with severe or profound disability (Figure LIFE EXPECTANCY.2).
For people born in 2018, this equates to living around one-fifth of their life with some level of disability (21% for males and 22% for females).
Figure LIFE EXPECTANCY.1: The number of years a person can expect to live without and with disability, by sex, for people born in 2003, 2009, 2012, 2015 and 2018
The chart shows females born in 2018 can expect to live 66 years without disability and 19 years with disability, and 64 and 17 years for males.
Source data tables: Data tables – Disability-free life expectancy. View data tables
Figure LIFE EXPECTANCY.2: The number of years a person can expect to live without and with severe or profound disability, by sex, for people born in 2003, 2009, 2012, 2015 and 2018
The chart shows females born in 2018 can expect to live 78 years without and 7 years with severe or profound disability (75 and 5.5 years for males).

Source data tables: Data tables – Disability-free life expectancy. View data tables
At age 65
Focusing on health expectancy at age 65 is a useful measure for monitoring healthy ageing within the population.
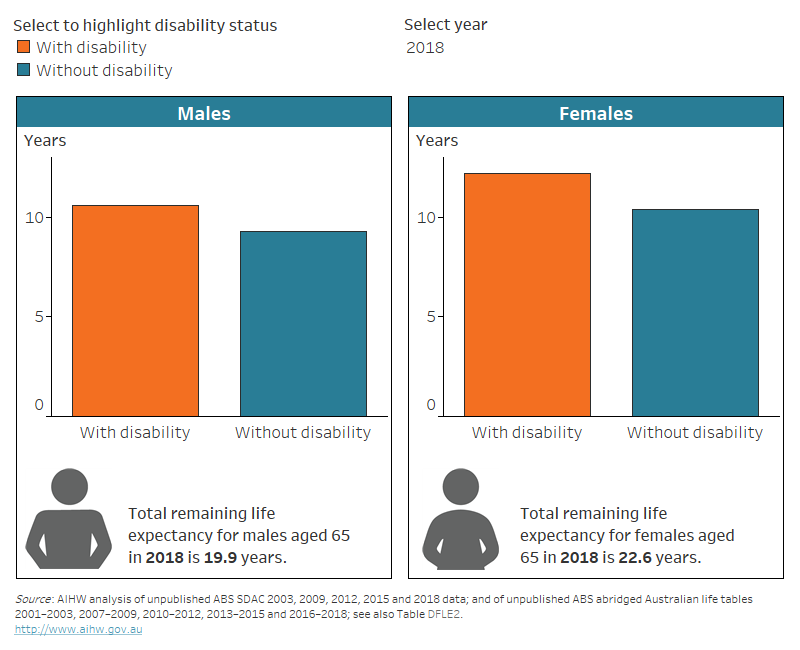
Men aged 65 in 2018 can expect to live, on average, another:
- 9.3 years without disability (Figure LIFE EXPECTANCY.3)
- 11 years with some level of disability, including around 3.5 years with severe or profound disability (Figure LIFE EXPECTANCY.4).
Women aged 65 in 2018 can expect to live, on average, another:
- 10 years without disability (Figure LIFE EXPECTANCY.3)
- 12 years with some level of disability, including around 5.5 years with severe or profound disability (Figure LIFE EXPECTANCY.4).
For people aged 65 in 2018 this equates to living just over half of their remaining lives with some level of disability (53% for men and 54% for women).
Figure LIFE EXPECTANCY.3: The number of years a person can expect to live without and with disability, by sex, for people aged 65 in 2003, 2009, 2012, 2015 and 2018
The chart shows females aged 65 in 2018 can expect to live 10 years without disability and 12 years with disability, and 9.3 and 11 years for males.
Source data tables: Data tables – Disability-free life expectancy. View data tables
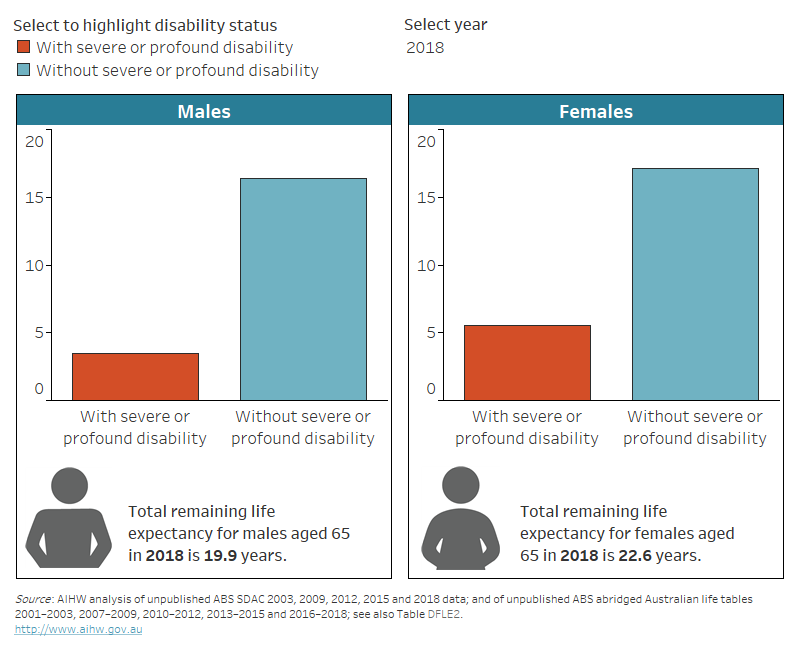
Figure LIFE EXPECTANCY.4: The number of years a person can expect to live without and with severe or profound disability, by sex, for people aged 65 in 2003, 2009, 2012, 2015 and 2018
The chart shows females aged 65 in 2018 can expect to live 17 years without and 5.5 years with severe or profound disability (16 and 3.5 for males).
Source data tables: Data tables – Disability-free life expectancy. View data tables
Throughout life and over time
As individuals age, the number of years they have without disability reduces. Over time, however, the number of estimated years living without disability at any age has increased for men and women (Figure LIFE EXPECTANCY.5).
Men aged:
- 25–29 in 2003 can expect to live an additional 37 years without disability, increasing to 42 years for men of that age in 2018
- 50–54 in 2003 can expect to live an additional 17 years without disability, increasing to 20 years for men of that age in 2018
- 75–79 in 2003 can expect to live an additional 3.3 years without disability, increasing to 4.4 years for men of that age in 2018.
Women aged:
- 25–29 in 2003 can expect to live an additional 40 years without disability, increasing to 43 years for women of that age in 2018
- 50–54 in 2003 can expect to live an additional 18 years without disability, increasing to 21 years for women of that age in 2018
- 75–79 in 2003 can expect to live an additional 3.9 years without disability, increasing to 4.9 years for women of that age in 2018.
Figure LIFE EXPECTANCY.5: The number of years a person can expect to live without disability, by age 2003 and age in 2018, and sex
The chart shows disability-free life expectancy improved between 2003 and 2018 for all age groups and both males and females.
Source data tables: Data tables – Disability-free life expectancy. View data tables
Gender gap
Females generally have a longer life expectancy. They can expect to live longer with disability compared to males, but their disability-free life expectancy is also longer than for males. The gender gap in the expected years living without overall disability narrowed in most age groups between 2003 and 2018, whilst the gap in the expected years living with severe or profound disability has remained stable for most age groups (Figure LIFE EXPECTANCY.6).
This is likely the result of greater gains in life expectancy for men than for women over that period, combined with known sex differences and changes in disability prevalence.
Gender gap in health expectancies
Gender gap in health expectancies is the number of years difference between the expected years for females and expected years for males (calculated by subtracting expected years for males from expected years for females).
Figure LIFE EXPECTANCY.6: The difference between females and males in number of years expected to live without disability and without severe or profound disability, by age in 2003 and age in 2018
The chart shows disability-free life expectancy gap between females and males reduced between 2003 and 2018 (from 3.1 to 2.4 in 0–4 age group).
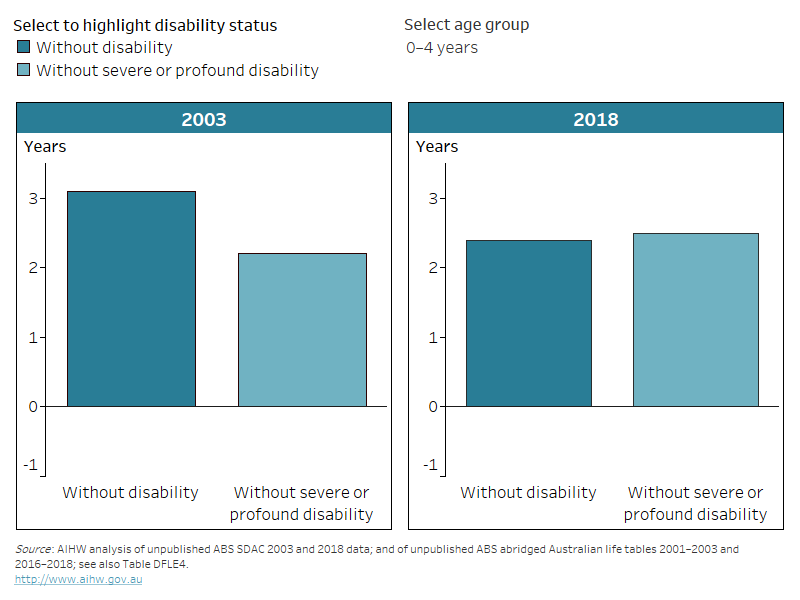
Note: Gender gap is calculated by subtracting expected years for males from expected years for females. Positive numbers indicate longer life expectancy for females, and negative numbers indicate longer life expectancy for males.
Source data tables: Data tables – Disability-free life expectancy. View data tables
ABS (Australian Bureau of Statistics) (2019a) Life Tables 2001–2003, 2007–2009, 2010–2012, 2013–2015 and 2016–2018, ABS, AIHW analysis of unpublished customised data request, accessed 18 December 2019.
ABS (2019b) Survey of Disability, Ageing and Carers 2003, 2009, 2012, 2015 and 2018, ABS, AIHW analysis of unpublished customised data request, accessed 16 December 2019.
AIHW (Australian Institute of Health and Welfare) (2020) ‘Longer lives, healthier lives?’, Australia’s health 2020: data insights, Cat. no. AUS 231, AIHW, doi:10.25816/5f05371c539f3, accessed 17 August 2020.
Sullivan DF (1971) ‘A single index of mortality and morbidity’, Health Services and Mental Health Administration Health reports, 86(4):347–354, accessed 5 May 2022.