Specialist disability support services
Number of NDIS participants
Around 610,500 people were active participants in the National Disability Insurance Scheme (NDIS) at 30 June 2023.
Young NDIS participants
43% (or 261,000) active NDIS participants were aged 14 and under at 30 June 2023.
Need for assistance
About 40% (or 1.7 million) of people with disability needed assistance from formal providers in 2018.
On this page:
Introduction
People with disability who need support may use specialist disability services (provided specifically for people with disability), mainstream services (such as education, healthcare and housing), and/or be supported by informal carers. They may also receive financial assistance (income support) to assist with everyday cost of living (see ‘Income support’ for more information).
This section focuses on one part of this interacting system of supports – specialist disability support services funded or provided by government.
What are specialist disability support services?
Specialist disability support services help people with disability participate fully in daily life. They may supplement other support a person receives, such as that provided by mainstream services, the community and/or informal carers.
Disability support services may include:
- assistive technology (for example, wheelchairs, hearing aids, voice-recognition computer software)
- case management
- early childhood intervention services
- life skills development
- specialist accommodation and home modifications
- support to live in the community (for example, personal care and domestic assistance)
- support to participate in community activities
- respite care
- employment services.
Specialist disability support services are primarily aimed at people aged under 65, but support is also available to eligible people aged 65 and over.
Specialist disability support services are now largely provided through the National Disability Insurance Scheme (NDIS). In 2021–22, governments contributed $29.2 billion to the NDIS; a further $2.1 billion in government expenditure was provided for disability-specific services outside of the NDIS (SCRGSP 2023).
Prior to the NDIS roll-out, specialist disability support services were provided under the National Disability Agreement (NDA). Most, but not all, NDA services, and the people using them, have transitioned to the NDIS. For information on services provided under the NDA, please refer to the archived versions of this report.
This section provides information on:
- eligibility for and service provision in the NDIS
- met and unmet need for formal services (from the Australian Bureau of Statistics' (ABS) Survey of Disability, Ageing and Carers (SDAC)).
Support provided through the National Disability Insurance Scheme
The NDIS is designed to provide Australians with permanent and significant disability with the reasonable and necessary support needed to participate in everyday life.
About the National Disability Insurance Scheme
The NDIS is a fundamental shift in the way Australians with significant and permanent disability access supports. It is founded in insurance principles to provide eligible Australians who have a permanent and significant disability with the reasonable and necessary supports they need (NDIA 2020a).
The NDIS was introduced in trial sites in 2013, and has been progressively rolled out across Australia from July 2016. From 1 July 2020, the NDIS has been made available to all eligible Australians, no matter where they live (NDIA 2020b). The National Disability Insurance Agency (NDIA) estimates that, by 30 June 2025, the NDIS will provide around 715,000 Australians (677,000 aged under 65) with funding for supports and services (NDIA 2023a). People with disability are directly funded under the NDIS, as distinct from the previous system of block funding to agencies and community organisations that provided disability support services under the National Disability Agreement (NDIA 2020a).
Data note
Data in this section are largely sourced from unpublished data provided by the National Disability Insurance Agency (NDIA) (NDIA 2023b). At the time of data provision, June 2023 data was the most recent available. For the more recent publicly available data, please visit the NDIS website.
Reporting on experiences and outcomes of NDIS participants for Australia’s Disability Strategy
Australia's Disability Strategy 2021–2031 (the Strategy) is Australia's national disability policy framework. It sets out a plan for continuing to improve the lives of people with disability in Australia over the 10 years to 2031. The Strategy's Outcomes Framework tracks the outcomes for people with disability across seven outcome areas.
While the Strategy is about all people with disability, several of the Strategy's measures are focussed on the NDIS participants' experiences and outcomes. These measures are:
- NDIS participants in full award wage employment: Proportion of NDIS participants aged 15–64 in the labour force who are in open employment at full award wage (22% in 2023–24 Q2)
- NDIS participants job support: Proportion of NDIS participants who get the support they need to do their job (62% in 2023–24 Q2)
- Young NDIS participant employment: Proportion of NDIS young people (aged 15–24) in employment (19% in 2023–24 Q2)
- NDIS participants housing satisfaction: Proportion of NDIS participants who are happy with current home (72.8% in 2023–24 Q2)
- NDIS participants pursuing interests: Proportion of NDIS participants who spend free time doing activities that interest them (64% in 2023–24 Q2)
- NDIS complaints abuse/neglect: Number of complaints related to abuse and neglect per 1,000 NDIS participants (2.2 complaints in 2022–23)
- NDIS participants capacity to self-advocate: Proportion of NDIS participants who feel able to advocate (stand up) for themselves (37% in 2023–24 Q2)
- NDIS participants choice and control: Proportion of participants aged 15–64 who responded ‘yes’ to ‘Has the NDIS helped you have more choice and control over your life?’ after two years in the scheme (77% in 2023–24 Q2)
- NDIS participants use of assistive technology: Proportion of NDIS participants who received assistive technology supports (48% in 2023–24 Q1)
- NDIS participants life satisfaction: Proportion of NDIS participants who report feeling satisfied about their life in general now and in the future (47% in 2022–23)
Note: the numbers reported in this summary box and on the Reporting on Australia's Disability Strategy 2021–2031 website may differ slightly from the numbers reported elsewhere in this report, due to different data sources, populations, and/or reporting periods.
Eligibility
At 30 June 2023, 674,600 applicants to the NDIS were ever eligible for access. This represents 85% of applications where access decision has been made (NDIA 2023b).
What does ever eligible mean?
Ever eligible is a count of people who have ever gained access to the NDIS. It includes people who have now had their access ceased or revoked. Access can be ceased or revoked for a number of reasons, including death, no longer meeting the scheme's eligibility criteria, or self-elected exit.
In this report, percentages of ever eligible NDIS applicants are calculated out of the number of applications where a complete access decision has been made. Applications where access decision has not been made (including in-progress applications, as well as withdrawn or cancelled applications) are excluded from the calculation.
This section reports on variations in eligibility for NDIS supports across various population groups. While there may be multiple possible reasons behind these differences, this report does not attribute these differences to any particular reason, nor does it make any inferences about causation.
Eligibility varies by age and gender. At 30 June 2023:
- 98% (or 211,700) of applicants aged 6 or under were ever deemed eligible, compared with 90% (or 42,600) of applicants aged 15–18, 84% (or 49,000) of applicants aged 25–34, and 69% (or 83,200) of applicants aged 55–64 (age at access decision date)
- 89% (or 411,300) of males aged 64 or under and 81% (or 249,800) of females in this age group were ever deemed eligible (Figure NDIS.1, NDIA 2023b).
Figure NDIS.1: Eligibility of NDIS applicants, by age group, 30 June 2023
The chart shows that the proportion of NDIS applicants deemed eligible falls with age, from 98% of applicants aged 0–6 to 69% of those aged 55–64.
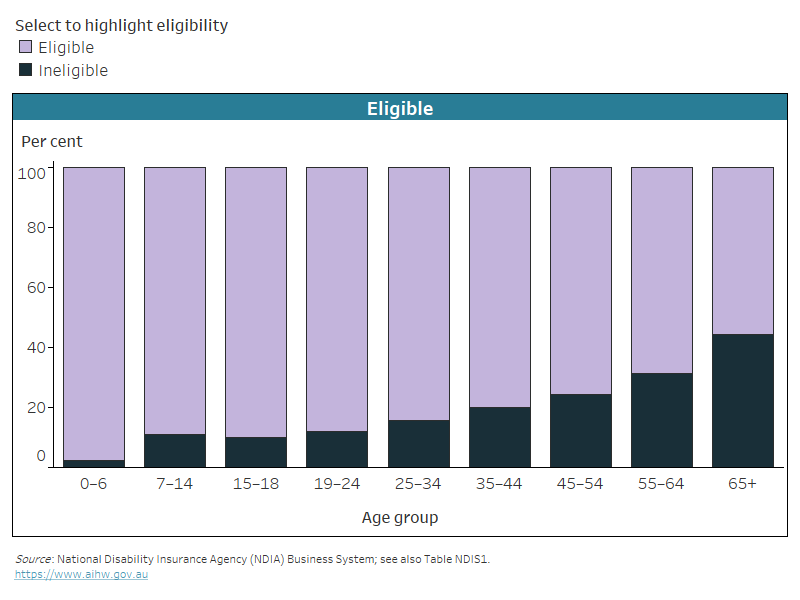
Notes:
- Age is as at the access decision date.
- ‘Eligible’ means ever eligible.
- Ineligible only includes persons that have a complete access decision and are not eligible.
Source data tables: Data tables – NDIS. View data tables
Eligibility does not vary significantly between urban and remote locations; for example, of those aged 64 or under (where remoteness is known):
- 86% (or 456,100) of applicants living in major cities were ever eligible
- 85% (or 202,900) of those living in regional cities and towns
- 84% (or 10,600) of those living in remote and very remote areas (NDIA 2023b).
How is remoteness defined?
The remoteness categories used in this section are based on the Modified Monash Model which classifies locations into 7 categories from Major cities to Very remote areas (NDIA 2023c). The classifications are based on the ABS Australian Statistical Geography Standard – Remoteness Areas framework and use Census data. For more information see Modified Monash Model.
Eligibility also does not vary significantly by Indigenous status (where Indigenous status is known):
- 87% (or 51,600) of First Nations applicants aged 64 and under were ever eligible
- 86% (or 513,000) of non-Indigenous applicants (NDIA 2023b).
Eligibility varies more substantially for culturally and linguistically diverse (CALD) groups (where CALD status is known):
- 79% (or 63,000) of applicants aged 64 and under who were from culturally and linguistically diverse backgrounds (born in a non-English speaking country and/or primarily spoke a language other than English at home) were ever eligible
- 86% (or 596,200) of those who did not belong to the CALD cohort (NDIA 2023b).
Additionally, eligibility varies by disability group; for example, of those aged 64 and under:
- 97% (or 221,200) of applicants with autism were ever eligible
- 95% (or 94,800) of applicants with intellectual disability were ever eligible
- 70% (or 67,400) of applicants with psychosocial disability were ever eligible (Figure NDIS.2, NDIA 2023b).
Figure NDIS.2: Eligibility of NDIS applicants aged 0–64, by disability group, 30 June 2023
The chart shows that proportion of applicants deemed eligible varies by disability group, such as autism (97% eligible) or psychosocial (70%).
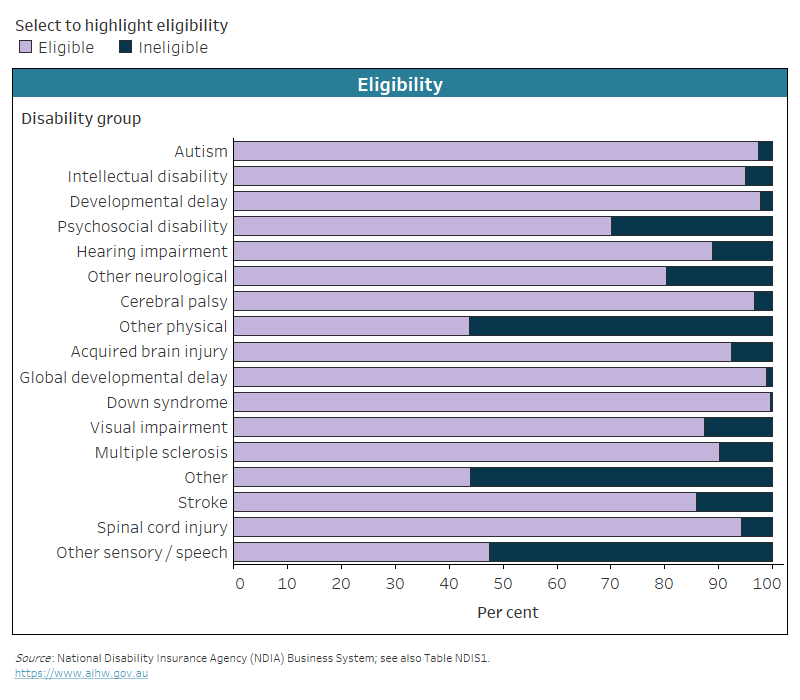
Notes:
- Age is as at the access decision date.
- ’Eligible’ means ever eligible.
- Ineligible only includes persons that have a complete access decision and are not eligible.
- Disability group categories are listed from most applicants at the top to least applicants at the bottom.
- Primary disability is self-reported for ineligible participants and may not be appropriate for comparison with primary disability of eligible participants.
Source data tables: Data tables – NDIS. View data tables
Active participants
At 30 June 2023, there were around 610,500 active participants with approved plans in the NDIS. Of them, 95% (or 583,000) were aged under 65, and 4.5% (or 27,500) were aged 65 or over.
For most up-to-date numbers, see NDIS quarterly reports.
Compared with all people with disability in Australia, the NDIS participants are a much younger group. Among active NDIS participants as at 30 June 2023:
- 43% (or 260,700) were aged 14 or under
- 33% (or 202,600) were aged 15–44
- 20% (or 119,700) were aged 45–64
- 4.5% (or 27,500) were aged 65 and over (Figure NDIS.3, NDIA 2023b).
In comparison, in 2018, 8.2% (or 356,000) of all people with disability in Australia were aged 14 or under, and 44% (or 1.9 million) were aged 65 or over (ABS 2019).
At 30 June 2023, among 583,000 active NDIS participants aged under 65:
- 62% (or 360,700) were males and 37% (or 214,700) were females
- 7.9% (or 46,000) or participants identified as First Nations people
- 9.2% (or 53,500) of participants identified as culturally and linguistically diverse
- 68% (or 398,800) lived in major cities, 30% (or 175,200) lived in regional cities and towns, and 1.5% (or 9,000) lived in remote or very remote areas
- the top 5 primary disability groups were:
- autism (37% or 214,600 people)
- intellectual disability (15% or 85,800 people)
- developmental delay (12% or 67,600 people)
- psychosocial disability (9.9% or 57,500 people)
- hearing impairment (4.3% or 25,000 people) (Figure NDIS.3, NDIA 2023b).
Figure NDIS.3: Profile of NDIS participants, by selected characteristics, 30 June 2023
The chart shows selected characteristics of NDIS participants, such as gender (62% males), age (43% under 15) and primary disability (autism 37%).
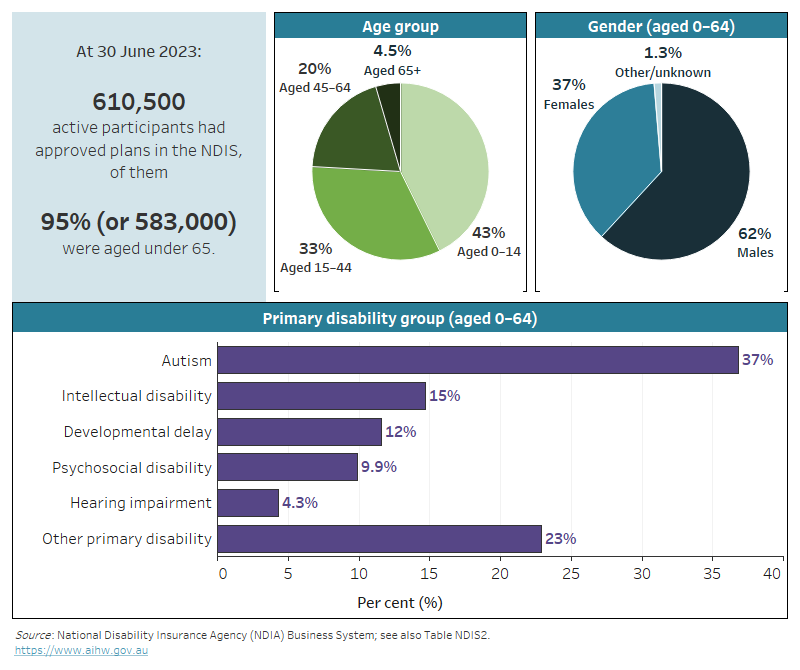
Notes:
- Age is as at the report date.
- Data in gender and primary disability group panels are for participants aged under 65.
- Top 5 primary disability group categories are listed. The remaining categories are grouped as ‘other’.
Source data tables: Data tables – NDIS. View data tables
Children in the NDIS
The early childhood approach is the way the NDIS supports young children with developmental concerns, developmental delay or disability. At 30 June 2023, there were around 99,400 children younger than 7 with an approved NDIS plan developed as part of the early childhood approach.
In addition to those with an approved plan, 14,600 children were supported through early connections as part of the early childhood approach at 30 June 2023 (NDIA 2023c). Early connections can help support children with developmental concerns regardless of whether they are eligible for the NDIS. Early connections work by connecting the children and their families with mainstream and community services, other families, or early supports services.
From 1 July 2023, the access to early childhood approach was extended to children younger than 9.
Participants goals and outcomes
As part of the NDIS planning process, participants discuss and identify their plan goals – things they want to achieve with support from the NDIS and other support services. The goals are set by participants in their own words, can be short- or long-term, as many as desired by the participant, and can change during the course of the plan.
NDIS participants plan goals
NDIS plan goals are usually grouped for reporting purposes (to see how goals differ between groups of participants) into 8 domains:
- Choice and control over my life: Includes independence, decision-making and whether the participant would like to have more choice and control in their life.
- Daily life: Explores how independent participants are in nine areas of daily living, for example shopping and home cleaning.
- Work: Explores participants' experiences in the workforce and goals for employment.
- Where I live: Relates to participants' satisfaction in their home now and in five years' time, and whether they feel safe.
- Health and wellbeing: Relates to health, lifestyle and access to health services.
- Learning: Includes educational, training and learning experiences.
- Relationships: Relates to whether a participant has someone to call on for practical advice or emotional support, about contact with family and friends and about relationships with staff.
- Social and community participation: Relates to hobbies, volunteering, involvement in community, voting, leisure activities and whether the participant feels they have a voice.
The goals most commonly identified by all participants are Daily life (84% of all participants), Social and community participation (74%) and Health and wellbeing (43%) (Figure NDIS.4).
The differences between NDIS plan goals mostly relate to participant’s age (see Figure NDIS.4):
- For young children (aged under 7), their goals mostly relate to daily life (94%), learning (65%), and social and community activities (77%).
- Work is a goal most often identified by participants aged 19–24 (60%), followed by participants aged 25–34 (50%).
- Where I live is a goal more often identified by older age groups – 35% or higher for all age groups over 24, compared with 24% for those aged 19–24.
- Learning is a goal more often identified by younger age groups – 65% of participants aged under 7 and 42% of participants aged 7–14 name Learning as one of their plan goals, compared with 14% of participants aged 55–64 (Figure NDIS.4).
Other differences between goals relate to severity of participants' disability (Figure NDIS.4). For participants aged under 65:
- Choice and control, Where I live, Health and wellbeing, and Social and community activities are more likely to be named as goals by participants with higher disability severity scores.
- Learning is more likely to be named as a goal by participants with lower disability severity score.
- Work is most likely to be named as a goal by participants with a medium disability severity score (Figure NDIS.4).
What is the NDIS disability severity score (level of function)?
Level of function indicates the impact of the NDIS participant's disability on how a person is able to perform tasks and actions in a life area, as represented by a ‘severity score’. ‘High level of function’ indicates lower service and support requirements with a lower severity score (1–5), ‘medium level of function’ indicates medium service and support requirements with a severity score of 6–10, and ‘low level of function’ indicates higher service and support requirements with a higher severity score (11–15) (NDIS Commission 2023).
Figure NDIS.4 NDIS participants’ plan goals, by age and selected characteristics, 30 June 2023
The chart shows proportions of NDIS participants' plans that have certain goals, from ‘Where I live’ (18% of plans) to ‘Daily life’ (84%).
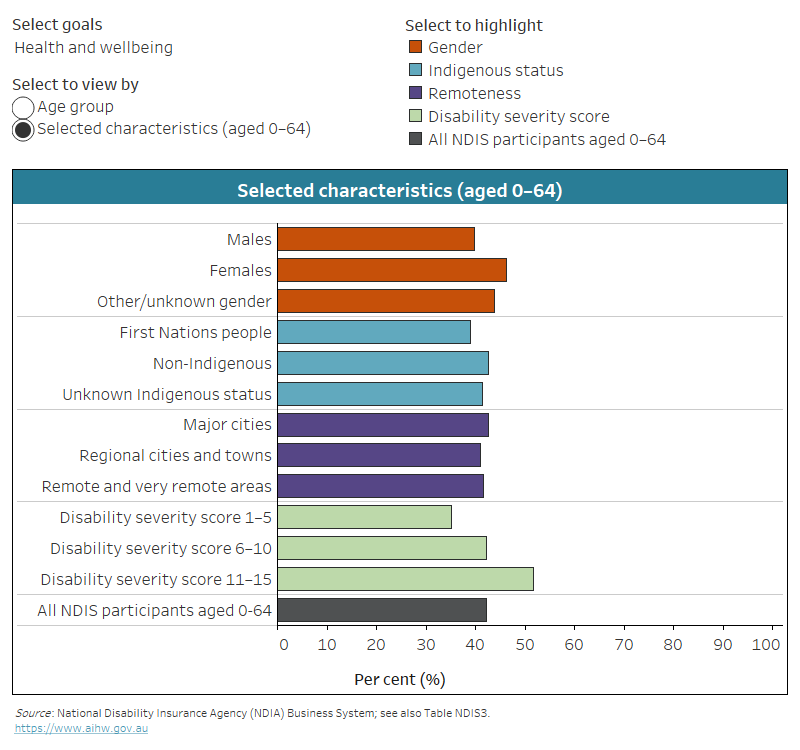
Notes:
- Age is as at the report date.
- Participants may have more than one plan goal.
- Data for participants aged 0–6 with work plan goals are not shown due to confidentiality processes.
- Disability severity score of 1–5 indicates high level of function, 6–10 indicates medium level of function, 11–15 indicates low level of function.
Source data tables: Data tables – NDIS. View data tables
The NDIS outcomes framework questionnaires collect information on 8 life domains from participants, their families and their carers. The framework uses a lifespan approach to provide some measures of the medium- to long-term benefits to participants at different stages of life. This includes asking whether the NDIS has helped with various aspects of their life. For example, by 30 June 2023, for participants who had been in the NDIS for at least 2 years:
- 42% of participants aged 15 and over were able to participate in community and social activities, compared with 35% for the same participants when they had started with the NDIS
- 23% of participants aged 15–64 were in a paid job, compared with 21% for the same participants at entry into NDIS
- for 94% of child participants aged 0 to before starting school, their parents and carers thought the NDIS had improved their child’s development (NDIA 2023c).
Supports received by participants
This section discusses different types of NDIS supports received by participants, the committed support amounts included in the participants' budgets, and the rates of utilisation of the committed supports.
Types of NDIS supports
National Disability Insurance Scheme (NDIS) participants choose and pay for supports and services out of an individually allocated budget based on their goals. Supports and services for participants fall under the following 3 budgets:
- core – a support that helps a participant complete daily living activities
- capital – a support for an investment (for example, assistive technologies, equipment and home or vehicle modifications) or funding for capital costs
- capacity building – a support that helps a participant build their independence and skills
For more information, see Supports and services funded by the NDIS.
At 30 June 2023, almost all participants (99%) had received some Capacity building supports, about 1 in 5 (19%) received Capital supports, and 9 in 10 (90%) received Core supports.
In general, there is little to no variation in the proportions of participants receiving Capacity building and Core supports depending on age or other demographic or disability-related characteristics of the participants. However, the receipt of Capital supports varies for sub-groups of participants: older participants are more likely to receive some Capital supports than the younger ones – 54% of participants aged 65 or over and 46% of participants aged 55–64 receive Capital supports, compared with 6.9% of participants aged under 7.
Among participants aged under 65:
- females (22%) are more likely to receive Capital supports than males (15%)
- First Nations participants (13%) are less likely to receive Capital supports than non-Indigenous participants (18%) (where the Indigenous status is known)
- participants from CALD backgrounds (20%) are more likely to receive Capital supports than those in the non-CALD group (17%)
- participants with a lower level of functioning are more likely to receive Capital supports – 39% of participants with a low level of function (high severity score) receive these supports, compared with 12% of those with medium level of function and 9.3% of those with high level of function (low severity score)
- the receipt of Capital supports also varies between disability groups – the group with the highest proportion of participants receiving these supports are participants with spinal cord injury (88%), compared with 2.9% of participants with developmental delay (NDIS 2023b).
Data note – reporting on amounts of committed supports
Data on amounts of committed supports as at 30 June 2023 covers supports provided during 1 October 2022 to 31 March 2023 and paid for by 30 June 2023. This is the usual reporting practice for these data (to cover payments made in a 6-month period ending 3 months prior to the reporting date), to allow for payments for supports which have occurred in those 6 months to be included.
Differences are also observed in the amount of supports committed under the participants' budgets (for participants aged under 65, as at June 2023):
- older participants tend to have higher average annualised committed total supports – $138,200 for participants aged 55–64, compared with $25,400 for participants aged under 7
- participants with lower level of functioning have higher average annualised committed total supports – $166,900 for those with low level of function (high severity score), compared with $25,900 for those with high level of function (low severity score) (NDIS 2023b).
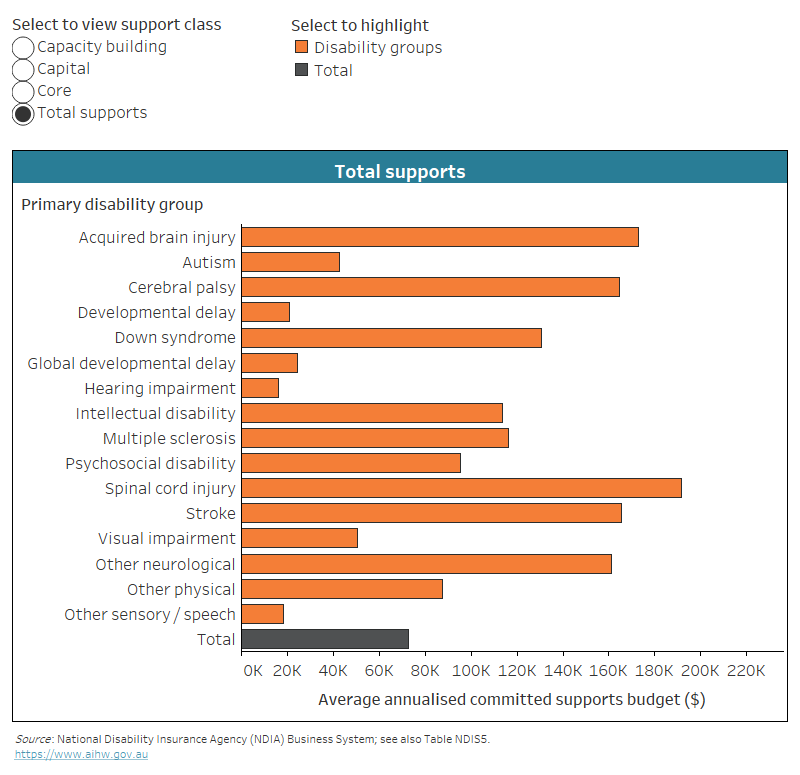
Support amounts also differ depending on primary disability of the participant. Among participants aged under 65, those with a spinal cord injury have the highest amount of average annualised committed total supports ($191,600), while those with hearing impairment have the lowest ($16,000) (Figure NDIS.5).
Figure NDIS.5: Average annualised committed supports budgets of NDIS participants aged under 65, by support type and primary disability group, 30 June 2023
The chart shows that participant budgets vary by primary disability, from hearing impairment ($16,000 total supports) to spinal cord injury ($191,600).
Notes:
- Support class include those supports received through NDIS plans.
- Participants may receive more than one type of support.
- The data cover supports provided during 1 October 2022 to 31 March 2023 and paid for by 30 June 2023. The data are reported with a 3-month lag and 6-month exposure period.
Source data tables: Data tables – NDIS. View data tables
NDIS plan utilisation
The analysis above discussed ‘committed supports’ – the amounts allocated within a participant's plan budget to be used for a specific type of support. Another way to look at supports received by the NDIS participants is to examine what proportion of the committed supports was used by the participant to pay for those supports – also known as the NDIS plan utilisation rate.
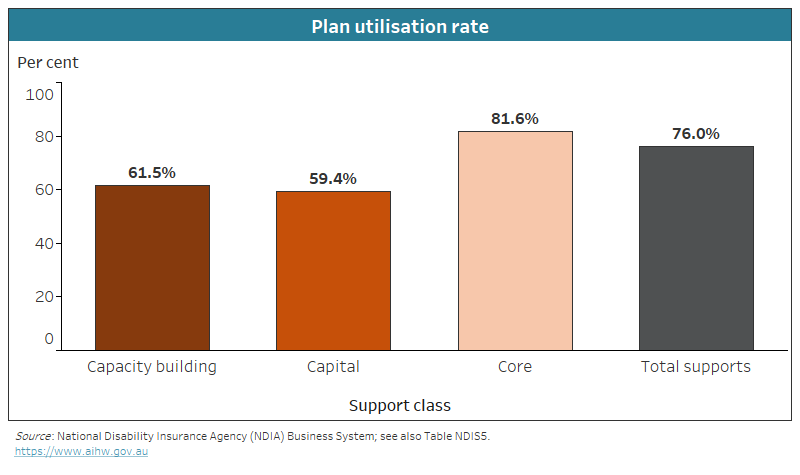
At June 2023, the overall utilisation rate of the NDIS plans was 76% (Figure NDIS.6). Across the three main types of support (core, capital, and capacity building), the capital supports component had the lowest utilisation rate at 59%.
What is the NDIS plan utilisation?
Utilisation refers to the amount of the plan budget that a participant uses.
The plan utilisation data reported as at 30 June 2023 covers supports provided during 1 October 2022 to 31 March 2023 and paid for by 30 June 2023. This is the usual reporting practice for these data (to cover payments made in a 6-month period ending 3 months prior to the reporting date), to allow for payments for supports which have occurred in those 6 months to be included.
How high should the NDIS plan utilisation be?
Since the NDIS commenced in 2013, there have been concerns about utilisation rates of NDIS plans (see, for example, PC 2017). Low utilisation rates may mean that NDIS participants are not receiving the supports and services they need, while high utilisation rates may indicate that the allocated supports are not sufficient to participants' needs.
In 2020 the Australian Government Department of Social Services commissioned a project to better understand the relationship between participants' plans and the supports they wish to purchase and why participants might not use all the funds allocated in their NDIS plan. The report concluded that a benchmark utilisation rate would not be helpful in measuring the scheme's effectiveness. A better way would be to track the change in utilisation rates over time, or to compare plan budgets, spending, and utilisation rates between groups of participants (Melbourne Disability Institute et al. 2021).
Figure NDIS.6: Plan utilisation rate of NDIS participants aged under 65, by type of support, 30 June 2023
The chart shows that plan utilisation rates of NDIS participants vary by support class, from 59% (capital supports) to 82% (core supports).
Notes:
- Support class refers to supports received through NDIS plans.
- Participants may receive more than one type of support.
- The data covers supports provided during 1 October 2022 to 31 March 2023 and paid for by 30 June 2023. The data are reported with a 3-month lag and 6-month exposure period.
Source data tables: Data tables – NDIS. View data tables
There is some variation across groups of participants in allocated total support amounts and utilisation rates. Older participants are more likely to have higher support amounts allocated in their plans, and to have higher utilisation rates than younger participants – for example, participants aged 55–64 had average annualised committed supports of $138,200 and 78% utilisation rate, compared with $25,400 and 64%, respectively, for participants aged under 7 (NDIS 2023b).
Among participants aged under 65:
- females tend to have higher allocated total supports and slightly higher utilisation rates than males – $79,200 and 77%, respectively, for female participants, compared with $69,100 and 76% for male participants
- First Nations participants on average have higher allocated total supports but lower plan utilisation rates than non-Indigenous participants – $74,800 and 72%, compared with $71,200 and 76%, respectively (where Indigenous status is known)
- participants from CALD backgrounds have higher allocated total supports and higher utilisation rates than those in the non-CALD group – $75,700 and 80%, compared with $72,000 and 76%, respectively (where CALD status is known)
- participants living in Major cities have the highest utilisation rates (77%) while those in Very remote areas have the lowest (55%)
- participants with a lower level of functioning have higher allocated total supports and higher utilisation rates – $167,000 and 81%, respectively, for participants with a low level of function (high severity score), compared with $25,900 and 64%, respectively, for those with high level of function (low severity score) (NDIS 2023b).
Met and unmet need for formal services
In 2018, an estimated 40% (or 1.7 million) of people with disability living in households needed assistance from formal providers. Most (86% or 1.4 million) people with disability who needed formal assistance with at least one activity received some support. For those receiving formal assistance, the providers were most often private commercial organisations (61% or 886,000) or government providers (46% or 667,000) (a person can receive support from more than one provider) (ABS 2019).
Data note
Data in this section are sourced from the Australian Bureau of Statistics' (ABS) 2018 Survey of Disability, Ageing and Carers (SDAC). For more information about the SDAC, including the concepts of disability, disability severity, disability groups, and remoteness categories used by the SDAC, see ‘Data sources’.
Unless otherwise indicated, all data in this section refer to 2018.
Interpreting the data in this section
The SDAC includes some information on the level of service people with disability receive from formal (or organised) service providers. These data are provided here for context and are not intended to be a direct evaluation of specialist service provision under the National Disability Insurance Scheme (NDIS). In particular:
- the latest survey was conducted in 2018, which was part-way through the NDIS rollout
- not all formal services are specialist services
- formal services may or may not receive government funding.
Most people with disability receiving formal assistance were satisfied with the quality and range of services:
- 82% (or 847,000) of people with disability, aged 15 and over, who received formal assistance with at least one activity in the last 6 months were satisfied with the quality of service (where level of satisfaction could be determined)
- 73% (or 800,000) of people with disability, aged 15 and over, who needed assistance with at least one activity from an organised service were satisfied with the range of services (where level of satisfaction could be determined) (ABS 2019).
Australia's Disability Strategy reporting
Availability of support is one of the priorities reported on under the Australia's Disability Strategy. The Strategy's outcomes framework reports on the proportion of people with disability (aged 15–64, and 65 and over) who are satisfied with the quality of assistance received from formal service providers. For more information, including trends and comparisons by population groups, please see Quality of formal support on Reporting on Australia's Disability Strategy 2021–2031 website.
Not everyone with disability receives all the help they need from formal services. Common activities for which the need for formal assistance was unmet include:
- cognitive or emotional tasks (40% or 286,000 people with disability, aged 64 and under, living in households who need formal assistance with that activity)
- communication (38% or 86,000)
- property maintenance (31% or 139,000)
- household chores (31% or 124,000)
- mobility (20% or 98,000) (ABS 2019).
The reasons given for not receiving any or more help from an organised service with at least one activity include:
- service costs too much (38% or 199,000 people with disability, aged 64 and under, with an unmet need for formal assistance)
- did not know of service (18% or 95,000)
- not eligible for service (16% or 84,000)
- service does not provide sufficient hours (14% or 73,000)
- unable to arrange service (14% or 72,000)
- no service available (13% or 68,000) (ABS 2019).
Reasons for not receiving any or more help from an organised service with at least one activity differ by remoteness. Among people with disability aged 64 and under, with an unmet need for formal assistance:
- people living in Outer regional and remote areas were more likely (24% or 15,000) not to receive help due to no service being available than those living in Major cities (9.1% or 31,000)
- people living in Inner regional areas were more likely (23% or 26,000) not to receive help due to not being eligible for service than those living in Major cities (14% or 49,000) and Outer regional and remote areas (15% or 9,000)
- people living in Major cities were more likely (40% or 140,000) not to receive help due to service costing too much than those living in Outer regional and remote areas (27% or 16,000) (ABS 2019).
Where can I find out more?
- Data tables for this report.
- Information on services provided under the National Disability Agreement (NDA) – archived versions of this report and AIHW Disability Services National Minimum Data Set.
- Information about the National Disability Insurance Scheme (NDIS) – NDIS website.
- Latest data on the NDIS – Data and insights and Quarterly reports.
- ABS Disability, Ageing and Carers, Australia: Summary of Findings, 2018.
- Data on the use of disability services, including on met and unmet need for services – Productivity Commission's Report on Government Services.
ABS (2019) Microdata: disability, ageing and carers, Australia, 2018, ABS cat. no. 4430.0.30.002, AIHW analysis of TableBuilder data, accessed 12 August 2021.
Australian Government (2013) Federal Register of Legislation – National Disability Insurance Scheme Act 2013, Australian Government.
Melbourne Disability Institute (at the University of Melbourne), Public Service Research Group (at the University of New South Wales Canberra), and Future of Employment and Skills Research Centre (at the University of Adelaide) (2021) Commonwealth study into NDIS plan utilisation – Synthesis report June 2021, accessed 22 November 2023.
NDIA (National Disability Insurance Agency) (2020a) NDIA 2019–20 annual report, NDIA, accessed 21 September 2021.
NDIA (2020b) Delivering the NDIS: roll-out complete across Australia as Christmas and Cocos Islands join world-leading scheme [media release], NDIA, Australian Government, accessed 21 September 2021.
NDIA (2023a) Annual financial sustainability report 2022–23, NDIA, accessed 4 January 2024.
NDIA (2023b) AIHW customised data request, NDIA, accessed 29 September 2023.
NDIA (2023c) NDIS quarterly report to disability ministers for Q4 of 2022–23, 30 June 2023, NDIA, accessed 13 November 2023.
NDIS Commission (NDIS Quality and Safeguards Commission) (2023) Information Supplement A – Glossary, Own Motion Inquiry into how Platform Providers operate in the NDIS Market, Insights Report, NDIS Commission, accessed 24 November 2023.
PC (Productivity Commission) (2017) National Disability Insurance Scheme Costs: Productivity Commission Study Report, PC, Australian Government, accessed 22 November 2023.
SCRGSP (2023) Report on Government Services 2023, Productivity Commission, Australian Government, accessed 22 November 2023.