Culturally and linguistically diverse older people
Australia’s older people (aged 65 and over) come from all corners of the world and there is no single way to define what it means to be from a culturally and linguistically diverse (CALD) background. For example, it can refer to people who were not born in Australia, whose preferred language or the language they speak at home is a language other than English, or those who do not speak English well (referred to as English language proficiency). It can also include Aboriginal or Torres Strait Islander people – or can comprise a mix of these elements. People’s experiences and circumstances can also vary considerably even within a particular group.
Throughout this feature article, ‘older people’ refers to people aged 65 and over. Where this definition does not apply, the age group in focus is specified. The ‘Older Aboriginal and Torres Strait Islander people’ feature article defines older people as aged 50 and over. This definition does not apply to this article, with Indigenous Australians aged 50–64 not included in the information presented.
In addition to country of birth, preferred language, English language proficiency and Indigenous status, CALD measures can include factors such as the following (individually, or in combination with others):
- non-English-speaking country of birth – where countries re classified based on the main language spoken (English or another language) by the population. For the purpose of this report, non-English-speaking countries of birth comprise those other than the main English-speaking countries of New Zealand, United Kingdom, Ireland, United States of America, Canada and South Africa
- people’s ancestry and their parents’ country of birth
- first language spoken or other languages spoken
- religious affiliation
- year people arrived in Australia (or the time they have lived in Australia)
- migration pathways (for example, whether people moved to Australia as children, as refugees or as skilled migrants).
This article considers this diverse population from multiple perspectives and presents an overview of what key data sources tell us about CALD older Australians. Due to data availability, it primarily focuses on country of birth and English language proficiency as measures of cultural and linguistic diversity.
For information on older Aboriginal and Torres Strait Islander Australians, see Older Aboriginal and Torres Strait Islander people.
Demographic profile
Country of birth
According to the 2016 Australian Bureau of Statistics (ABS) Census, 1.2 million older Australians had been born overseas, representing over one-third (37%) of all people aged 65 and over.
Among those who were born overseas, the most common regions of birth were North-West Europe, Southern and Eastern Europe and South-East Asia. However, a somewhat smaller proportion were from Europe in the younger age groups compared with the older ages, and a somewhat higher proportion were from Asia and other regions (Figure 2B.1).
Figure 2B.1: Region of birth for older Australians born overseas by age group, 2016
The stacked column graph shows that, among older Australians born overseas, the most common region of birth was North-West Europe (41% of overseas-born Australians aged over 65 and 46% of overseas-born Australians aged over 100).
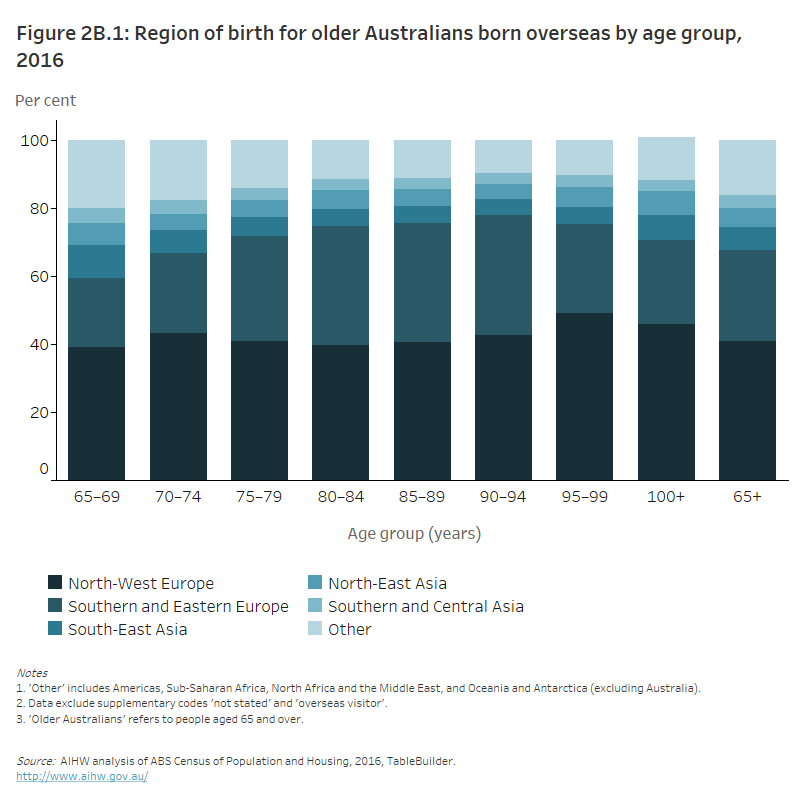
This trend can be expected to increase over time as it reflects broader migration patterns in the period following World War II. For example, the proportion of migrants from Europe has been declining in recent years, falling from 52% in 2001 to 34% in 2016 (ABS 2017). In contrast, there has been an increase in migration from Asian countries over the last few decades, and older Australians born overseas who have arrived in Australia since the 1970s are more likely to have migrated from Asia than Europe (ABS 2017).
Year of arrival
Many overseas-born older Australians migrated to Australia in their youth or middle age: 28% arrived before 1960, 65% in the 4 decades between 1960 and 1999, and only 6.9% since 2000 (Table 2B.1).
Age group (years) | Before 1960 | Between 1960 and 1999 | 2000 or later |
|---|---|---|---|
65–69 | 21.7 | 69.8 | 8.5 |
70–74 | 22.4 | 70.4 | 7.2 |
75–79 | 25.8 | 67.7 | 6.4 |
80–84 | 36.6 | 58.1 | 5.2 |
85–89 | 46.7 | 49.2 | 4.1 |
90–94 | 56.4 | 40.1 | 3.4 |
95–99 | 56.5 | 38.2 | 5.0 |
100+ | 50.8 | 39.2 | 7.2 |
Total | 27.8 | 65.4 | 6.9 |
Note: 'Older Australians’ refers to people aged 65 and over.
Source: AIHW analysis of ABS 2016a.
Geographical distribution
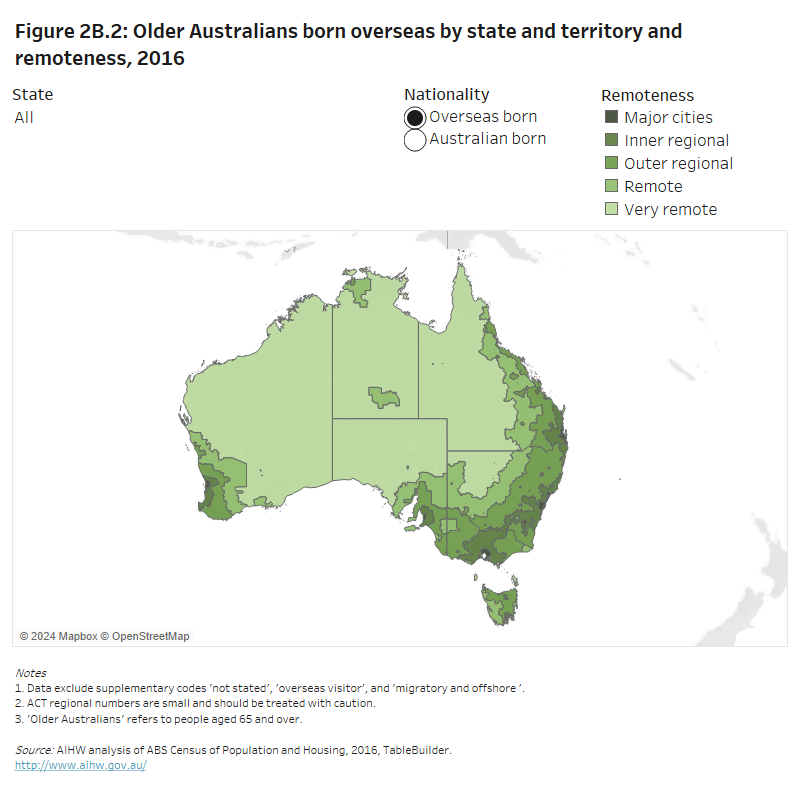
The cultural and linguistic diversity of older Australians varies between geographies; for example, when measured by where people were born and the state or territory and remoteness area where they were living on Census night in 2016. In Major cities in New South Wales, Victoria and Western Australia, around half of older Australians were born overseas (46%, 51% and 51%, respectively) compared with 34% in Queensland (Figure 2B.2) (AIHW analysis of ABS 2016a). Note that this does not take into account details of people’s cultural or linguistic background or other contextual information that may be relevant to diversity.
Figure 2B.2: Older Australians born overseas by state and territory and remoteness, 2016
The map shows the geographical distribution of overseas- and Australian-born older Australians across state and territory and remoteness areas. The proportion of overseas-born older Australians was highest in major cities (approximately half of older Australians in New South Wales, Victoria and Western Australia).
Language
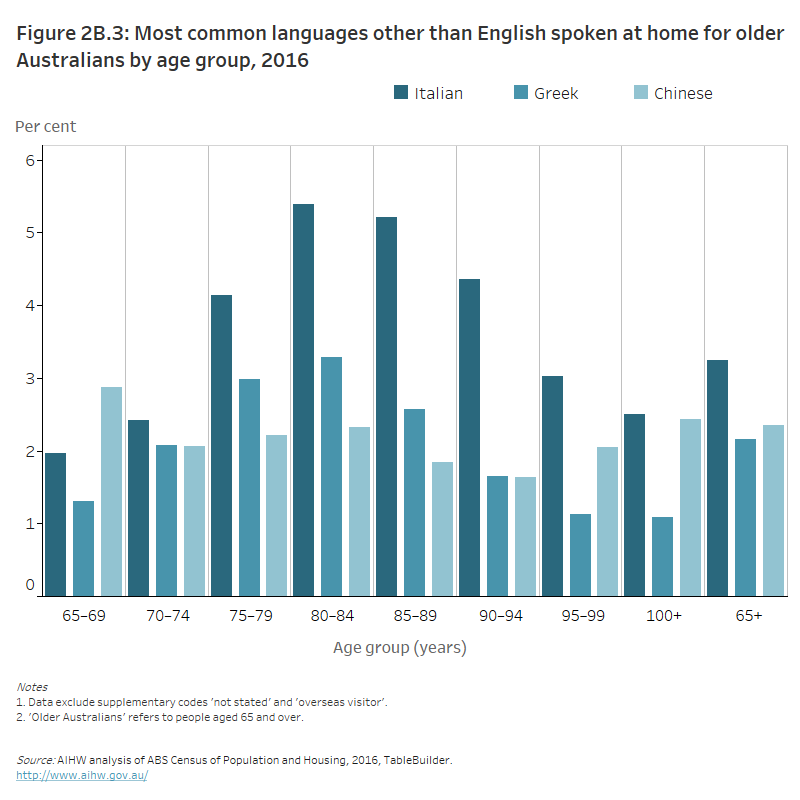
One in 5 (20%) older Australians (aged 65 and over) were born in non-English speaking countries, and 18% spoke a language other than English at home, according to the 2016 Census. The most common individual languages were Italian, Chinese (including both Cantonese and Mandarin) and Greek (Figure 2B.3). These patterns were similar for both men and women (AIHW analysis of ABS 2016a).
Figure 2B.3: Most common languages other than English spoken at home for older Australians by age group, 2016
The column graph shows that, of older Australians speaking the most common languages other than English, people aged 80–84 had the greatest proportion of other languages spoken (11% spoke Italian, Greek or Chinese). The proportion of people speaking Italian was higher than the proportion of people speaking Greek and Chinese in older age groups, with the exception of people aged 65–69 for whom the highest proportion spoke Chinese.
According to the 2016 Census, around 4 in 5 (82%) older Australians only spoke English. This can be connected with where people were born: 99% of those born in Australia only spoke English, compared with 54% of those born overseas. Of those born overseas who did not only speak English, 29% spoke English either well or very well.
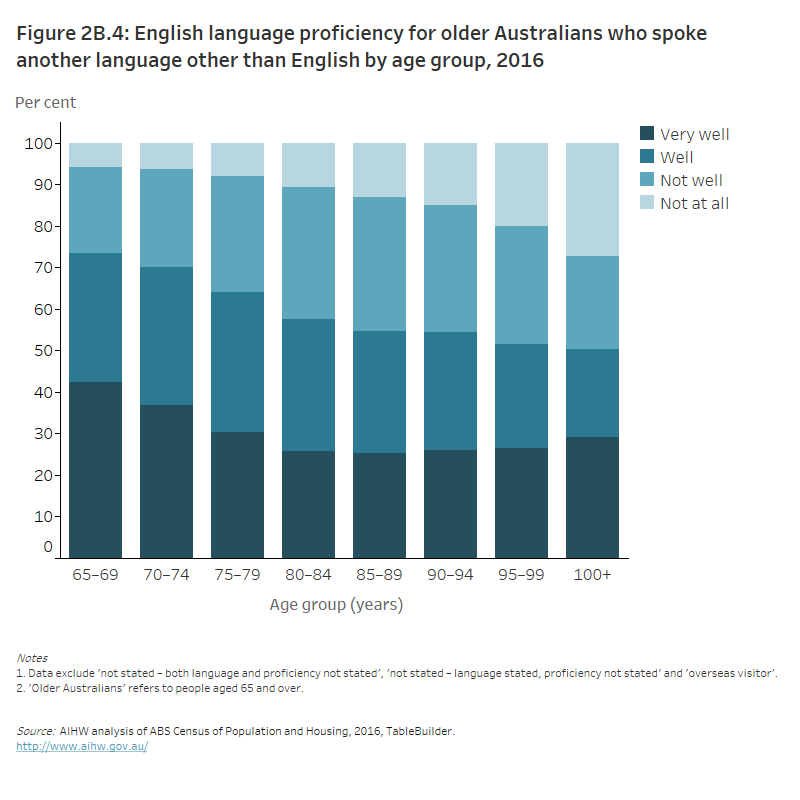
Of all older Australians, 12% spoke another language other than English and spoke English well or very well, and 6% spoke another language other than English and spoke English not well or not at all. Looking only at this group of older people (those who spoke another language other than English), the proportion who spoke English well or very well decreased with age (Figure 2B.4) (AIHW analysis of ABS 2016a).
Figure 2B.4: English language proficiency for older Australians who spoke another language other than English by age group, 2016
The stacked column graph shows that the majority of older Australians who spoke another language other than English could speak English ‘well’ or ‘very well’. The proportion of people who spoke English ‘well’ or ‘very well’ decreased with increasing age (73% of people aged 65-69 compared to 50% of people aged over 100).
Religious affiliation
Almost 4 in 5 (78%) older Australians identified their religious background as Christian (commonly Catholic or Anglican), according to the 2016 Census. Other religions represented 3.7% (of these, the most common religious affiliation was Buddhism at 1.5%), while secular beliefs, other spiritual beliefs and no religious affiliation collectively accounted for 18% of older Australians. This last proportion was generally higher in the younger age groups (ABS 2017) (Table 2B.2). Note that questions around religious affiliation in the 2016 Census were voluntary and this section excludes not stated or inadequately described responses.
Age group (years) | Christianity | Other religions | Other beliefs or no belief |
|---|---|---|---|
65–69 | 72.8 | 4.7 | 22.4 |
70–74 | 77.8 | 3.7 | 18.5 |
75–79 | 81.6 | 3.2 | 15.3 |
80–84 | 83.3 | 2.8 | 13.8 |
85–89 | 84.1 | 2.7 | 13.2 |
90–94 | 84.5 | 2.8 | 12.7 |
95–99 | 82.6 | 3.5 | 14.0 |
100+ | 81.3 | 4.4 | 14.3 |
Total | 78.3 | 3.7 | 18.0 |
Note: 'Older Australians' refers to people aged 65 and over.
Source: ABS 2017.
Health and functional status
People’s circumstances can influence their health status, what they need from health services, and how they access these. However, as the previous section has shown, older Australians from CALD backgrounds are not a homogenous group. As a result, the personal experiences, health status and health needs of individuals within any given group can vary greatly. The subgroups that make up the CALD population can also change over time (see ‘Demographic profile’ above).
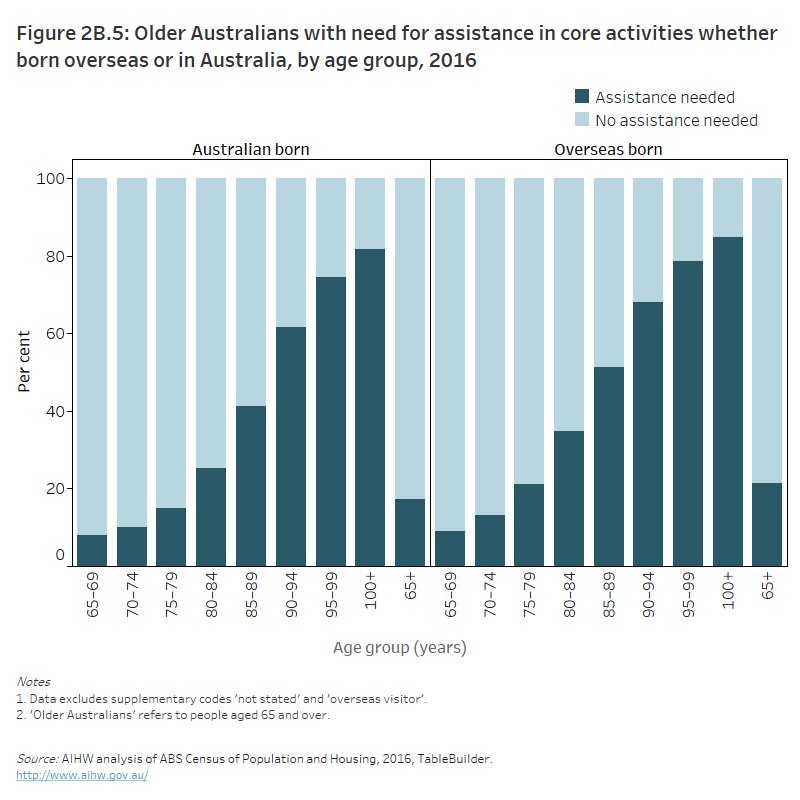
As with all older people, the proportion of older people (aged 65 and over) from CALD backgrounds who need assistance with core activities (communications, self-care and mobility) increased with age (Figure 2B.5). For more information on older people with disability, see Health status and functioning.
Figure 2B.5: Older Australians with need for assistance in core activities whether born overseas or in Australia, by age group, 2016
Two stacked bar charts show that the proportion of older Australians needing assistance in core activities increases with age. The proportion of people requiring assistance was slightly higher in overseas born older Australians. The greatest difference in need for assistance was in older Australians aged 80–84 and 85–89 (proportion of people needing assistance was 10% higher among people born overseas compared to Australian born).
According to self-reported data in the 2017–18 ABS National Health Survey (NHS), of older Australians born overseas:
- 13% had exceeded lifetime alcohol risk guidelines (7-day average 2009 guidelines; NHMRC 2009)
- 7.1% were current daily smokers
- 68% had not met 2014 physical activity guidelines (see ABS 2019c for information on how the NHS derives the physical activity guidelines as being met)
- 1.7% met the recommended serves of vegetables only (see NHMRC 2013 for recommended serves)
- 57% met the recommended serves of fruit only (see NHMRC 2013 for recommended serves)
- 7.4% met the recommended serves of both fruit and vegetables (AIHW analysis of ABS 2019a; see NHMRC 2013 for recommended serves).
Around 4 in 10 (41%) older Australians born overseas reported their health as excellent or very good, and almost 1 in 2 (45%) reported experiencing no pain or very mild pain in the past 4 weeks (AIHW analysis of ABS 2019a). Considering selected measures of health service use, almost all (97%) older Australians born overseas had seen a general practitioner in the last 12 months, and around half (48%) had seen a dentist (AIHW analysis of ABS 2019b).
Aged care
As with health care, it can be difficult for some groups of older Australians to access aged care services. For example, they may face language barriers, and available services may not be culturally appropriate or they may fail to meet people’s needs. Cultural practices and family culture can also influence what a person needs from aged care services and how they access them. For example, where informal, family-centred care is available, people may not seek formal aged care.
Around 28% of people using home care, 20% of people using permanent residential aged care and 20% of people using respite or transition care at 30 June 2020 were from a CALD background (Department of Health 2020). (In this case, CALD background refers to the proportion of people who were born overseas in countries other than the main English-speaking countries. This may underestimate the proportion of people from a CALD background as it is only one marker of cultural and linguistic diversity.) For all older Australians, information is presented on aged care and related information is available in housing and living arrangements.
Varying slightly between programs, around 1 in 8 (12%) aged care users at 30 June 2020 had a preferred language other than English (AIHW 2020). The aged care workforce commonly includes many people from non-English-speaking backgrounds, but from different backgrounds to those common among aged care users. For example, in residential aged care facilities where at least one-third of personal care attendants spoke a language other than English, facilities commonly identified Indian and Filipino as the workers’ background (Mavromaras et al. 2017). This is an important consideration in terms of language barriers, for which currently no data exist to allow a more detailed study. The Department of Health’s 2020 Aged Care Workforce Census found that 36% of personal care attendants in residential aged care identified as being from a CALD background, increasing to 58% in facilities with a higher proportion of CALD residents (Department of Health 2021). However, these figures provide no indication of overlap between the CALD background of staff and that of residents. Similar issues may be present in other sectors, such as disability support.
Social support
According to the 2016 Census, around 1 in 8 overseas-born older Australians provided support to someone with disability (13%), took part in voluntary work (15%) or provided unpaid child care (14%). Similarly, around 1 in 7 Australian-born older people provided support to someone with disability (14%) or provided unpaid child care (14%). Almost 1 in 4 (24%) Australian-born older people took part in voluntary work.
Proficiency in the local language may influence people’s sense of social connectedness. The 2016 ABS Personal Safety Survey indicated that nearly all (95%) older people who mainly spoke another language at home but spoke English well or very well had visited (or had been visited by) friends in the last 3 months (AIHW analysis of ABS 2016b).
For more information on social support for all older Australians, see Social support.
Housing and living arrangements
In 2016, older Australians who were born overseas were somewhat less likely to own their home outright, and somewhat more likely to be either mortgaged or renting, compared with those born in Australia (Table 2B.3).
Table 2B.3: Housing tenure type of older Australians, by whether born overseas or in Australia, 2016
Place of birth | Owned outright | Mortgaged or being purchased | Rented | Other |
|---|---|---|---|---|
Overseas | 68.0% | 14.5% | 14.9% | 2.6% |
In Australia | 74.3% | 10.5% | 11.9% | 3.3% |
Note: 'Older Australians' refers to people aged 65 and over.
Source: AIHW analysis of ABS 2016a.
Around 5.2% of overseas-born older Australians reported living in a multi-family household in 2016 compared with 1.9% of those born in Australia. This suggests that intergenerational living may be more common for some older people from CALD backgrounds. This may also account for some of the variation in housing arrangements seen above; for example, living with family, people may be less likely to need to move into residential aged care.
Around 1.2% of overseas-born older people were experiencing some form of homelessness on Census night in 2016 (defined as living in caravan parks, boarding houses, supported accommodation or similar, or in temporary, improvised or crowded dwellings). This compared with 2.3% of Australian-born older people (AIHW analysis of ABS 2016a).
Education and skills
More than 1 in 2 (52%) older Australians aged 65–74 who were born overseas had a highest educational attainment of year 12 or below. More than 1 in 5 had a bachelor degree or a higher qualification (22%), and another 1 in 5 had a certificate (III or IV) or diploma (21%) (AIHW analysis of ABS 2020).
For people aged 65–74 born overseas, whose highest level of education was a bachelor degree or higher, 1 in 5 had a main field of study of management and commerce (20%) and another 14% in engineering and related technologies (AIHW analysis of ABS 2020). These patterns may have been influenced by skilled migration pathways into Australia and may be different for different cohorts of older people. The fields people study also vary by sex; for more information on this for all older Australians, see Education and skills.
Employment and work
In 2020, more than 1 in 6 (18%) overseas-born people aged 65–74 were still working. The most common occupations of work were professionals and managers (38% for those born overseas who continued to work) (AIHW analysis of ABS 2020). However, ‘professionals and managers’ refers to a broad group, and people from particular backgrounds – such as those who have migrated more recently, or who come from non-English-speaking countries – may have very different experiences.
Around two-thirds (63%) of overseas-born people aged 65–74 indicated that they were permanently not intending to work (AIHW analysis of ABS 2020).
Income and finances
Many older Australians receive the Age Pension and/or are able to access superannuation (for more information on this, see Income and finance). In addition to supports available through Australia (or instead of these), some people born overseas may also be able to access similar supports from their birth country. No information is available on income source by people’s CALD background.
Cultural and linguistic diversity is a broad concept and this can mask specific issues, such as those relating to socioeconomic disadvantage. For example, the 2016 ABS Personal Safety Survey indicated that nearly 9 in 10 (86%) older people who mainly speak another language at home and speak English well or very well could raise $2,000 within a week in an emergency. Around 7 in 10 (74%) of those who speak English not well or not at all could raise $2,000 within a week in an emergency (AIHW analysis of ABS 2016b).
This was also reflected in the 2016 Census. Where income was reported, overseas-born older Australians were more likely to have a personal weekly income below $500 compared with those born in Australia (61% and 55%, respectively) (AIHW analysis of ABS 2016a).
Where do I go for more information?
For more information on older people from culturally and linguistically diverse backgrounds, see:
ABS (Australian Bureau of Statistics) 2016a. Microdata: Census of Population and Housing, 2016. ABS cat. no. 2037.0.30.001. AIHW analysis using TableBuilder. Canberra: ABS. Viewed 2021.
ABS 2016b. Microdata: Personal safety in Australia, 2016. ABS cat. no. 4906.0.55.001. AIHW analysis using TableBuilder. Canberra: ABS. Viewed 2021.
ABS 2017. Census of Population and Housing: reflecting Australia – stories from the Census, 2016. ABS cat. no. 2071.0. Canberra: ABS. Viewed 2021.
ABS 2019a. Microdata: National Health Survey 2017–18. ABS cat. no. 4324.0.55.001. AIHW analysis using TableBuilder. Canberra: ABS. Viewed 2021.
ABS 2019b. Microdata: Survey of Disability, Ageing and Carers, 2018. ABS cat. no. 4430.0.30.002. AIHW analysis using TableBuilder. Canberra: ABS. Viewed 2021.
ABS 2019c. National Health Survey: users’ guide, 2017–18. ABS cat. no. 4363.0. Canberra: ABS. Viewed 26 August 2021.
ABS 2020. Microdata: Education and Work, Australia. ABS cat. no. 6227.0.30.001. AIHW analysis using TableBuilder. Canberra: ABS. Viewed 2021.
AIHW (Australian Institute of Health and Welfare) 2020. GEN Aged Care Data: People using aged care. Canberra: AIHW. Viewed 2021.
Department of Health 2020. Aged care data snapshot – 2020. Canberra: Department of Health. Viewed 2021.
Department of Health 2021. 2020 Aged Care Workforce Census Report. Canberra: Department of Health. Viewed 2021.
Mavromaras K, Knight G, Isherwood L, Crettenden A, Flavel J, Karmel T et al. 2017. The aged care workforce, 2016. Canberra: Department of Health. Viewed 2021.
NHMRC (National Health and Medical Research Council) 2009. Australian Guidelines to Reduce Health Risks from Drinking Alcohol. Canberra: NHMRC. Viewed 2021.
NHMRC 2013. Australian Dietary Guidelines. Canberra: NHMRC. Viewed 2021.


