Australian Capital Territory
This fact sheet summarises key findings of young people under youth justice supervision for the Australian Capital Territory, including the number and rate of young people under community-based supervision and in detention. It also summarises data on young people by age, sex, Indigenous status, legal status, time under supervision and contains trends.
Impact of COVID-19 on youth justice data
This report includes data from March 2020 to June 2023, which coincides with the presence of COVID-19 in Australia. However, the direct impact of COVID-19 and related social restrictions on the number of young people under youth justice supervision is difficult to determine due to a range of factors and more research is required.
Number and rate
On an average day in 2022–23, in the Australian Capital Territory:
- 58 young people aged 10 and over were under youth justice supervision (Table S138a)
- 69% were supervised in the community (Table S138b), and 32% in detention (Table S138c) (proportions might not sum to 100%, as young people may be under community-based supervision and in detention on the same day)
- the rate of supervision was 11 per 10,000 young people aged 10–17 (Table S139a)
- 8.2 per 10,000 young people aged 10–17 were under community-based supervision, and 3.4 per 10,000 were in detention (tables S139b and S139c).
Age and sex
On an average day in 2022–23, in the Australian Capital Territory:
- 86% of those under supervision were aged 10–17, and the rest were 18 and over
- almost 4 in 5 (78%) of those under supervision were male
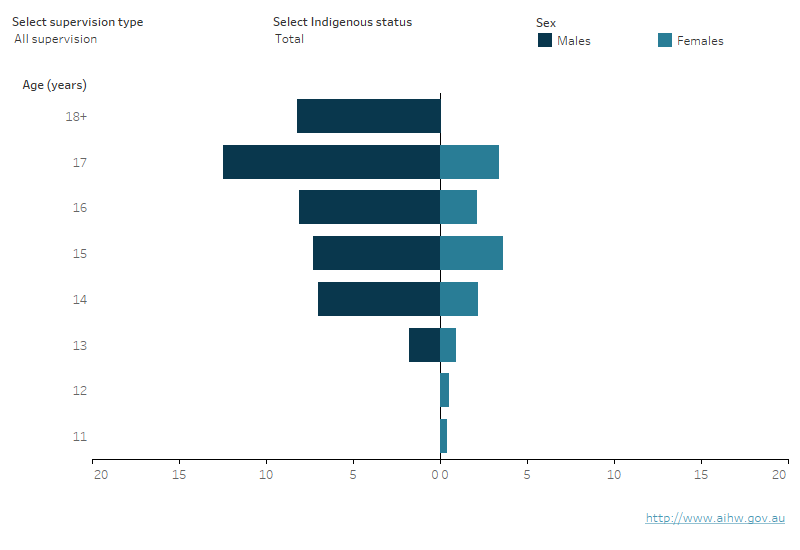
- males under supervision were most likely to be aged 17 and females were most likely to be aged 15 (Table S138a).
Number of young people under supervision (any type) on an average day, by age, sex and Indigenous status, Australian Capital Territory 2022–23
This population pyramid shows the age, sex and Indigenous status under supervision, community-based supervision and detention for the Australian Capital Territory. The age distribution of males and females was different as males under supervision were older on average than females. The largest number of males under supervision were aged 17, while for females they were aged 15. Very few males and females under supervision were aged 13 and under.
Notes:
- Age categories are not presented where they represent averages that are equal to or rounded to 0.0.
- Total includes young people of unknown age, sex and Indigenous status.
- Number of young people under community-based supervision and in detention may not sum to total number under supervision as young people may be under community-based supervision and in detention on the same day and may be in different age groups.
- Age on an average day is calculated based on the age a young person is each day that they are under supervision. If a young person changes age during a period of supervision, then the average daily number under supervision will reflect this. Average daily data broken down by age will not be comparable to Youth justice in Australia releases prior to 2019–20.
- The equivalent 'during the year' table or unique counts of young people is not published due to small numbers, confidentiality, and/or reliability concerns.
Source: Youth Justice National Minimum Data Set 2022–23
First Nations young people
On an average day in 2022–23, in the Australian Capital Territory:
- First Nations young people made up 2.9% of those aged 10–17 in the general population, but 21% (or 11) of those of the same age under supervision (tables S138a and S143)
- a slightly lower proportion of First Nations young people aged 10–17 were under community-based supervision (18% or 6.3) and a slightly higher proportion in detention (30% or 4.4) (tables S138b and S138c)
- First Nations young people aged 10–17 were 9 times as likely as non-Indigenous young people to be under supervision (84 per 10,000 compared with 9.1 per 10,000) (Table S139a).
- First Nations over-representation was slightly lower in community-based supervision (about 7 times the non-Indigenous rate) (Table S139b). First Nations over-representation in detention was higher at 14 times the non-Indigenous rate (Table S139c).
Time under supervision
In 2022–23, in the Australian Capital Territory:
- completed periods of supervision lasted a median length of 20 days (almost 3 weeks) (Table S29)
- when all time spent under supervision during the year is considered, young people spent an average of 136 days (about 19 weeks) under supervision (Table S30).
Sentenced and unsentenced detention
On an average day in 2022–23, in the Australian Capital Territory:
- 15 young people in detention were unsentenced—that is, they were awaiting the outcome of their court matter, or had been found guilty and were awaiting sentencing
- 8.4 young people in detention were serving a sentence (the number of unsentenced and sentenced young people on an average day may not sum to total number of young people in detention as young people may have been in both detention types on the same day) (Table S108a).
Trends to 2022–23
Over the 5 years to 2022–23, on an average day in the Australian Capital Territory:
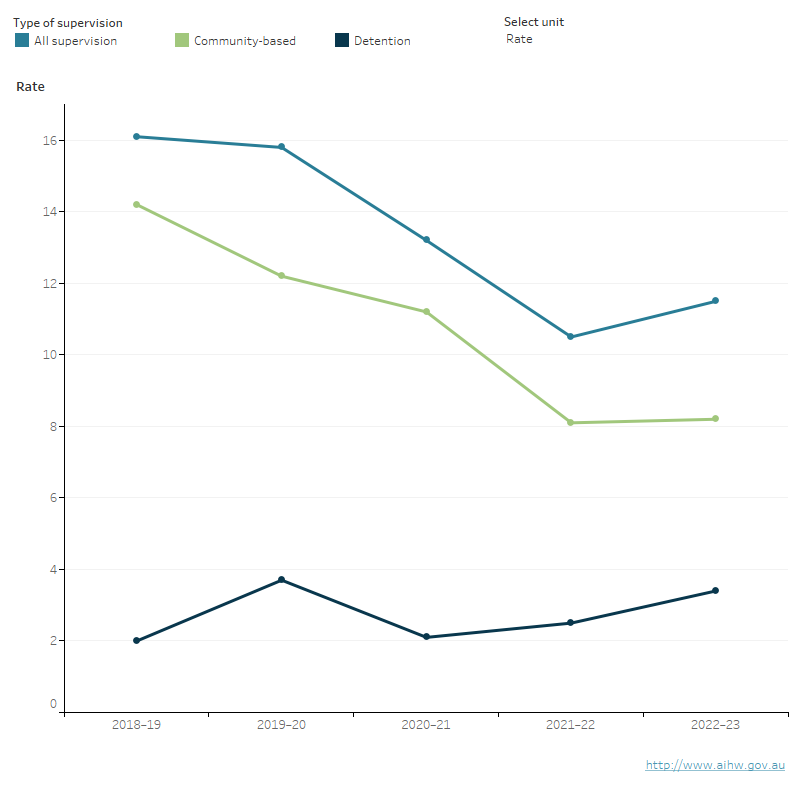
- the number of young people under supervision fell from 78 in 2018–19 to 58 in 2022–23 (Table S138a). The rate fell from 16 to 11 per 10,000 young people aged 10–17 (Table S12a)
- in community-based supervision, the number fell overall by 42% (Table S138b), while the rate fell overall from 14 to 8.2 per 10,000 (Table S45a)
- in detention, the number fluctuated, but rose overall from 10 to 19 young people (Table S138c), while the rate rose from 2.0 to 3.4 per 10,000 (Table S83a).
Rate of young people aged 10–17 under supervision on an average day, by supervision type, Australian Capital Territory, 2018–19 to 2022–23
This line graph shows the number and rate of young people under supervision, community-based supervision and detention over the 5 years from 2018–19 to 2022–23 for the Australian Capital Territory. It shows a decline in the rate under supervision and community-based supervision, with a slight increase in the most recent year, while the rate for detention was fluctuated over the 5-year period, increasing from 2020–21 onwards.
Notes:
- Total includes young people of unknown age, sex and Indigenous status.
- Number of young people under community-based supervision and in detention may not sum to total number under supervision as young people may be under community-based supervision and in detention on the same day and may be in different age groups.
- Age on an average day is calculated based on the age a young person is each day that they are under supervision. If a young person changes age during a period of supervision, then the average daily number under supervision will reflect this. Average daily data broken down by age will not be comparable to Youth justice in Australia releases prior to 2019–20.
- The equivalent 'during the year' table or unique counts of young people is not published due to due to small numbers, confidentiality, and/or reliability concerns.
- Rates are number of young people per 10,000 relevant population.
Source: Youth Justice National Minimum Data Set 2022–23
More information
This fact sheet is part of the Youth justice in Australia 2022–23 release, which includes a report, state and territory fact sheets, and supplementary data tables.
Together, these provide comprehensive information about young people under youth justice supervision in Australia due to their involvement, or alleged involvement, in crime.
For more information see the Youth justice topic.