Time under supervision
Orders and supervision periods
Supervised orders
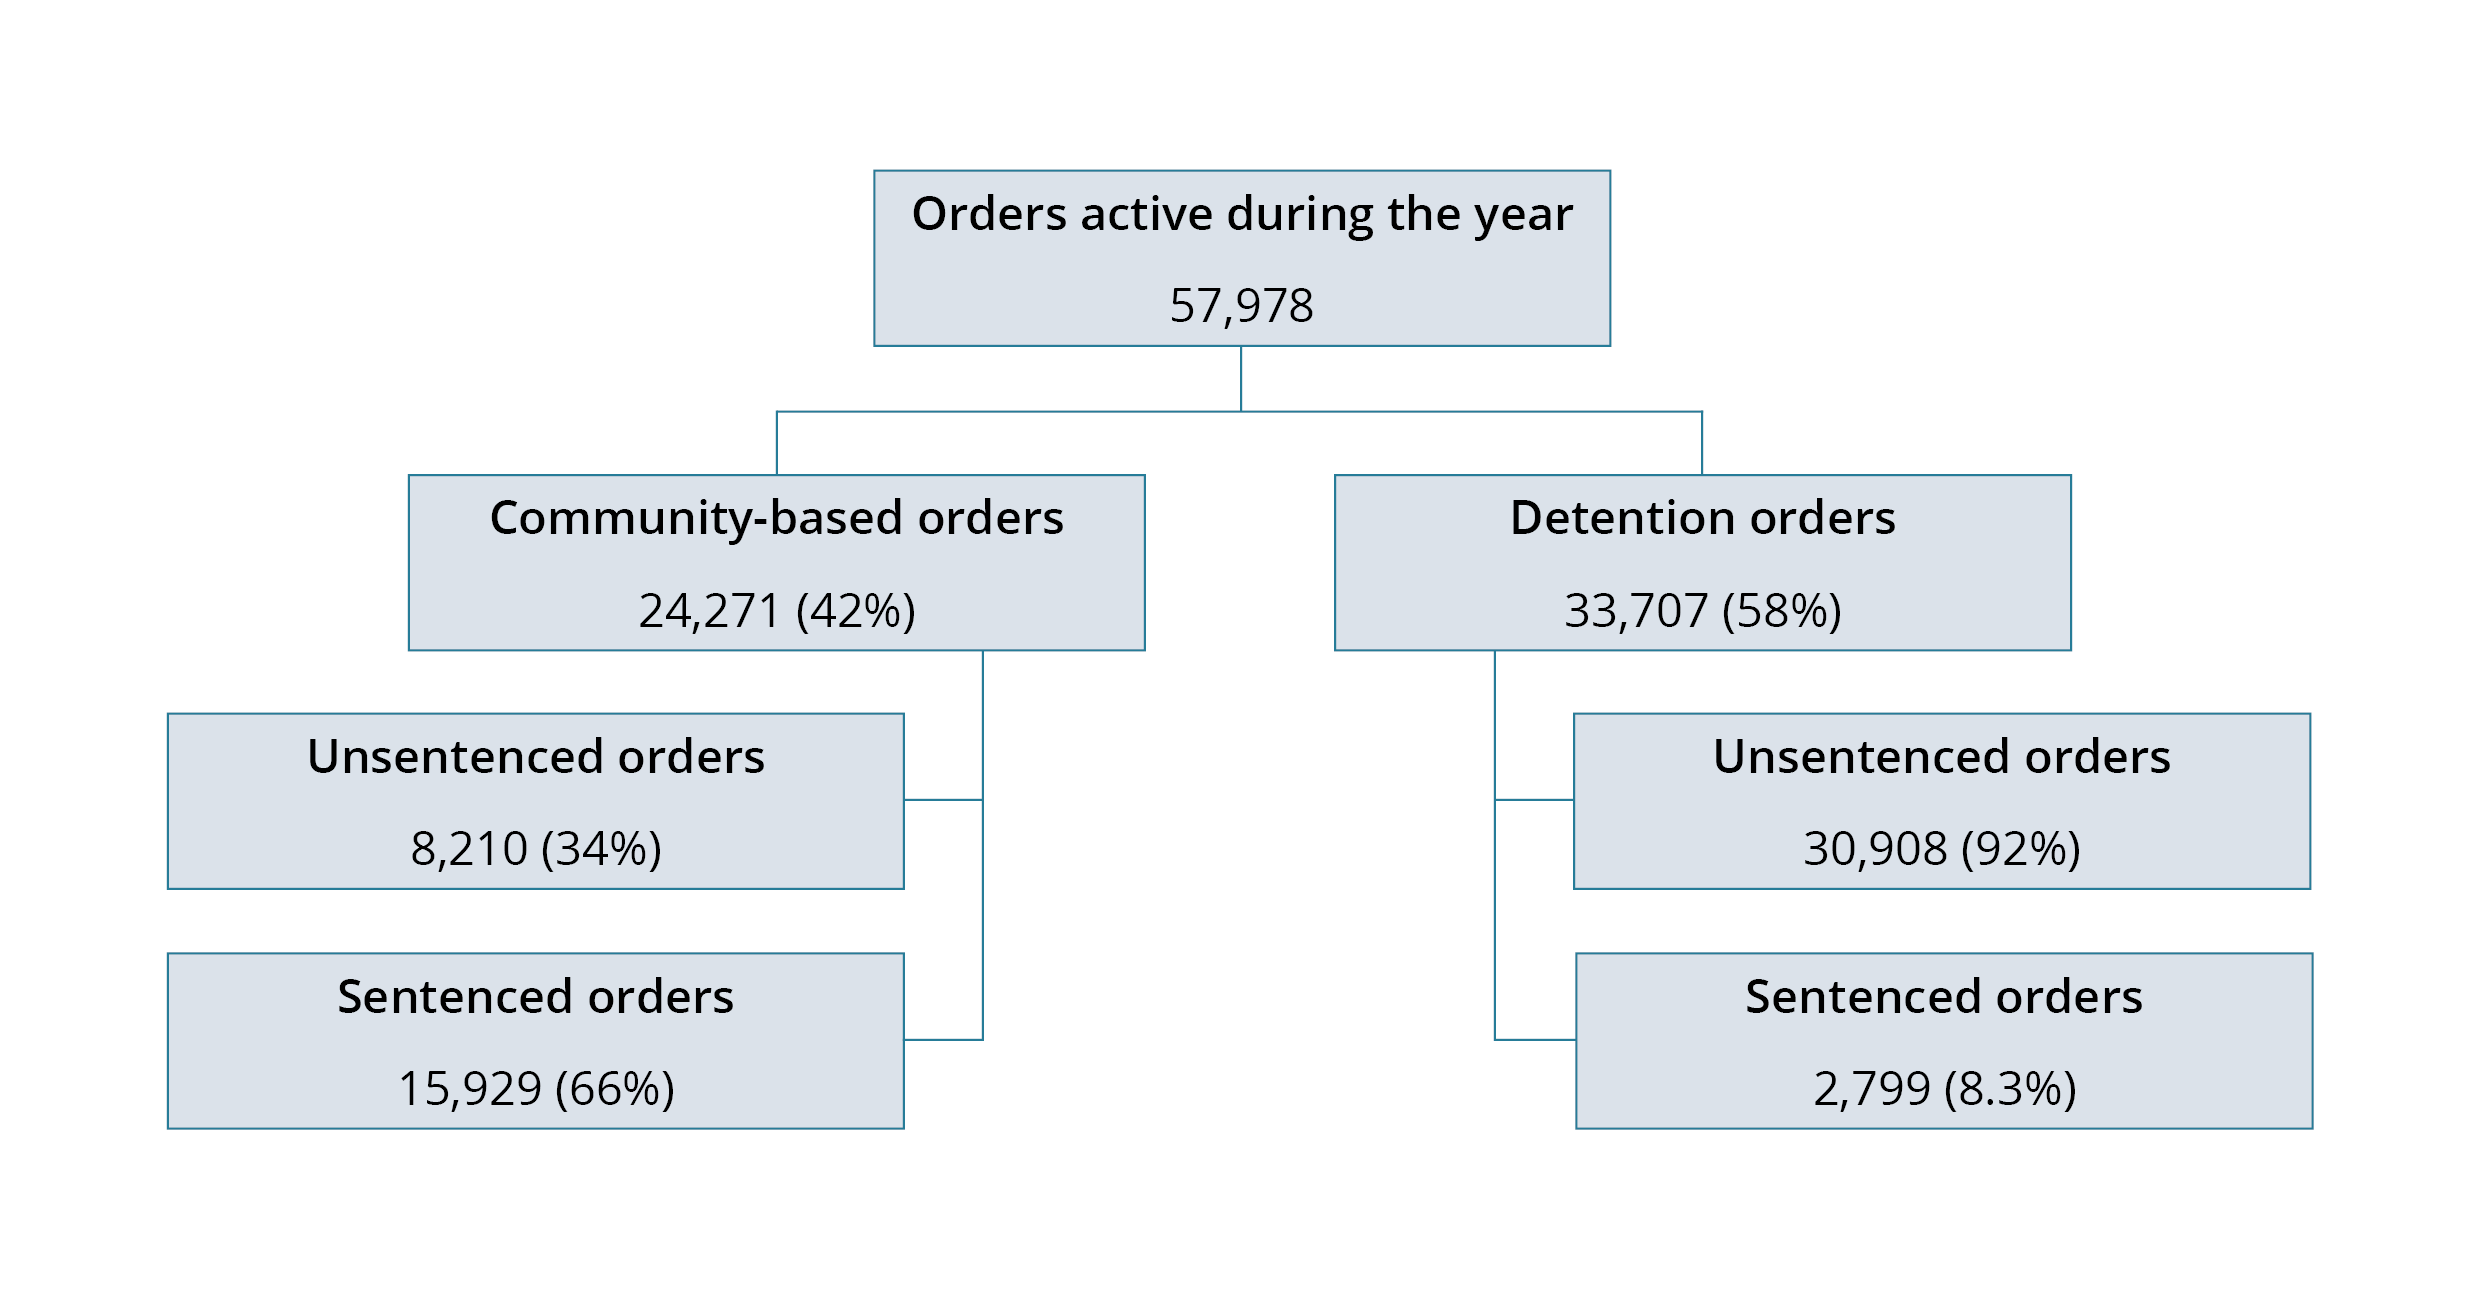
In 2022–23, the 9,157 young people under youth justice supervision were supervised under 57,978 sentenced and unsentenced orders (tables S1b and S25).
Although most (82%) young people were supervised in the community on an average day in 2022–23, detention orders were the most common type of order active in the same year (58%) (Figure 6.1; Table 2.1).
This difference between the most common type of supervision on an average day and the most common type of order during the year reflects differences in the typical durations of each type of order. Sentenced community-based orders typically last longer than unsentenced detention orders and, as a result, young people on community-based supervision orders make up a larger proportion of the average daily count than those on detention orders.
Of all detention orders active during the year, most (92%) were unsentenced, while most community-based orders were sentenced (66%). Orders are active if they start, end or are ongoing during the reference period.
Figure 6.1: Supervised orders, by type of order and legal status, 2022–23
Note: Totals for community-based orders, detention orders and orders active during the year include orders with ‘other’ legal status.
Source: Table S25.
In 2022–23:
- the majority of active orders in New South Wales (67%) and Queensland (57%) were detention orders
- South Australia (54%) and the Australian Capital Territory (52%) had the largest proportions of active orders that were community-based (Table 25).
About two-thirds (68%) of young people under supervision during 2022–23 had multiple supervision orders during the year, with more than one-third (37%) having both community‑based supervision and detention orders (tables S26a, S26b and S26c).
During 2022–23, there were:
- 57,978 active orders for the 9,157 young people under supervision, an average of 6.3 orders per young person
- 24,271 community orders for the 7,934 young people under community-based supervision, an average of 3.1 community orders per young person
- 33,707 detention orders for the 4,605 young people in detention, an average of 7.3 detention orders per young person (tables 2.1 and S25).
Of those under supervision, First nations young people were more likely to have multiple supervision orders (74%) than their non-Indigenous counterparts (63%) (Table S26c).
Young people under community-based supervision were more likely than those in detention to have had only 1 order (42% compared with 20%). About 2 in 5 (39%) young people in detention had 6 or more detention orders within the year, and 1 in 7 (14%) young people under community-based supervision had 6 or more community-based orders (tables S26a and S26b).
Periods of supervision
In this report, a period of supervision refers to an amount of time spent under continuous supervision of any type. A period of supervision may be made up of 1 or more community and/or detention orders. A period of community-based supervision or detention may be made up of 1 or more orders of that specified type.
Young people may be on any number and type of orders at any time, but they might not serve the originally specified duration of these orders for several reasons. For example, a community order might not be served entirely in the community when there is a concurrent detention order; in which case, the young person may be supervised in detention.
The original duration of a sentenced detention order might also not be served in a detention facility – for example, where the young person is released on parole or supervised release. This report looks at the actual time spent under each type of supervision.
In 2022–23, the 9,157 young people under supervision received 12,421 periods of supervision (continuous supervision of any type), an average of about 1.4 periods per person (tables 2.1 and S27).
Among the 5,795 young people who completed a period of supervision in 2022–23, most (81%) completed only one period (Table S28).
About 7 in 10 (71%, or 5,663 of 7,934) young people who were under community-based supervision during the year completed at least one period of community-based supervision (tables S34b and S61). Of the young people who completed a period of community-based supervision in 2022–23, about 7 in 10 (71%) young people completed only one period of community-based supervision (Table S61).
More than 9 in 10 (96%, or 4,420 of 4,605) young people who were in detention during the year completed at least one period of detention, and 45% (or 2,092 of 4,605) completed at least 2 periods of detention. Of those young people who completed a period of detention, more than half (53%) completed only one period of detention (Table S100). Of young people in detention, about 1 in 7 (14%) completed at least one period of sentenced detention and most (94%) completed a period of unsentenced detention (Table 6.1).
Type of supervision | Completed only one period (%)(a) | Completed at least one period (%)(b)(c) |
|---|---|---|
All supervision | 81 | 63 |
Community | 71 | 71 |
Detention | 53 | 96 |
– Sentenced | 76 | 14 |
– Unsentenced | 52 | 94 |
- Denominator is all young people who completed a period of youth justice supervision of that type.
- Denominator is all young people in that supervision type.
- For young people in sentenced and unsentenced detention, the denominator is all young people in detention.
Sources: tables S1b, S28, S34b, S61, S72b, S100, S115 and S121.
Young people who completed a period of unsentenced detention during the year completed 2.1 periods of unsentenced detention on average. Those who completed a period of sentenced detention, completed 1.4 periods of sentenced detention on average (tables S116 and S122).
First Nations young people (23%) were more likely than non-Indigenous young people (15%) to have completed multiple periods of supervision (Table S28). This was the case for completed periods in both community-based supervision and detention (tables S61 and S100).
Length of supervision periods
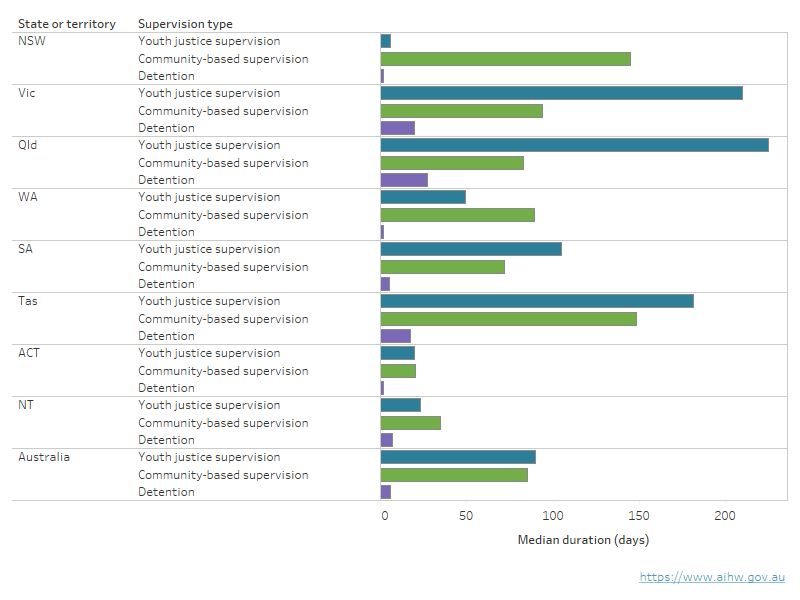
Individual periods of supervision completed during 2022–23 lasted for a median length of 90 days, or about 13 weeks (this includes time under supervision before 1 July 2022 if the period started before that date).
The median duration of completed periods varied substantially between states and territories, ranging from 6 days in New South Wales to 225 days in Queensland (periods include days before 1 July 2022) (Figure 6.2).
Completed periods of community-based supervision were much longer than completed periods of detention, with a median length of 85 days (about 12 weeks) compared with 6 days, respectively (tables S62 and S101).
Again, there were differences among the states and territories. In 2022–23, the median length of completed periods of:
- community-based supervision ranged from 20 days in the Australian Capital Territory to 148 days in Tasmania
- detention ranged from 2 days in New South Wales, Western Australia and the Australian Capital Territory to 27 days in Queensland (Figure 6.2).
Figure 6.2: Median duration of completed supervision periods, by supervision type and State or territory, 2022–23
This horizontal bar chart shows the median duration of completed supervision periods by supervision type (all supervision; community; detention). The national median for all supervision was 90 days, which ranged from 6 days in New South Wales to 225 days in Queensland.
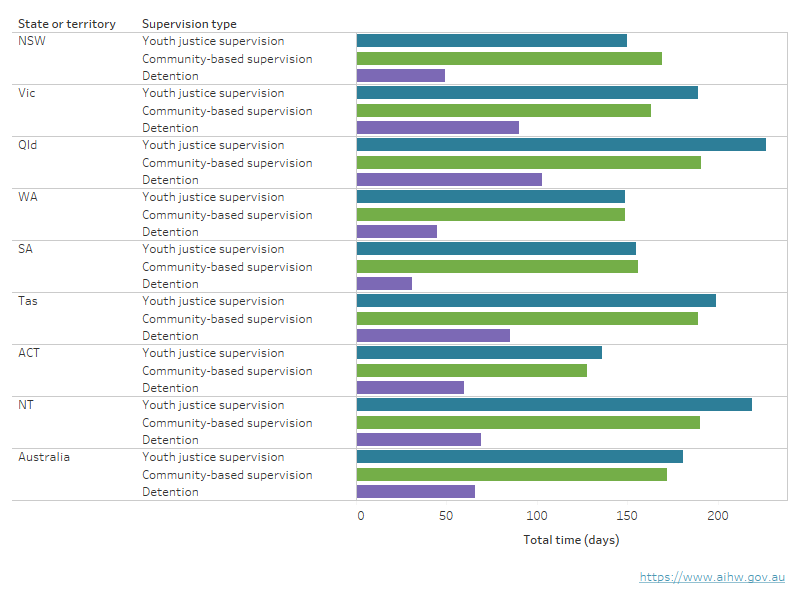
This vertical bar chart shows the average total time under supervision during the year by supervision type (all supervision; community; detention). Across all states and territories, young people spent more time under community-based supervision than in detention (172 days and 66 days nationally).
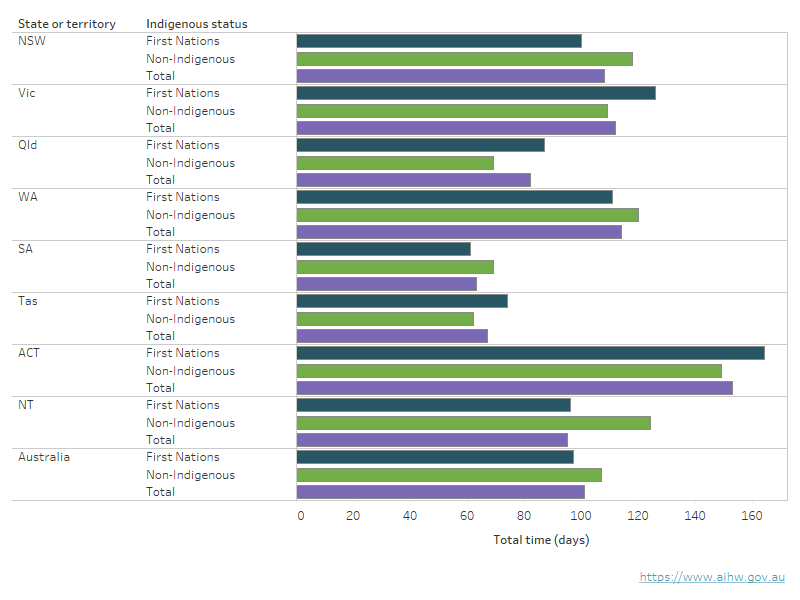
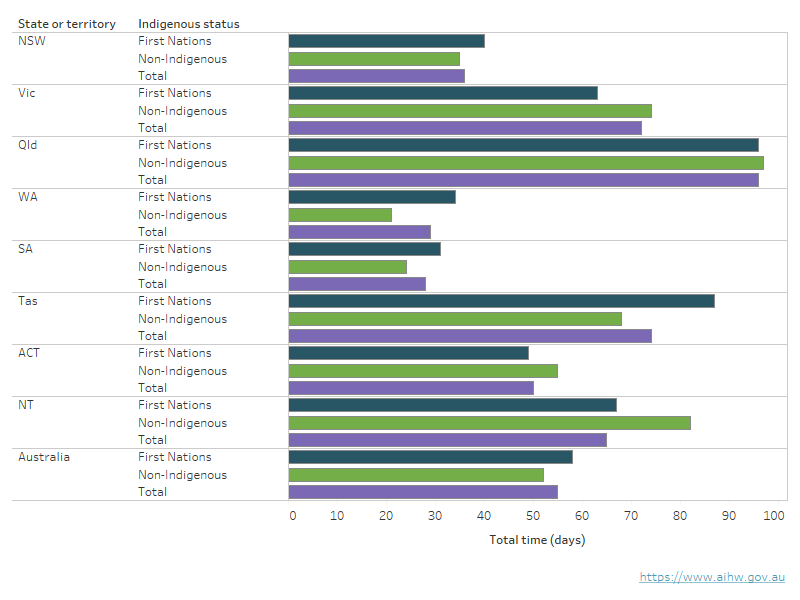
This horizontal bar chart shows the average total time (days) spent in unsentenced detention during the year by Indigenous status. In all states and territories, except Victoria, the Australian Capital Territory and the Northern Territory, First Nations young people spent more total time (days) in unsentenced detention than non-Indigenous young people.
This horizontal bar chart shows the average total time (days) spent in sentenced detention during the year by Indigenous status. In Victoria, Queensland, the Australian Capital Territory and Tasmania, First Nations young people spent more total time (days) in sentenced detention than non-Indigenous young people.