Trends in supervision
Recent trends
National
The number of young people aged 10 and over who were under supervision (including those aged 18 and over) on an average day fell overall between 2018–19 and 2022–23 (Table S11a).
Overall, over the 5 years from 2018–19 to 2022–23, the number of young people under supervision fell by 20% (from 5,693 to 4,542) (Table S11a). The total number of individual young people who were supervised was fell over the 5 years in most states and territories except South Australia and the Northern Territory where the number rose.
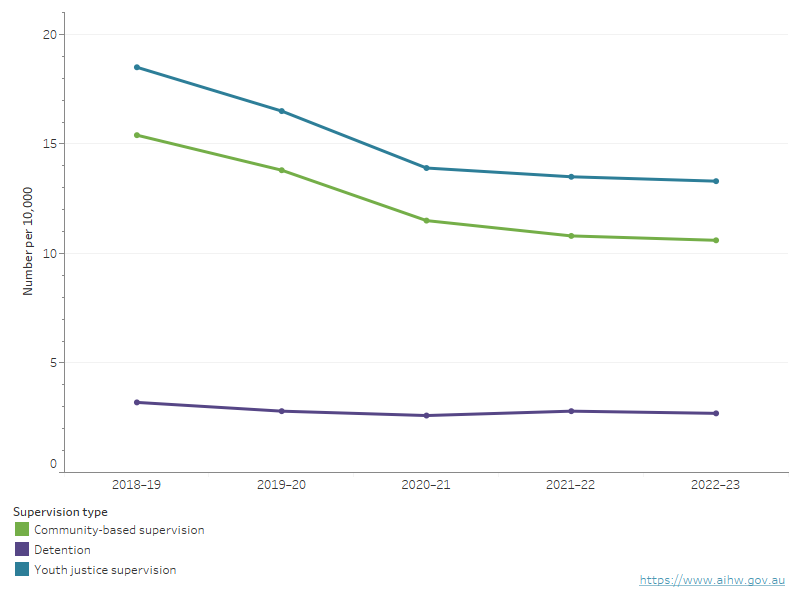
Overall, the national rate of young people aged 10–17 under youth justice supervision on an average day fell from 18 to 13 per 10,000 young people over the 5-year period to 2022–23 (Figure 8.1).
Compared with the previous year, the number of young people aged 10 and over who were under supervision fell by 1.4% (from 4,608 to 4,542) and the rate of young people aged 10–17 remained stable at 13 per 10,000.
Between 2018–19 and 2022–23, the total number of young people aged 10 and over who were under supervision during the year fell by 16% (from 10,841 to 9,157) (Table S11b). The average total time young people spent under supervision during the year declined over the 5‑year period, from 192 days in 2018–19 to 181 days in 2022–23 (Table S30).
The decrease in the number of young people under supervision is partly due to a fall in the numbers of young people who have been the subject of legal action by police and who had charges finalised in the children’s courts in recent years. COVID-19 restrictions, beginning in March 2020, also led to temporary closures of courts and the deferral of cases, which may have had an impact.
Between 2018–19 and 2022–23, the number of young people aged 10–17 who had their matters finalised in court fell by 11%, with an increase of 8.7% from a low in 2020–21 (ABS 2024).
Figure 8.1: Trends in young people aged 10–17 under supervision on an average day, by supervision type, 2018–19 to 2022–23
This line graph shows that the rate of community-based supervision was higher than detention over the 5-year period to 2022–23. Overall, all supervision, community-based supervision and detention rates fell from 2018–19 to 2022–23.
Notes
- Trend data might differ from data previously published due to data revisions.
- Age on an average day is calculated based on the age a young person is each day that they are under supervision. If the age of a young person changes during a period of supervision, the average daily number under supervision will reflect this. Average daily data broken down by age will not be comparable with data in Youth justice in Australia releases before 2019–20.
Sources: tables S12a, S45a and S83a
Between 2018–19 and 2022–23, the number of young people aged 10 and over under community-based supervision on an average day fell by 22% (from 4,770 to 3,743) (Table S44a). The rate dropped from 15 to 11 per 10,000 for those aged 10–17 (Figure 8.1). In the most recent year, the number under community-based supervision fell by 1.7% (from 3,809 to 3,743) and the rate remained stable at 11 per 10,000.
Between 2018–19 and 2022–23, the number of young people aged 10 and over in detention on an average day fell by 13% (from 952 to 828) (Table S82a). The rate declined from 3.2 to 2.7 per 10,000 for those aged 10–17 between 2018–19 and 2022–23 (Figure 8.1). In the most recent year, the number of young people remained stable (from 827 to 828) as did the rate (from 2.8 to 2.7 per 10,000).
States and territories
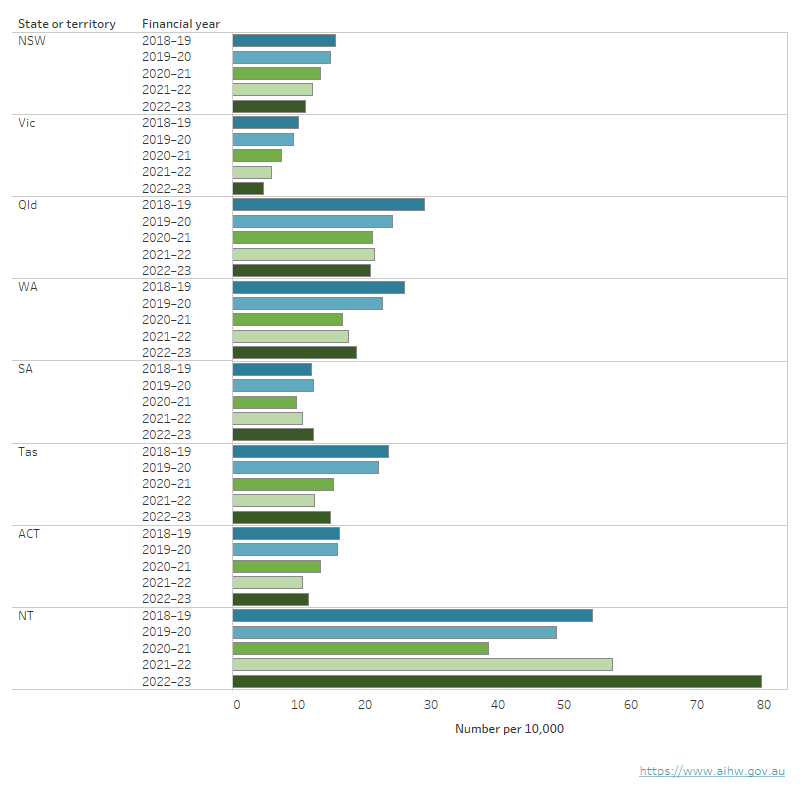
Between 2018–19 and 2022–23, the rate of young people aged 10–17 under supervision on an average day fell overall in most states and territories, except for South Australia and the Northern Territory. The largest fall was in Tasmania (from 23 to 15 per 10,000) (Figure 8.2).
The rates of young people aged 10–17 under community-based supervision on an average day fell overall in most states and territories, again except for South Australia and the Northern Territory. The largest fall was in Tasmania (from 21 to 12 per 10,000) (Table S45a).
The rates of young people aged 10–17 in detention fell or remained steady over the 5-year period from 2018–19 to 2022–23 in most states and territories, with a drop in Western Australia (from 4.8 to 3.0 per 10,000). The rates of young people aged 10–17 in detention increased in the Australian Capital Territory (from 2.0 to 3.4 per 10,000) and the Northern Territory (from 14 to 19 per 10,000) (Table S83a).
Figure 8.2: Trends in young people aged 10–17 under supervision on an average day, by State or territory, 2018–19 to 2022–23
This vertical bar chart shows that the rate of young people aged 10–17 under supervision on an average day has declined overall over the 5 year period to 2022–23 in most states and territories except for South Australia and the Northern Territory.
Notes
- Trend data might differ from data previously published due to data revisions.
- Age on an average day is calculated based on the age a young person is each day that they are under supervision. If the age of a young person changes during a period of supervision, the average daily number under supervision will reflect this. Average daily data broken down by age will not be comparable with data in Youth justice in Australia releases before 2019–20.
- In Queensland, legislation to increase the age limit in the youth justice system from 16 to 17 was enacted in February 2018. This change resulted in an increase in the number and rate of young people aged 17 under youth justice supervision from 2017–18 onwards.
Source: Table S12a.
Indigenous status | NSW | Vic | Qld | WA | SA | Tas | ACT | NT | Australia |
|---|---|---|---|---|---|---|---|---|---|
| Community | |||||||||
First Nations | ↓ | ↓ | ↓ | ↓ | ↑ | ↓ | ↓ | ↑ | ↓ |
Non-Indigenous | ↓ | ↓ | ↓ | ↓ | ↑ | ↓ | ↓ | ↔ | ↓ |
Total | ↓ | ↓ | ↓ | ↓ | ↑ | ↓ | ↓ | ↑ | ↓ |
| Detention | |||||||||
First Nations | ↓ | ↓ | ↑ | ↓ | ↓ | ↓ | ↑ | ↑ | ↓ |
Non-Indigenous | ↓ | ↓ | ↔ | ↔ | ↓ | ↑ | ↑ | ↑ | ↔ |
Total | ↓ | ↓ | ↔ | ↓ | ↓ | ↑ | ↑ | ↑ | ↓ |
| All supervision | |||||||||
First Nations | ↓ | ↓ | ↓ | ↓ | ↓ | ↓ | ↓ | ↑ | ↓ |
Non-Indigenous | ↓ | ↓ | ↓ | ↓ | ↔ | ↓ | ↓ | ↑ | ↓ |
Total | ↓ | ↓ | ↓ | ↓ | ↔ | ↓ | ↓ | ↑ | ↓ |
Notes
- Arrows indicate an overall change between 2018–19 and 2022–23. Trends might have fluctuated between these years, particularly for smaller jurisdictions.
- Data might differ from data previously published due to data revisions.
- Age on an average day is calculated based on the age a young person is each day that they are under supervision. If the age of a young person changes during a period of supervision, the average daily number under supervision will reflect this. Average daily data broken down by age will not be comparable with data in Youth justice in Australia releases before 2019–20.
Sources: tables S12a, S45a and S83a.
Age and sex
Over the 5 years to 2022–23, the rates of young males and females under supervision fell. For males aged 10–17 on an average day, the rate fell from 28 to 20 per 10,000; for females, it fell overall from 8.1 to 5.6 per 10,000 (Table S15a). On an average day each year, males aged 10–17 were 3–4 times as likely as females aged 10–17 to be under supervision.
The rate of young males aged 10–17 under community-based supervision on an average day also fell over the same 5-year period, from 23 to 16 per 10,000, while the rate of young females fell from 7.4 to 5.1 per 10,000 (Table S48a). For detention, the rate of males aged 10–17 on an average day fell from 5.5 to 4.7 per 10,000, while the rate of females was down slightly overall from 0.7 to 0.6 per 10,000 (Table S86a).
On an average day each year, young males aged 10–17 were about 3 times as likely as young females aged 10–17 to be under community-based supervision, and 7–8 times as likely to be in detention (tables S48a and S86a).
The fall in rates of young males under supervision on an average day occurred for most ages, with the largest fall being for those aged 16 (from 67 to 47 per 10,000 over the 5-year period) (Table S9a).
Among young females, rates fell overall for most ages, with the largest fall being for those aged 16 (from 21 to 12 per 10,000) (Table S9a).
First Nations young people
On an average day over the 5-year period between 2018–19 and 2022–23 under youth justice supervision, the:
- number of First Nations young people (including those aged 18 and over) declined overall by 11% from 2,734 to 2,423 – and the number of non-Indigenous young people aged 10 and over fell by 29% – from 2,894 to 2,047 (Table S11a)
- rate of First Nations young people aged 10–17 fell from 161 to 132 per 10,000. In the most recent year, the rate rose from 124 to 132 per 10,000
- rate of non-Indigenous young people fell slightly from 9.3 to 5.8 per 10,000
- level of First nations over-representation rose. In 2018–19, First Nations young people aged 10–17 were 17 times as likely as their non-Indigenous counterparts to be under supervision, rising to about 23 times as likely in 2022–23 (Table S12a).
On an average day over the same 5-year period under community-based supervision, the:
- number of First Nations young people aged 10 and over fell by 12% – from 2,231 to 1,958 – and the number of non-Indigenous young people aged 10 and over fell by 31% – from 2,477 to 1,716 (Table S44a)
- rate of First Nations young people aged 10–17 fell from 130 to 103 per 10,000 and the rate of non-Indigenous young people fell from 8.0 to 4.8 per 10,000
- level of First nations over-representation increased. In 2018–19, the rate ratio was 16 and increased to 22 in 2022–23 (Table S45a).
On an average day over the same 5-year period in detention, the:
- number of First Nations young people aged 10 and over declined by 7.0% (from 519 to 483) and the number of non-Indigenous young people fell by 20% (from 429 to 342) (Table S82a)
- rate of First Nations young people aged 10–17 declined from 32 to 30 per 10,000 and the non-Indigenous rate declined from 1.4 to 1.1 per 10,000
- First Nations rate ratio for those in detention rose overall from 23 to 28 per 10,000 (Table S83a).
On an average day over the same 5-year period, when comparing states and territories:
- the rates of First Nations young people under supervision fell in all states and territories except for the Northern Territory (Table 8.1)
- the largest falls in First Nations rates were in Victoria (102 to 41 per 10,000), Queensland (229 to 178 per 10,000) and Western Australia (240 to 189 per 10,000)
- the rates for non-Indigenous young people fell slightly in most states and territories, except for South Australia and the Northern Territory. Tasmania (16 to 11 per 10,000) and Victoria (8.3 to 4.1 per 10,000) had the largest falls over the 5-year period (Table S12a)
- the rates for First Nations young people aged 10–17 under community-based supervision fell in most states and territories (except for South Australia and the Northern Territory), with the Australian Capital Territory showing the largest decline (114 to 49 per 10,000) (Table S45a)
- the rate of First Nations young people aged 10–17 in detention for most states and territories fell, with South Australia (from 28 to 19 per 10,000) and Western Australia (from 55 to 35 per 10,000) experiencing the largest declines. Rates increased in Queensland (41 to 46 per 10,000), the Australian Capital Territory (15 to 35 per 10,000) and the Northern Territory (31 to 43 per 10,000) (see Table 8.1).
Time under supervision
Over the 5 years from 2018–19 to 2022–23, the average amount of time young people spent under youth justice supervision during the year declined from 192 days in 2018–19 to 181 days in 2022–23 (Table S30).
A similar trend was seen for young people under community‑based supervision, with a decline from 178 days in 2018–19 to 172 days in 2022–23 (Table S63).
The average amount of time spent in detention declined overall, from 71 to 66 days (Table S102).
The average amount of time young people spent under youth justice supervision varied among the states and territories, with the largest overall rise in the Northern Territory (from 195 to 219). The largest overall fall was in New South Wales (from 177 to 150 days) (Table S30).
Longer trends
National
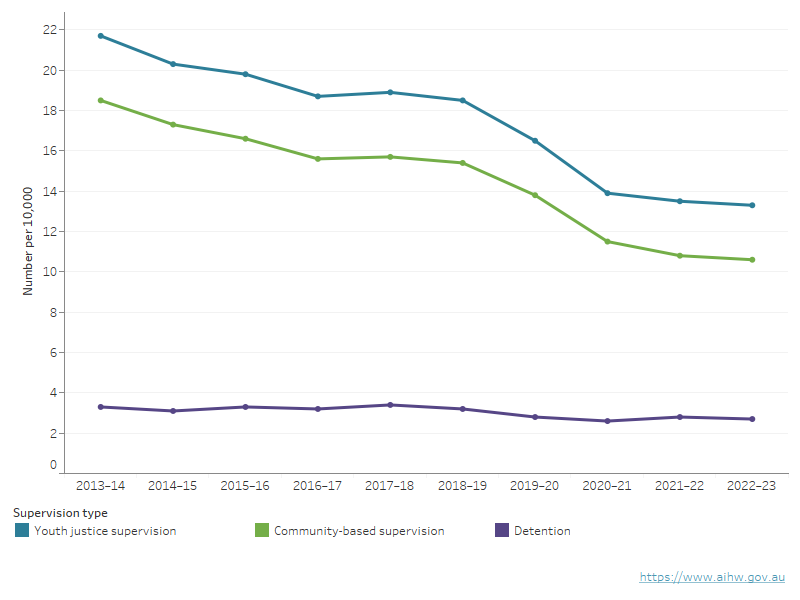
Nationally, the rate of young people aged 10–17 under youth justice supervision on an average day fell over the 10 years to 2022–23, from 22 per 10,000 in 2013–14 to 13 per 10,000 in 2022–23 (Figure 8.3).
Similarly, the rate of young people under supervision during each year (rather than on an average day) fell steadily from 47 per 10,000 in 2013–14 to 29 per 10,000 in 2022–23 (Table S12b).
This trend is largely associated with changes in the rate of community-based supervision, as 82% of all young people under supervision on an average day were supervised in the community (Table 2.1). The rate of community-based supervision peaked at 19 per 10,000 young people aged 10–17 on an average day in 2013–14, before falling to 11 per 10,000 in 2022–23 (Figure 8.3).
The rate of young people in detention was slightly lower in 2022–23 than in 2013–14 (2.7 per 10,000 compared with 3.3 per 10,000).
Figure 8.3: Trends in young people under supervision on an average day, by supervision type, 2013–14 to 2022–23
The line graph of the 10-year period shows that all supervision and community-based supervision rates peaked in 2013–14, before falling to a low in 2022–23. The rate of young people in detention was slightly lower in 2022–23 compared with 2013–14 (2.7 per 10,000 compared with 3.3 per 10,000).
Sources: tables S12a, S45a and S83a.
Between 2013–14 and 2022–23, the drop in the rate of young people under supervision on an average day was proportionally greater for non-Indigenous young people than for First Nations young people. This means that the level of First Nations over-representation rose (from 16 to 23 times the non‑Indigenous rate) (Table S12a).
The rate ratio of males to females under supervision remained relatively stable over the 10-year period. In 2013–14, young males aged 10–17 were 3.9 times as likely as young females to be under youth justice supervision on an average day. The rate ratio was 3.6 in 2022–23 (Table S15a).
Rates of both males and females under supervision were highest in 2013–14 (34 and 8.7 per 10,000, respectively). For males, rates dropped steadily to 20 per 10,000 in 2022–23. Female rates fluctuated, with an overall decline from 8.7 in 2013–14 to 5.6 in 2022–23 (Table S15a).
States and territories
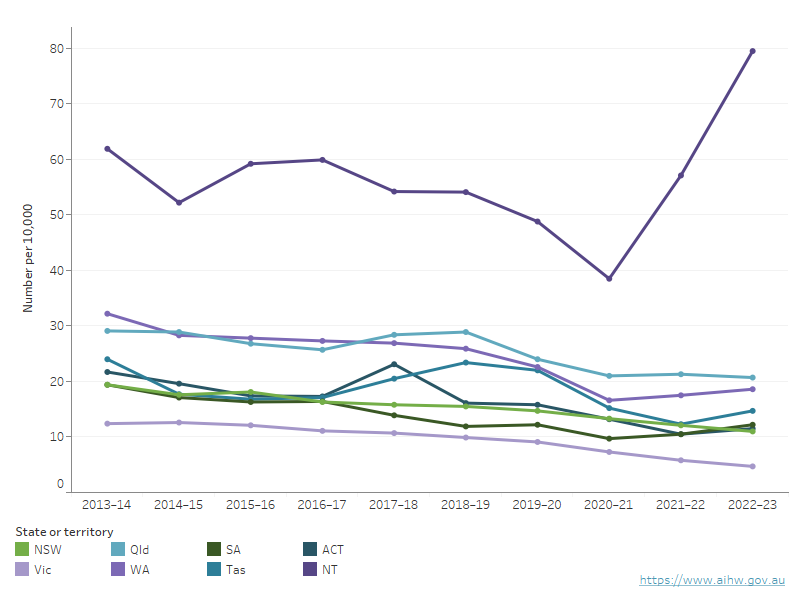
On an average day from 2013–14 to 2022–23, Victoria had the lowest rate of supervision each year, at fewer than 13 per 10,000 young people throughout the period (Figure 8.4).
The rate of young people under supervision on an average day declined gradually over the 10 years in most states and territories, with some showing an increase in the most recent year (2021–22 to 2022–23).
In the Northern Territory, the rate of supervision was 62 per 10,000 in 2013–14 before falling to its lowest point in 2020–21 then increasing substantially in 2022–23. In Tasmania, the rate fluctuated with a low in 2021–22 and a high in 2013–14. Rates in Queensland fluctuated over the 10-year period and were lowest in 2022–23. In the Australian Capital Territory, except for 2017–18, rates fell almost consistently from 2013–14 to 2021–22 with a slight rise in
2022–23.
Figure 8.4: Trends in young people aged 10–17 under supervision on an average day, by State or territory, 2013–14 to 2022–23
This line graph shows the rates of supervision types over the previous ten years by jurisdiction. Over the previous ten years, the rate of young people under supervision on an average day declined gradually over the 10 years in most states and territories, with some showing an increase.
Notes
- Age on an average day is calculated based on the age a young person is each day that they are under supervision. If the age of a young person changes during a period of supervision, the average daily number under supervision will reflect this. Average daily data broken down by age will not be comparable with data in Youth justice in Australia releases before 2019–20.
- In Queensland, legislation to increase the age limit in the youth justice system from 16 to 17 was enacted in February 2018. This change resulted in an increase in the number and rate of young people aged 17 under youth justice supervision from 2017–18 onwards.
Source: Table S12a.
Trends in the rate of young people aged 10–17 under community-based supervision on an average day followed similar patterns to those for all supervision in most states and territories.
Over the 10-year period from 2013–14 to 2022–23, the rate of young people aged 10–17 under community-based supervision on an average day declined overall in all states and territories except the Northern Territory, which fluctuated with an increase in 2022–23. There were some minor fluctuations in some states and territories, where rates:
- rose in Queensland in 2017–18 and 2018–19, before declining again from 2019–20 onwards
- rose in Tasmania in 2017–18 and 2018–19, before falling again to a low in 2021–22 with a slight rise in 2022–23
- rose in the Australian Capital Territory in 2017–18, before continuing to decline to a low in 2021–22 with a slight rise in 2022–23 (Table S45a).
Trends in the rate of young people aged 10–17 in detention on an average day varied among the states and territories over the 10 years.
Between 2013–14 and 2022–23, detention rates fell overall in New South Wales, Western Australia and South Australia; they rose slightly in Queensland, Tasmania, the Australian Capital Territory and the Northern Territory (Table S86a).
The level of First Nations over-representation under youth justice supervision (as measured by the rate ratio) on an average day increased overall in New South Wales, Queensland, South Australia, Tasmania and the Northern Territory over the decade to 2022–23, and declined slightly in Victoria, Western Australia and the Australian Capital Territory (Table S12a). Results for the smaller states and territories should be interpreted with caution due to the small number of First Nations and non-Indigenous young people under youth justice supervision.
The rate of First Nations young people aged 10–17 under supervision fell overall in most states and territories over the 10-year period from 2013–14 to 2022–23, except for Tasmania and the Northern Territory where rates fluctuated over the period. The largest fall was seen in Western Australia where the rate of First Nations young people under supervision fell from 332 to 189 per 10,000.
Australian Bureau of Statistics (ABS) (2024) Criminal courts, Australia 2022–23, ABS, Australian Government.