



Key findings
This report includes the following set of key findings, drawn from the Australia’s health topic summaries and other key sources. They provide the latest information across a broad range of health topics. Download the Australia’s health 2026 report for the complete set.
Australia's population
- Almost 28 million people were living in Australia at 30 June 2025.
- In 2024, Australia’s total fertility rate was 1.5 babies per woman, remaining below the replacement level of 2.1 since 1976.
- Overseas migration has been the main driver of population growth in Australia over the last 30 years.
- The projected population by 2035–36 is 31.5 million and 41 million by 2065–66.
-
Australia’s population is culturally diverse, highly urbanised and has an older age profile
- 1 in 26 (3.8%) identify as being of Aboriginal and/or Torres Strait Islander origin (First Nations people)
- 1 in 3 are born overseas
- 3 in 4 live in Major cities
- 1 in 5 have some form of disability
- 1 in 6 are aged 65 or over
- 1 in 8 provide unpaid care for someone else.
-
The proportion of older people is expected to continue to increase
- The proportion of people aged 65 and over increased from 8.9% in 1975–76 to 18% in 2024–25 and is projected to be 24% in 2065–66.
- Median age (years) increased from 28.4 in 1975–76 to 38.4 in 2024–25 and is projected to be 43.7 in 2065–66.
- The population aged 85 and over is projected to grow more rapidly over the next 40 years than the broader population aged 65 and over:
- aged 65 and over: projected to double from 4.8 million in 2024–25 to 9.7 million in 2065–66
- aged 85 and over: projected to triple from 603,000 in 2024–25 to 1.9 million in 2065–66.
How healthy are Australians?
-
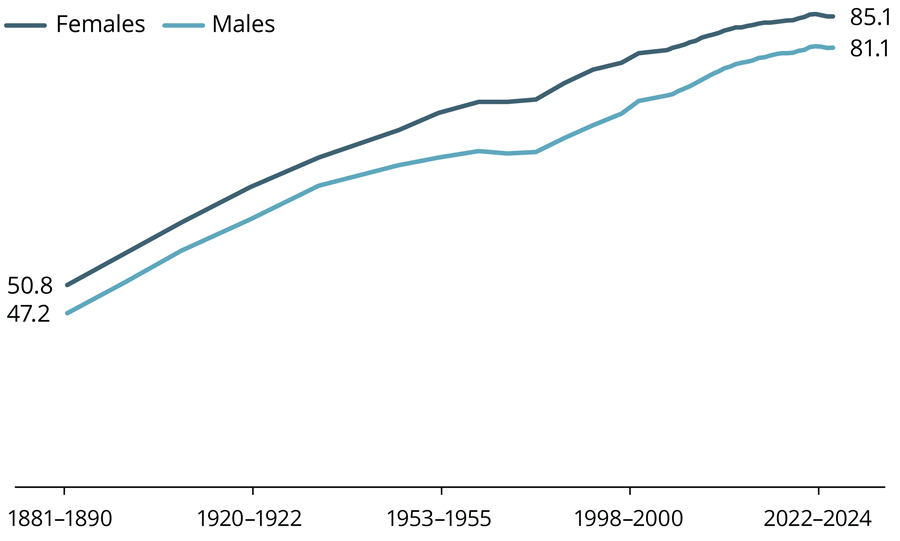
Life expectancy at birth has improved over time, with females continuing to have a higher life expectancy
- Life expectancy at birth in 2022–2024 was 81.1 years for males and 85.1 years for females.
- Life expectancy has risen dramatically since the late 19th century, with a recent decrease seen across the years impacted by the COVID-19 pandemic.
Life expectancy at birth in Australia for males and females, 1881–1890 to 2022–2024
-
Chronic and ageing-related conditions are driving deaths and disease burden
- Dementia is now the leading cause of death in Australia; previously coronary heart disease. Over the last decade the number of deaths caused by:
- dementia has risen by 39% (from 12,641 deaths in 2015 to 17,550 deaths in 2024)
- coronary heart disease has decreased by 18% (from 19,926 deaths in 2015 to 16,326 deaths in 2024).
- In 2024, dementia accounted for almost 1 in 10 deaths. This reflects the sharp increase in dementia risk with age, as more Australians are now reaching ages where dementia is more common.
- In 2022:
- 3 in 5 Australians were living with at least one chronic condition
- 2 in 5 Australians were living with 2 or more chronic conditions.
- In 2024, the top 5 disease groups causing the most disease burden were:
- Cancer (16%)
- Mental health conditions & substance use disorders (15%)
- Musculoskeletal conditions (13%)
- Cardiovascular diseases (12%)
- Neurological conditions (8.4%).
Burden of disease measures the combined impact of illness and premature death (total or disease burden), by adding years lived in ill health (non-fatal burden) with years lost due to premature death (fatal burden).
-
Around one-third of Australia’s disease burden could be prevented or reduced by modifying risk and environmental factors
- Overweight (including obesity) has overtaken tobacco use as the leading risk factor contributing to disease burden in Australia.
- In 2022–24:
- 67% of adults were living with overweight or obesity (13.2 million)
- 27% of children and adolescents were living with overweight or obesity (1.4 million).
- Among Australians aged 14 and over, self-reported daily tobacco smoking has declined (11% to 8.3% from 2019 to 2022–2023). However, daily e-cigarette use has increased (1.1% to 3.5% from 2019 to 2022–2023).
- Tobacco smoking is highest among people aged 50–59 (12%)
- E-cigarette use is highest among people aged 18–24 (9.3%).
Results from the 2025 National Drug Strategy Household Survey will be released in tranches in 2026, with the first to include high level findings on tobacco, e-cigarette and nicotine use.
-
Cancer outcomes continue to improve, reflecting advances in diagnosis and treatment
- People diagnosed with cancer today are surviving longer than ever before, with 5-year relative survival increasing over time: 50% to 72% from 1987–1991 to 2017–2021.
- 5-year relative survival differs by cancer type. For 2017–2021, this was:
- over 95% for testicular, thyroid and prostate cancer
- less than 15% for pancreatic cancer and mesothelioma.
- Between 2000 and 2025, cancer diagnoses among people in their 30s and 40s have increased from:
- 121 to an estimated 135 cases per 100,000 for people in their 30s
- 280 to an estimated 313 cases per 100,000 for people in their 40s.
- However, cancer survival has improved and cancer death rates have generally declined in these ages groups.
In response to increasing rates of early onset cancer, Cancer Australia has commissioned a review to identify risk factors, research gaps and inform interventions, alongside updating general practitioner (GP) guidance to support earlier diagnosis of people with signs and symptoms of cancer. Early onset cancer is also a strategic research priority under the Cancer Australia Research Initiative.
-
Mental health conditions affect many Australians and are rising among young people
- In 2020–2022, around 1 in 5 Australians aged 16–85 (22%) had experienced a mental disorder in the previous 12 months. This was higher in females (25%) than males (18%).
- The proportion of young people (aged 16–24) experiencing a mental disorder has increased over time (26% to 39% from 2007 to 2020–2022), however the overall proportion has remained stable.
- In 2024–25, 1 in 10 Australians received Medicare subsidised mental health services (or 2.8 million people).
- Young adults aged 18–34 had the highest rates of use, compared with other age groups. The higher rates among young adults were largely driven by females, with rates almost twice that of males.
While Australia performs well internationally in terms of the scope and scale of mental health-related activity able to be reported publicly, there are a number of data gaps. These include psychosocial support services outside of the NDIS, mental health services contracted by Primary Health Networks, other NGO services, mental health services delivered in educational settings and services covered under private health insurance.
- There was an almost 9% increase in the rate of people receiving Medicare subsidised mental health services, from: 94 patients per 1,000 population in 2015–16 to 102 patients per 1,000 population in 2024–25.
- The largest rate increase was for females aged 25–34, increasing by 26% over the decade from 149 patients per 1,000 population in 2015–16 to 188 patients in 2024–25. This peaked at 201 patients per 1,000 in 2021–22, as access expanded to support mental health impacts from the COVID-19 pandemic.
- Use of mental health related medications has increased overall between 2015–16 and 2024–25, with increased dispensing of:
- Antidepressants – up from 120 to 139 people per 1,000
- Psychostimulants, agents used for ADHD and nootropics – up from 6 to 28 people per 1,000.
- Spending on mental health services has risen in the past decade, accounting for inflation. This was driven by increased spending on state and territory specialised mental health services: $466 per person in 2014–15 and $537 per person in 2023–24.
-
Hospitals are still in demand, and wait times have increased
- In 2024–25, of people aged 15 and over:
- 1 in 8 were admitted to hospital (13%, or 2.8 million people)
- 1 in 6 visited an emergency department (16%, or 3.4 million people).
- In Australia, there were:
- 12.8 million hospital admissions in 2024–25
- 9.1 million emergency department presentations in 2024–25.
- The rate of emergency department presentations per 1,000 population has decreased in recent years, following a peak during the initial years of the COVID-19 pandemic:
- 316 presentations per 1,000 population in 2015–16
- 340 presentations per 1,000 population in 2020–21
- 328 presentations per 1,000 population in 2024–25.
- In 2024–25, there were 416 hospital admissions per 1,000 people. This rate has fluctuated over the last 10 years, with a rate of 413 in 2015–16.
- The share of emergency department patients ‘seen on time’ (care starting within the triage time target) decreased from 74% in 2015–16 to 67% in 2024–25.
- There were 791,000 admissions from public hospital elective surgery waiting lists in 2024–25, compared with 712,000 in 2015–16.
- 50% of patients were admitted for elective surgery within 45 days in 2024–25, compared with 37 days in 2015–16.
-
Visiting GPs and dentists have many benefits, but cost, availability and wait times are key barriers
- Of the 18.5 million Australians aged 15 and over who needed to see a GP in 2024–25:
- 1 in 4 (27%) reported delaying their GP visit at least once or did not see a GP. This is the same as a decade prior (27% in 2015–16).
- 1 in 13 (7.7%) reported delaying or not seeing a GP due to cost. This has increased from 4.1% in 2015–16.
- In 2024–25, 78% of GP attendances were bulk-billed, down from 85% in 2015–16. Since the introduction of the initiatives, the GP bulk billing rate has increased and in January-March 2026 it was 82%.
The Australian Government has introduced a range of initiatives intended to support improved access to GP services and affordability, including expanding the bulk billing incentives, increasing the GP workforce and introducing new care models.
See the Medicare statistics collection for the most recent bulk-billing data and Medicare bulk billing of GP attendances for data by age and geographical areas.
- In 2024–25, among people aged 15 and over:
- Just over half (54%) reported seeing a dental professional in the last 12 months, up from 48% in 2015–16.
- 1 in 4 (25%) who needed to see a dental professional, delayed or did not use dental services.
- Cost was a common reason for not seeing a dentist (16% of those who needed to see a dental professional).
- $13.2 billion was spent on dental services in Australia in 2023–24; 61% paid by patients directly (around $8.0 billion).
- After adjusting for inflation, out-of-pocket costs on dental services has increased at an average annual growth rate of 2.9%, up from $5.7 billion in 2012–13.
-
Australia’s health spending and healthcare workforce continues to increase
- In 2023–24, after accounting for inflation Australia spent an estimated $270.5 billion on health goods and services. This includes spending by Governments, health insurance providers, individuals and other non-government sources.
- Hospital care accounted for the largest share of total health spending ($113.8 billion, or 42%).
- Primary health care (including public health) accounted for $89.1 billion, or 33%.
- The gap between expenditure on hospital services and primary health care (including public health) as a share of total health spending continues to widen.
- Total health spending per person (adjusted for inflation) was $8,615 per person 2014–15 and $10,037 per person 2023–24.
- Out-of-pocket spending remains the largest non-government contribution, reaching $44 billion or $1,634 per person. This has increased on average 1.4% each year since 2013–14.
- Between 2015 and 2024, there was a 26% increase in the number of registered healthcare professionals actively working in their field per 1,000 population.
- Growth was highest in allied health (52%), nurses and midwives (21%) and medical practitioners (15%).
-
Immunisation coverage among children is falling
- The impact of infectious diseases is greatly reduced by the National Immunisation Program, but immunisation coverage rates among children have fallen in recent years. Between 2020 and September 2025:
- 1-year-olds: 95% to 92%
- 2-year-olds: 93% to 90%
- 5-year-olds: 95% to 93%.
-
While death rates overall have improved, differences across population groups show the effect of inequality
- After adjusting for age-differences, in the 2022–2024 period, death rates were:
- 1.6 times as high among those living in Very remote areas, compared with people in Major cities (774 deaths and 497 deaths per 100,000, respectively).
- 1.5 times as high among those living in the lowest socioeconomic areas, compared with people in the highest socioeconomic areas (631 deaths and 418 deaths per 100,000, respectively).
Health of First Nations people
-
Australia’s First Nations population is growing
- In Australia as at 30 June 2021, there was an estimated 984,000 Aboriginal and Torres Strait Islander (First Nations) people.
- There has been a 47% increase in the First Nations population in 10 years. The increase in the First Nations population since 2011 is not completely explained by demographic factors. Other factors, such as changing identification in the Census and throughout life, greater participation and a higher response rate to the question on Indigenous status in the 2021 Census, have also contributed.
- Life expectancy at birth in 2020–2022 was 71.9 years for males and 75.6 years for females.
- Overall, the First Nations population has a relatively young age profile, with a median age of 24 years (at 30 June 2021).
- At 30 June 2021, of First Nations people in Australia:
- 85% lived in non-remote areas (including: 41% Major cities, 25% Inner regional areas, 19% Outer regional areas)
- 15% lived in Remote and very remote areas.
-
Decreasing burden of disease among First Nations people
- The burden of disease among First Nations people decreased by 6.3% between 2011 and 2022 (from 455 to 430 disability-adjusted life years per 1,000 people, after adjusting for age), driven by declines in the burden due to premature deaths from cardiovascular diseases.
Burden of disease measures the health impact of diseases and injuries on a population. Disease burden (or total burden) combines the years of healthy life lost due to living with ill health (non-fatal burden) with the years of life lost due to dying prematurely (fatal burden).
-
Tobacco smoking and risky alcohol use are declining among First Nations people
- The proportion of First Nations people aged 15 and over who:
- consume alcohol at risky levels has declined (from 48% to 33% between 2010 and 2022–23)
- smoke tobacco daily (excluding e-cigarettes/vapes) has declined (from 37% to 29% between 2018–19 and 2022–23).
- First Nations people are more likely to abstain from alcohol than non-Indigenous Australians. In 2022–23, 13% of First Nations people aged 15 and over had never consumed alcohol and a further 17% had not consumed alcohol in the previous year.
-
Eye and hearing health problems among First Nations children have improved over the last 2 decades
- The proportion of children aged 0–14 who reported a long-term ear or hearing problem has decreased: from 11.2% in 2001 to 4.9% 2022–23.
- The proportion of children aged 5–9 with trachoma among at-risk communities has decreased: from 14.3% in 2007 to 1.5% in 2024.
The successful reduction of trachoma (an infectious disease that can lead to blindness) means trachoma no longer represents a public health problem in Australia.
-
Use of First Nations-specific health care is increasing
- In 2024–25, around 4.0 million episodes of care were provided by First Nations-specific primary health care organisations, up from 3.7 million in 2018–19.
- The number of clients seen by these organisations has increased over time: from 498,000 clients 2018–19 and 517,000 clients 2024–25.
- 25% of First Nations people had an annual health check in 2024 (compared with 23% in 2022). 4 in 10 had a follow-up service within 6 months. These are Medicare-funded health checks available to all First Nations people that are tailored to their needs.
-
Despite progress in the health of First Nations people, inequities remain and further improvement is needed
- After adjusting for age differences between populations, First Nations people had higher rates of:
- disease burden: 2.1 times as high as the rate among non-Indigenous Australians in 2022. This gap has narrowed since 2011
- mortality: 1.9 times as high as the rate among non-Indigenous Australians in 2022–2024.
- First Nations people had a lower life expectancy at birth than non-Indigenous Australians in 2020–2022 (9-year gap for males and 8-year gap for females).
- 20% of the total burden in 2022 was due to mental health conditions and substance use disorders (the leading contributor).
- 70% of First Nations people reported living with one or more chronic conditions in 2022–23, compared with 67% in 2018–19.
- 58% of deaths among First Nations people aged under 75 during 2022–2024 were from potentially avoidable causes such as coronary heart disease, diabetes, chronic obstructive pulmonary disease and suicide.
How does Australia's health compare with other countries?
-
Australia performs well internationally across many health measures, based on the latest internationally comparable data
- Life expectancy at birth in Australia is above the OECD average (83.0 years Australia and 81.1 years OECD average).
- Based on the Global Burden of Disease Study, Australians spend more years living with disability (YLD, or non-fatal burden) but have fewer years of life lost (YLL, or fatal burden) due to premature death, compared with the average for OECD countries:
- Non-fatal burden: Australia 125 YLD per 1,000 people and OECD average 120 YLD per 1,000 people
- Fatal burden: Australia 77 YLL per 1,000 people and OECD average 120 YLL per 1,000 people.
- Annually, Australia spends more on health care than the OECD average (AUD $8,400 per person, compared with AUD $10,500 per person).
- Compared with OECD countries, Australians:
- are less likely to smoke daily (8.5%, compared with OECD average of 15%)
- are more likely to vape regularly (5.7%, compared with OECD average of 4.8%)
- consume more alcohol on average (9.8 litres per person per year, compared with OECD average of 8.4 litres per person per year)
- are more likely to live with overweight or obesity (64%, compared with OECD average of 59%).
-
Australians with chronic conditions report more positive experiences of health care compared with other countries
- The Patient Reported Indicator Survey (PaRIS) compares the wellbeing and care experiences of people in 19 countries, who are aged 45 and over and living with at least one chronic condition. A higher percentage for each indicator is indicative of a better experience or outcome.
- Australia scored above or close to the PaRIS average for all patient experiences:
- Quality of care (94% for Australia and 87% for PaRIS average)
- Care needs and preferences met (93% for Australia and 87% for PaRIS average)
- Care was well co-ordinated across different settings (74% for Australia and 59% for PaRIS average)
- Trust in healthcare system (64% for Australia and 62% for PaRIS average)
- Confidence in managing their own health (61% for Australia and 59% for PaRIS average).
- Australia scored around the PaRIS average for all patient outcomes:
- Mental health (81% for Australia and 83% for PaRIS average)
- Social functioning (80% for Australia and 83% for PaRIS average)
- General health (74% for Australia and 66% for PaRIS average)
- Physical health (74% for Australia and 70% for PaRIS average)
- Well-being (70% for Australia and 71% for PaRIS average).
Next page
Focus areas summaries