The Indigenous population key points
Population demographics
In 2014, there were about 713,600 Aboriginal and Torres Strait Islander people in Australia, accounting for 3.0% of the total population. In 2011, 10% of the Indigenous population identified as being of Torres Strait Islander origin (63,700 people); almost two-thirds (63%) of the Torres Strait Islander population lived in Queensland.
The Indigenous population has a relatively young age structure. In 2011, the median age was 21.8 years compared with 37.6 years for the non-Indigenous population. Over one-third (36%) were aged under 15 compared with 18% of non-Indigenous people.
Age structure of the Australian population, by Indigenous status, 30 June 2011
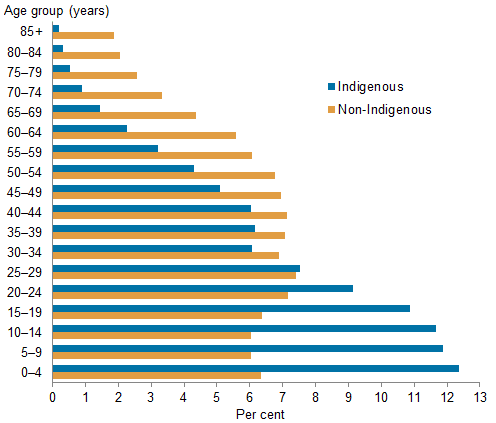
The birth rate for Indigenous women is relatively high. In 2013, the total fertility rate for Indigenous women was 2.3 babies per woman, compared with 1.9 for all women. The average number of children ever born to Indigenous women aged 40–44 fell from 4.55 children in 1981 to 2.63 children in 2011.
Geographical distribution
Most Indigenous Australians live in non-remote areas (79% in 2011) rather than remote areas (21%). By comparison, 98% of non-Indigenous Australians live in non-remote areas, while 2% live in remote areas.
Indigenous and non-Indigenous population, by remoteness, 30 June 2011
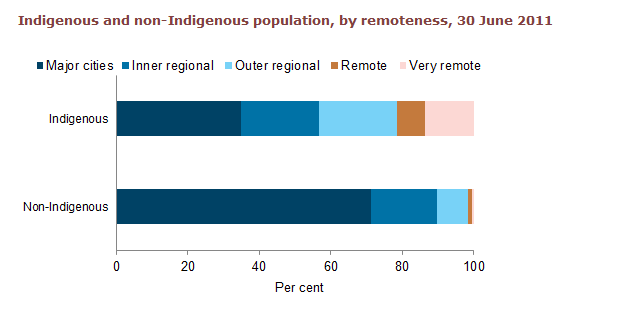
Of all people living in remote areas, the proportion who are Indigenous is relatively high. In 2011, 45% of people living in Very remote areas and 16% of people living in Remote areas were Indigenous.
In 2014, almost one-third (30%) of people living in the Northern Territory were Indigenous, compared with 5% or less in other jurisdictions.
Household composition
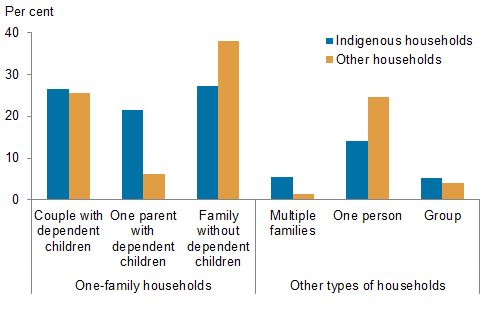
In 2011, 2.7% of all households were Indigenous households (an estimated 209,000 households). Indigenous households comprised an average of 3.3 people compared with 2.6 people in other households. About 1 in 5 Indigenous households (21%) were a one-parent family with dependent children in 2011 compared with 6% of other households.
Composition of households, by Indigenous status, 2011
Culture and language
Of the more than 250 known Australian Indigenous languages, about 120 were still spoken in 2012. By comparison, 145 Indigenous languages were spoken in 2005. According to the 2011 Census, 11% of Indigenous people spoke an Indigenous language at home, which was the same proportion as recorded in the 2006 Census.
In 2012–13:
- almost 2 in 3 Indigenous adults (63%) identified with a regional group, tribal group, language group, clan or mission, and rates of identification were higher with increasing remoteness
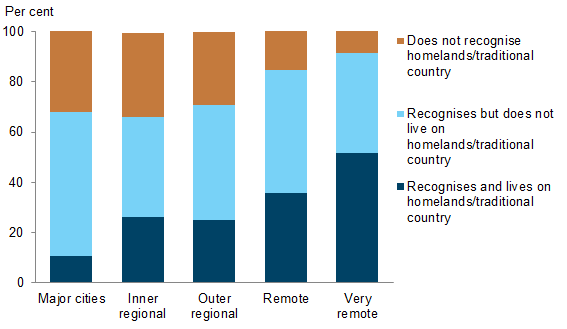
- almost 3 in 4 Indigenous adults (73%) recognised an area as their homelands or traditional country, and the proportion who did so was highest in Very remote areas (91%)
- 1 in 4 Indigenous adults (25%) lived on their homelands or traditional country; those in remote areas were most likely to live on their homelands or traditional country (36% in Remote areas and 52% in Very remote areas).
Indigenous adults who recognise and live on homelands or traditional country, by remoteness, 2012–13