Baby characteristics
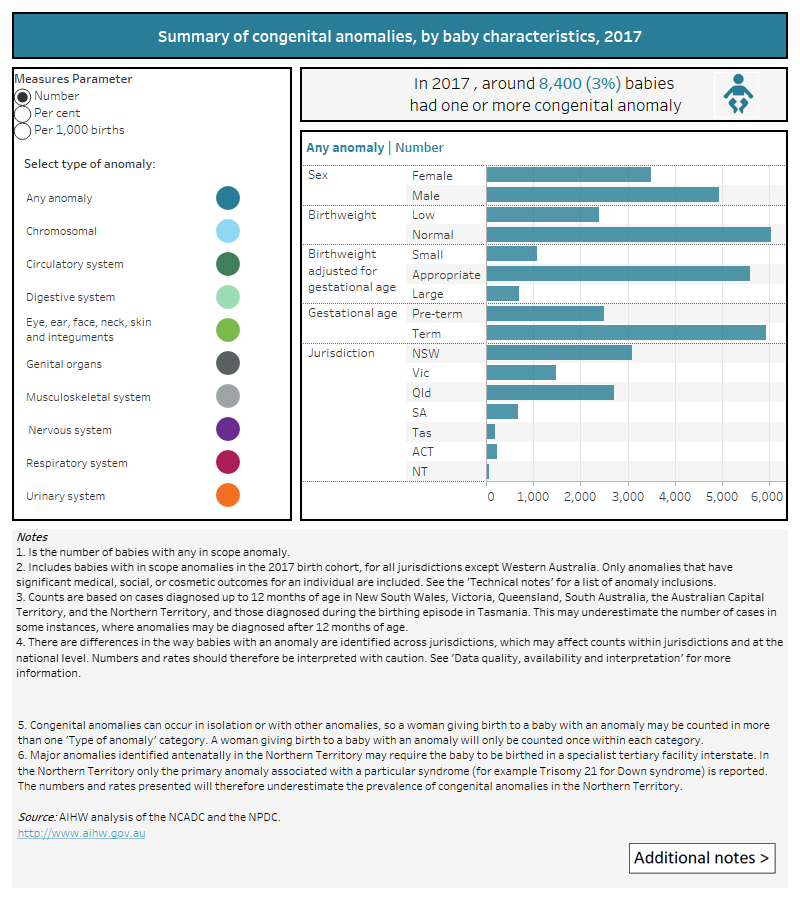
This section looks at congenital anomalies by various baby characteristics. In 2017, 58% of babies with any anomaly were male and 42% were female. Rates of anomalies per 1,000 births were similar for males and females across many body systems. However, genital organ anomalies were more common in males (5.4 compared with 0.3 per 1,000 births for females), largely due to cases of hypospadias in males. Urinary system anomalies were also more common in males (6.1 compared with 3.1 per 1,000 births for females) due to higher numbers across a range of urinary system anomalies.
Nearly three-quarters of babies with any anomaly were born at term (70%) and had a normal birthweight (72%). However, this varied by type of anomaly; for example, the proportion of babies with a normal birthweight was lower in babies born with a nervous system anomaly (51%) or chromosomal anomaly (51%) and higher for those born with a musculoskeletal or urinary system anomaly (81%).
Congenital anomaly rates were higher in:
- babies born pre-term (before 37 weeks’ gestation) compared with those born at or after 37 weeks (107 per 1,000 births compared with 24 per 1,000 births)
- babies born with low birthweight (less than 2,500 grams) compared with those having a normal birthweight (123 per 1,000 births compared with 24 per 1,000 births)
-
babies that were small for gestational age (that is with a birthweight below the 10th percentile for their gestational age and sex) compared with those having an appropriate birthweight for gestational age (44 per 1,000 births compared with 26 per 1,000 births).
Figure 3 shows the number, proportion and rate of babies with congenital anomalies by various baby characteristics. These include sex, birthweight, birthweight adjusted for gestational age, gestational age and state/territory of birth. The anomalies are grouped and can be filtered by body system (type of anomaly).
Figure 3. Number and rate of congenital anomalies, by baby characteristics, 2017
Number and rate of selected anomalies, by baby characteristics, 2017
This data visualisation shows the number, proportion, and rate of babies with congenital anomalies by various baby characteristics. These include sex, birthweight, birthweight adjusted for gestational age, gestational age and state of birth. Data can be filtered by body system. In 2017, congenital anomaly rates were higher in babies born pre-term, in those born with low birthweight and in those that were small for gestational age.


